| Param | Original file | Final file |
|---|---|---|
| Filename | modeM0/AS1C07_001T01_9000006454_51279cztM0_level2.fits | modeM0/AS1C07_001T01_9000006454_51279cztM0_level2_quad_clean.evt |
| Size (bytes) | 822,375,360 | 88,058,880 |
| Size | 784.3 MB | 84.0 MB |
| Events in quadrant A | 6,016,043 | 642,665 |
| Events in quadrant B | 4,068,371 | 708,872 |
| Events in quadrant C | 14,824,221 | 241,335 |
| Events in quadrant D | 4,993,348 | 587,557 |
| Mode M0 | |||
|---|---|---|---|
| Quadrant | BADHDUFLAG | Total packets | Discarded packets |
| A | 0 | 22779 | 2 |
| B | 0 | 17043 | 2 |
| C | 0 | 48733 | 3 |
| D | 0 | 19875 | 2 |
| Mode SS | |||
|---|---|---|---|
| Quadrant | BADHDUFLAG | Total packets | Discarded packets |
| A | 0 | 142 | 0 |
| B | 0 | 142 | 0 |
| C | 0 | 142 | 0 |
| D | 0 | 142 | 0 |
| Mode M9 | |||
|---|---|---|---|
| Quadrant | BADHDUFLAG | Total packets | Discarded packets |
| A | 0 | 13 | 0 |
| B | 0 | 14 | 0 |
| C | 0 | 14 | 0 |
| D | 0 | 14 | 0 |
| Quadrant | Total seconds | Saturated seconds | Saturation percentage |
|---|---|---|---|
| A | 6971 | 221 | 3.170277% |
| B | 6971 | 231 | 3.313728% |
| C | 6970 | 4693 | 67.331420% |
| D | 6970 | 309 | 4.433286% |
Noise dominated data is calculated using 1-second bins in cleaned event files. If a bin has >2000 counts, and if more than 50% of those come from <1% of pixels, then it is considered to be noise-dominated and hence unusable.
| Quadrant | # 1 sec bins | Bins with >0 counts | Bins with >2000 counts | High rate bins dominated by noise | Noise dominated (total time) | Noise dominated (detector-on time) | Marked lightcurve |
|---|---|---|---|---|---|---|---|
| A | 7881 | 6971 | 64 | 64 | 0.81% | 0.92% | 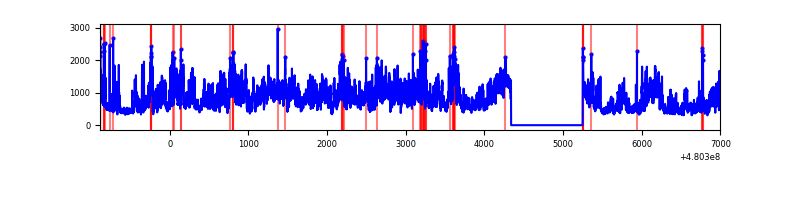 |
| B | 7881 | 6971 | 132 | 132 | 1.67% | 1.89% | 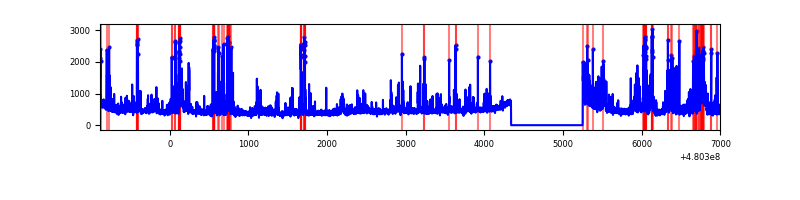 |
| C | 7880 | 6970 | 4722 | 4722 | 59.92% | 67.75% | 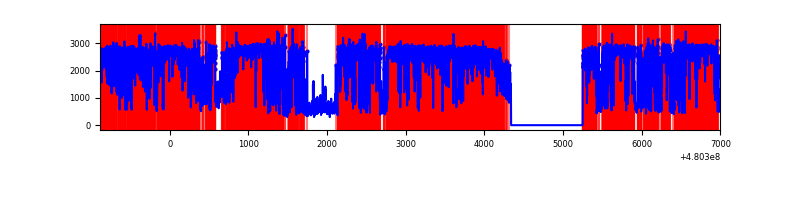 |
| D | 7880 | 6971 | 265 | 265 | 3.36% | 3.80% | 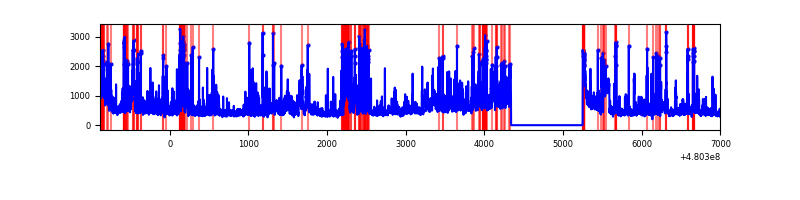 |
Top three noisy pixels from each quadrant. If the there are fewer than three noisy pixels in the level2.evt file, extra rows are filled as -1
| Pixel properties | Quadrant properties | ||||||
|---|---|---|---|---|---|---|---|
| Quadrant | DetID | PixID | Counts | Sigma | Mean | Median | Sigma |
| A | 12 | 3 | 2022392 | 11286.69 | 711 | 694 | 179.1 |
| A | 9 | 160 | 371635 | 2070.88 | 711 | 694 | 179.1 |
| A | 12 | 194 | 234948 | 1307.79 | 711 | 694 | 179.1 |
| B | 5 | 185 | 695641 | 4587.9 | 717 | 691 | 151.5 |
| B | 10 | 247 | 96243 | 630.81 | 717 | 691 | 151.5 |
| B | 10 | 60 | 90437 | 592.48 | 717 | 691 | 151.5 |
| C | 4 | 12 | 10314343 | 84081.25 | 439 | 434 | 122.7 |
| C | 10 | 171 | 2291630 | 18678.33 | 439 | 434 | 122.7 |
| C | 1 | 45 | 151823 | 1234.16 | 439 | 434 | 122.7 |
| D | 3 | 12 | 747854 | 3910.67 | 680 | 655 | 191.1 |
| D | 8 | 176 | 450810 | 2356.01 | 680 | 655 | 191.1 |
| D | 10 | 181 | 264913 | 1383.07 | 680 | 655 | 191.1 |
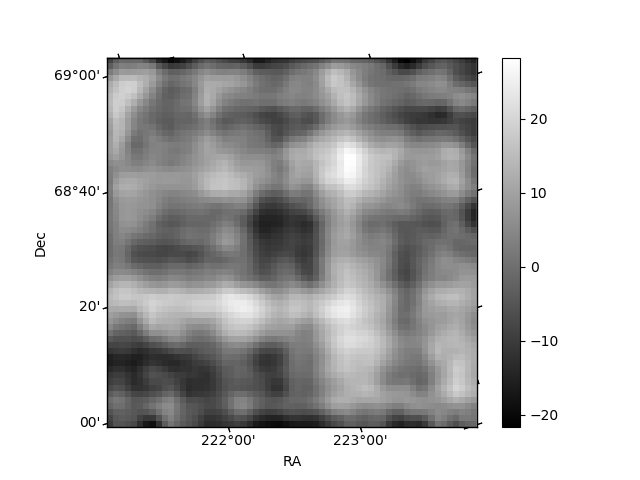
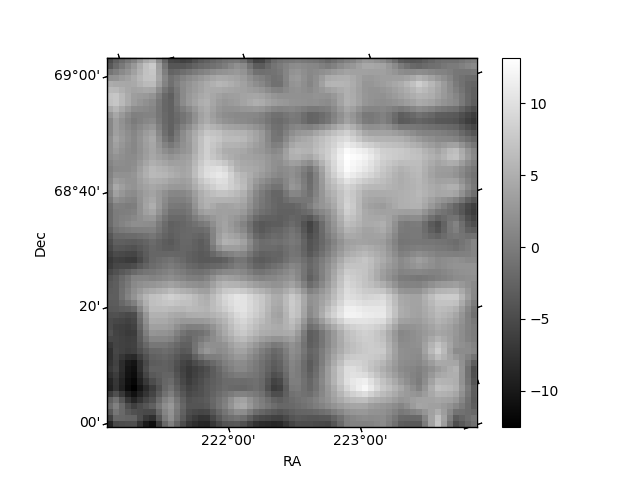
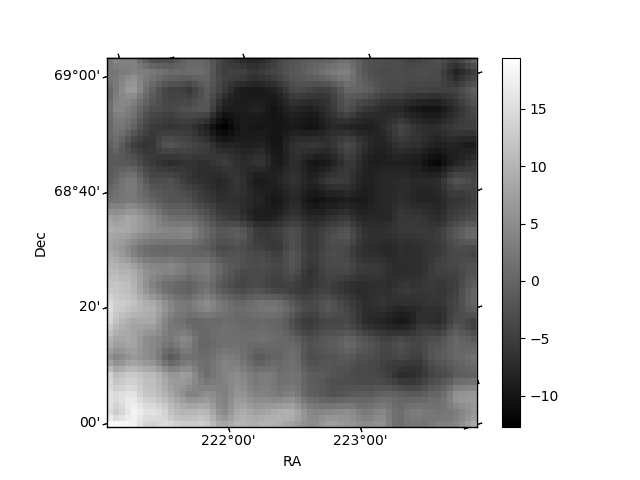
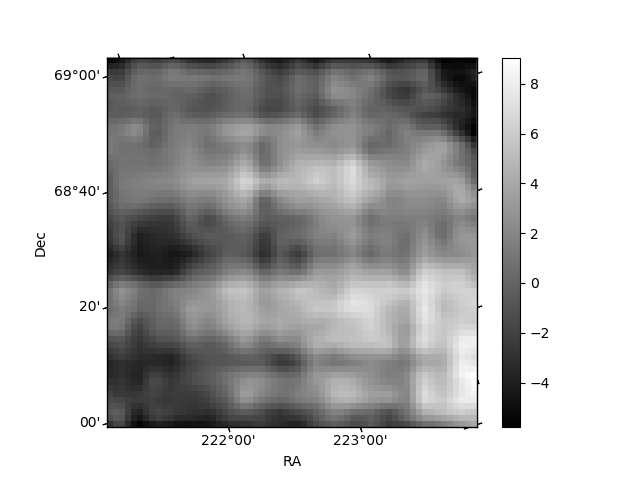
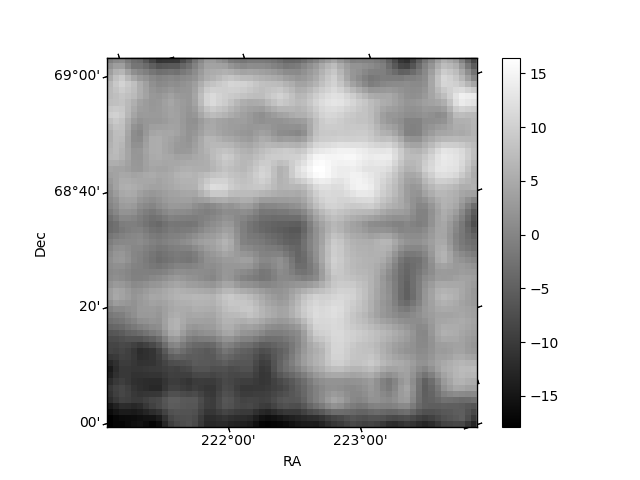
Histogram calculated using DETX and DETY for each event in the final _common_clean file
| Quadrant A | 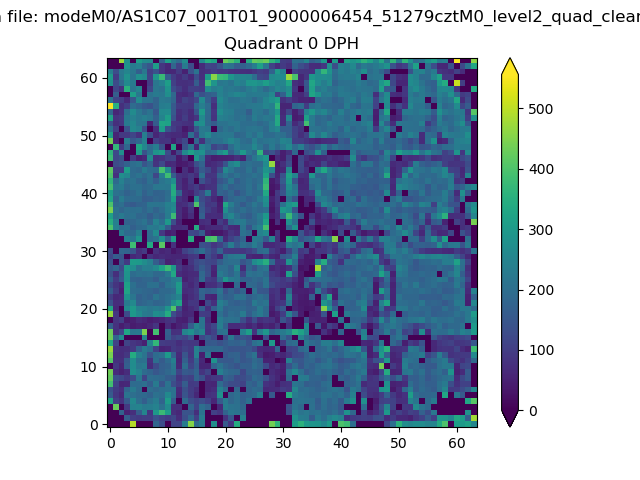 |
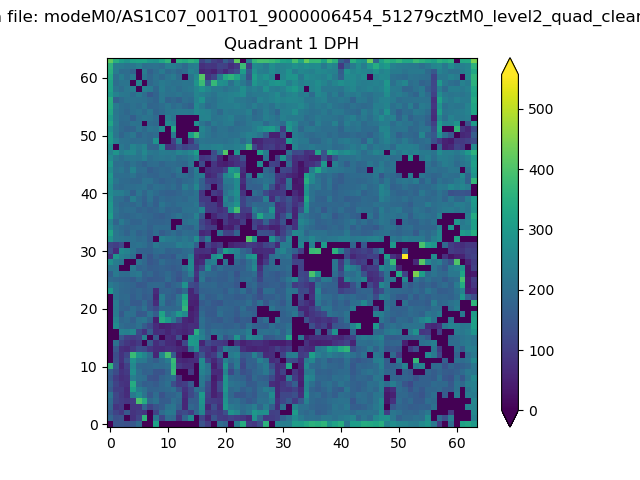 |
Quadrant B |
|---|---|---|---|
| Quadrant D | 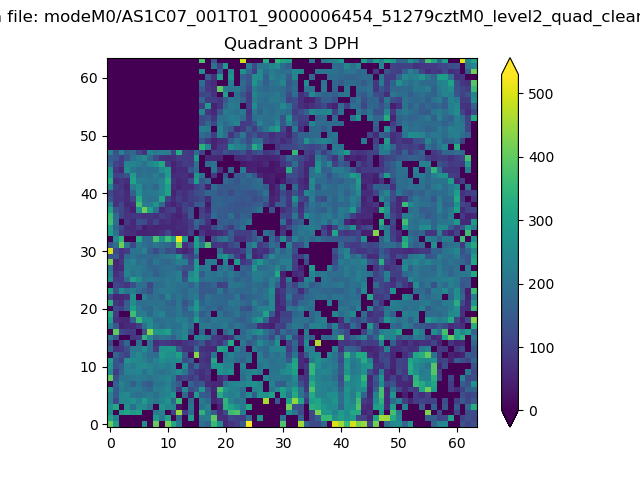 |
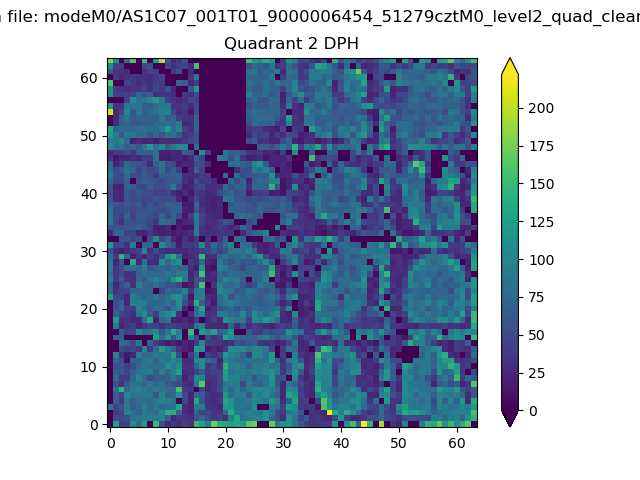 |
Quadrant C |
| Plot type | Count rate plots | Images |
|---|---|---|
| Comparison with Poisson distribution Blue bars denote a histogram of data divided into 1 sec bins. Red curve is a Poisson curve with rate = median count rate of data. |
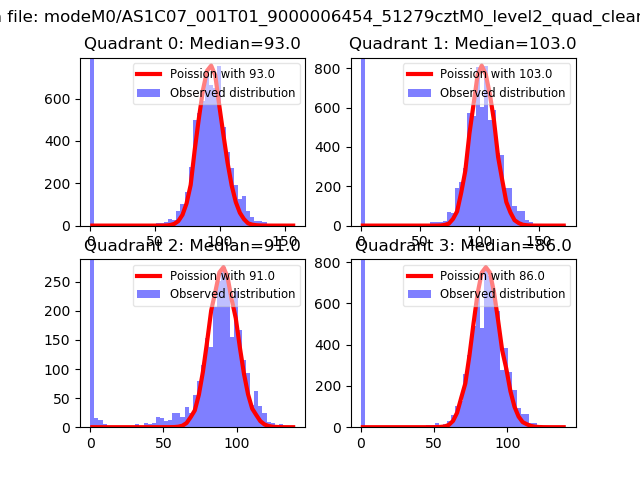 |
 |
| Quadrant-wise count rates Data is divided into 100 sec bins |
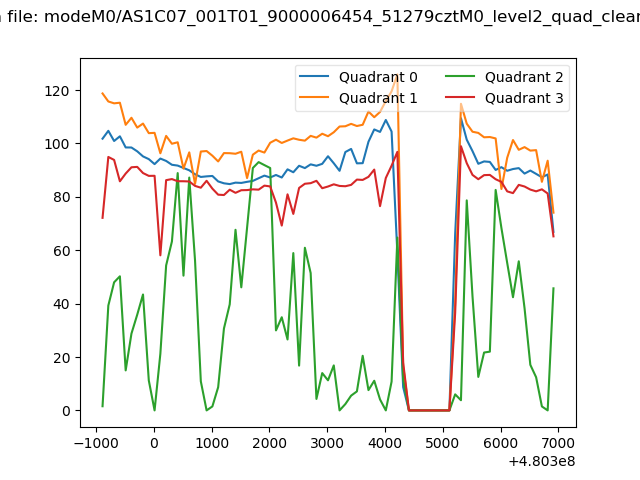 |
|
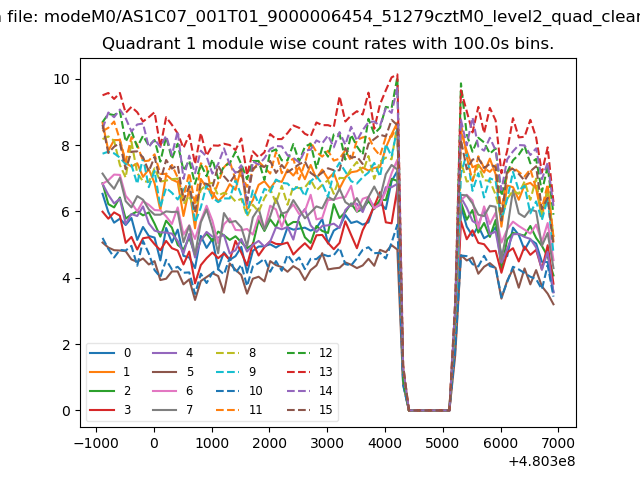
| Module-wise count rates for Quadrant A Data is divided into 100 sec bins |
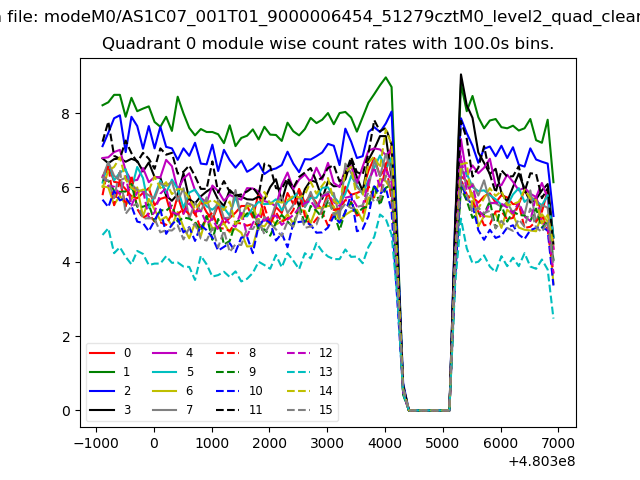 |
 |
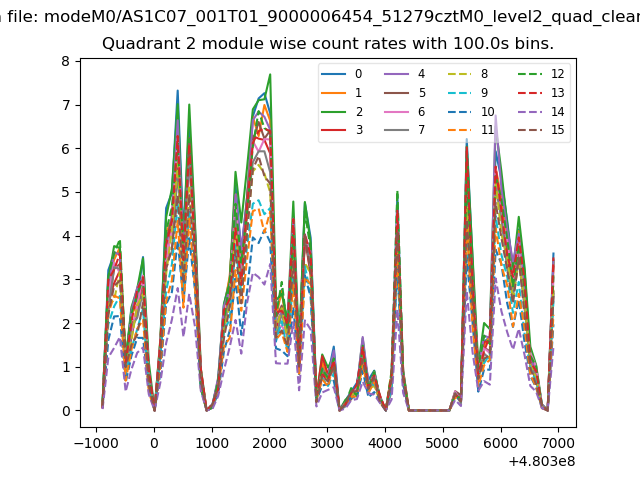
| Module-wise count rates for Quadrant B Data is divided into 100 sec bins |
 |
 |
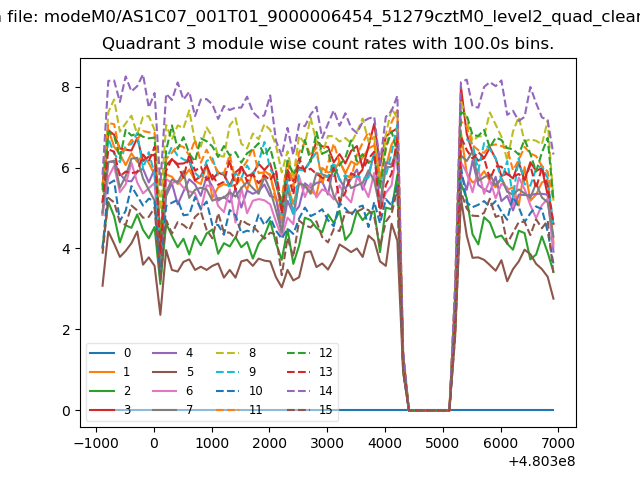
| Module-wise count rates for Quadrant C Data is divided into 100 sec bins |
 |
 |
| Module-wise count rates for Quadrant D Data is divided into 100 sec bins |
 |
 |
| Parameter | Plot |
|---|---|
| CZT HV Monitor | 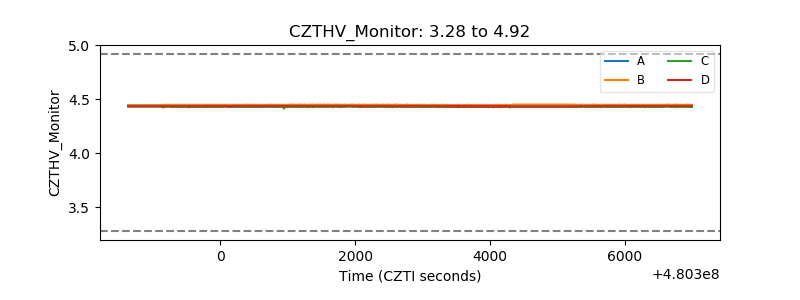 |
| D_VDD | 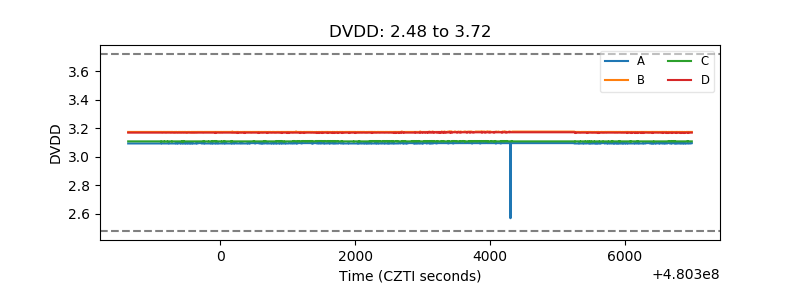 |
| Temperature 1 | 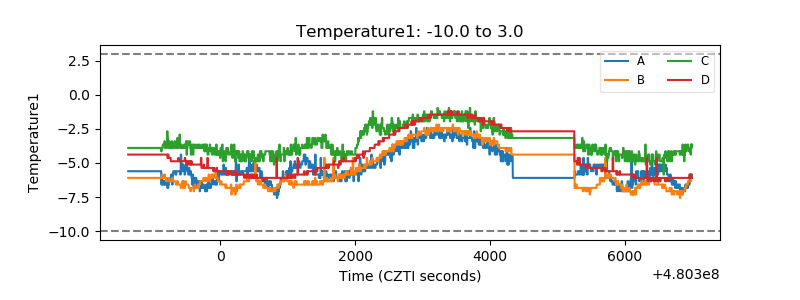 |
| Veto HV Monitor | 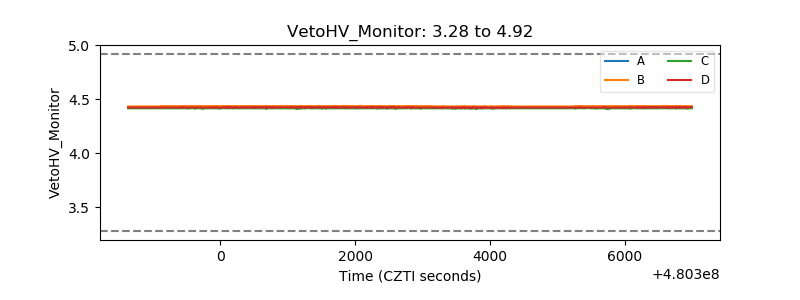 |
| Veto LLD | 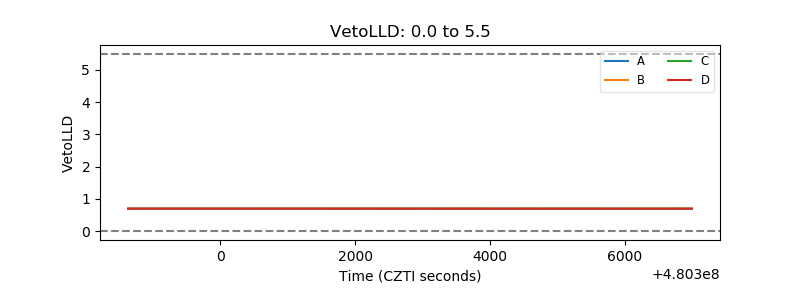 |
| Alpha Counter | 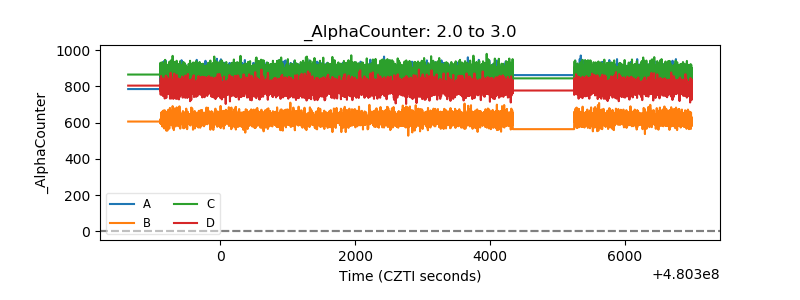 |
| _CPM_Rate | 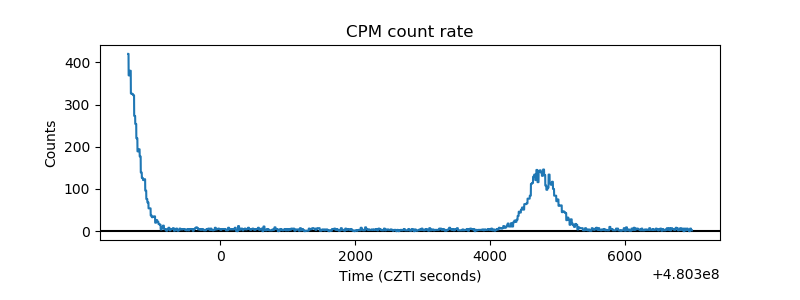 |
| CZT Counter | 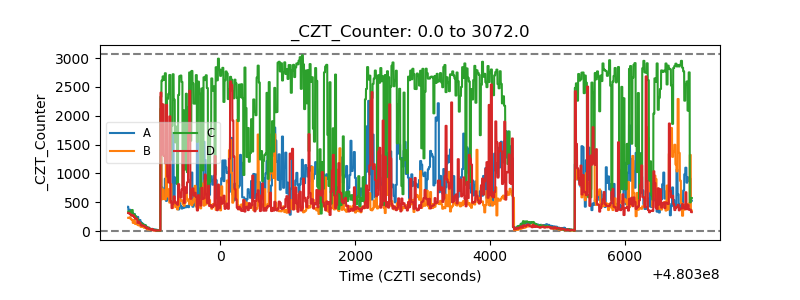 |
| +2.5 Volts monitor | 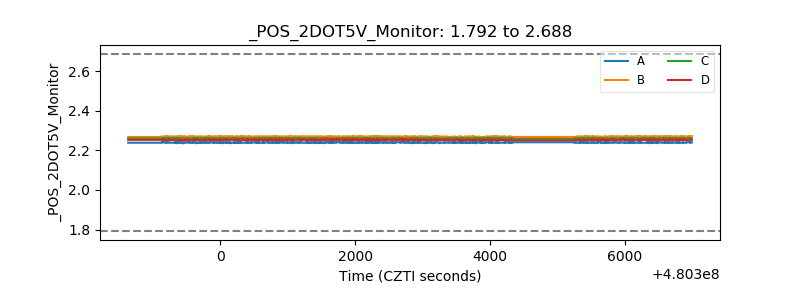 |
| +5 Volts monitor |  |
| _ROLL_ROT | 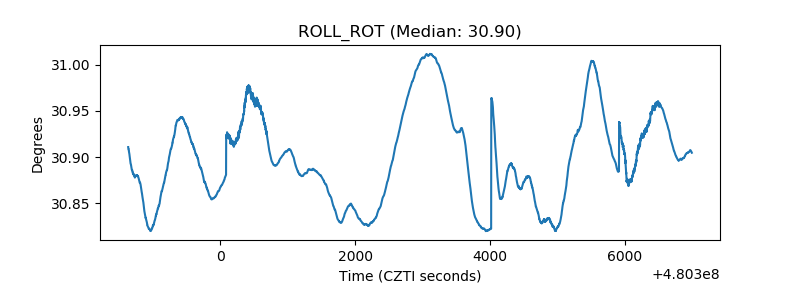 |
| _Roll_DEC | 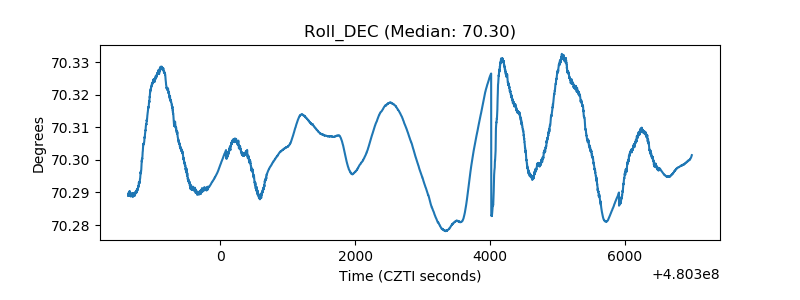 |
| _Roll_RA | 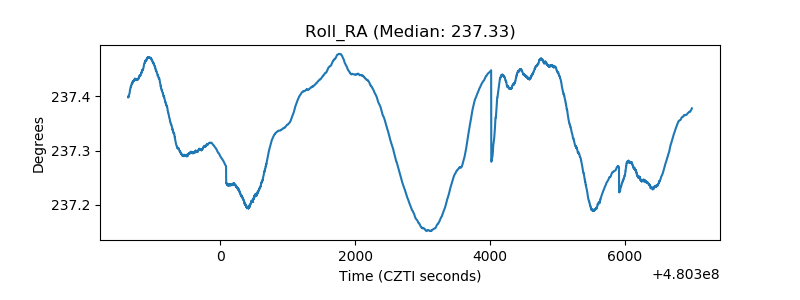 |
| Veto Counter | 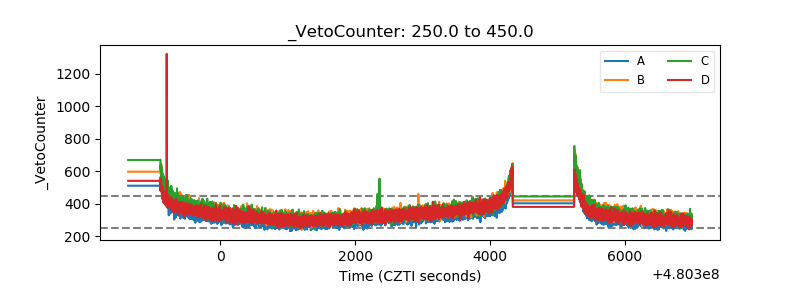 |