| Param | Original file | Final file |
|---|---|---|
| Filename | modeM0/AS1C07_001T01_9000006454_51280cztM0_level2.fits | modeM0/AS1C07_001T01_9000006454_51280cztM0_level2_quad_clean.evt |
| Size (bytes) | 845,752,320 | 95,460,480 |
| Size | 806.6 MB | 91.0 MB |
| Events in quadrant A | 5,901,728 | 693,224 |
| Events in quadrant B | 5,162,647 | 738,914 |
| Events in quadrant C | 14,904,160 | 306,114 |
| Events in quadrant D | 4,763,290 | 635,346 |
| Mode M0 | |||
|---|---|---|---|
| Quadrant | BADHDUFLAG | Total packets | Discarded packets |
| A | 0 | 22750 | 2 |
| B | 0 | 20630 | 2 |
| C | 0 | 49263 | 4 |
| D | 0 | 19721 | 2 |
| Mode SS | |||
|---|---|---|---|
| Quadrant | BADHDUFLAG | Total packets | Discarded packets |
| A | 0 | 150 | 0 |
| B | 0 | 150 | 0 |
| C | 0 | 150 | 0 |
| D | 0 | 150 | 0 |
| Mode M9 | |||
|---|---|---|---|
| Quadrant | BADHDUFLAG | Total packets | Discarded packets |
| A | 0 | 12 | 0 |
| B | 0 | 13 | 0 |
| C | 0 | 13 | 0 |
| D | 0 | 13 | 0 |
| Quadrant | Total seconds | Saturated seconds | Saturation percentage |
|---|---|---|---|
| A | 7433 | 169 | 2.273645% |
| B | 7433 | 445 | 5.986816% |
| C | 7432 | 4529 | 60.939182% |
| D | 7432 | 294 | 3.955867% |
Noise dominated data is calculated using 1-second bins in cleaned event files. If a bin has >2000 counts, and if more than 50% of those come from <1% of pixels, then it is considered to be noise-dominated and hence unusable.
| Quadrant | # 1 sec bins | Bins with >0 counts | Bins with >2000 counts | High rate bins dominated by noise | Noise dominated (total time) | Noise dominated (detector-on time) | Marked lightcurve |
|---|---|---|---|---|---|---|---|
| A | 7953 | 7434 | 46 | 46 | 0.58% | 0.62% | 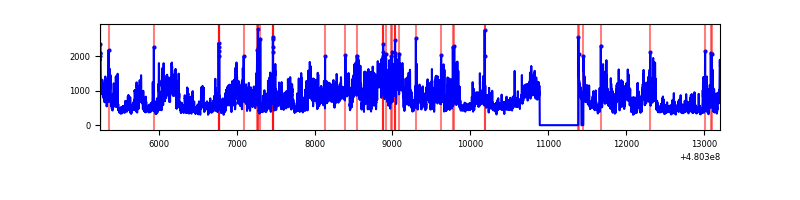 |
| B | 7953 | 7434 | 264 | 264 | 3.32% | 3.55% | 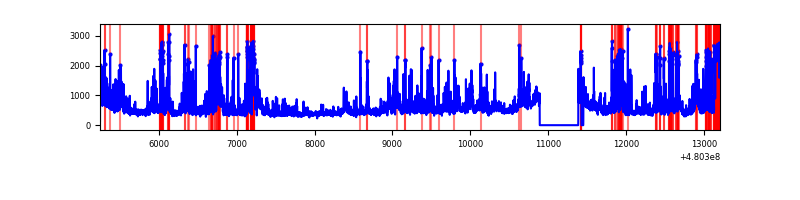 |
| C | 7952 | 7434 | 4561 | 4561 | 57.36% | 61.35% | 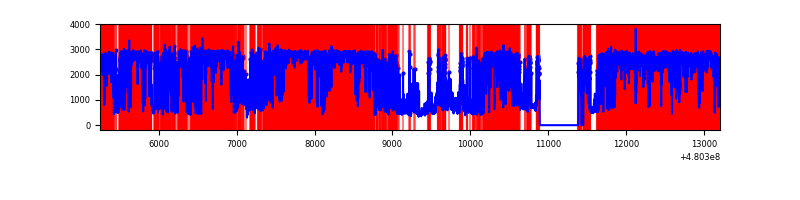 |
| D | 7952 | 7434 | 240 | 240 | 3.02% | 3.23% | 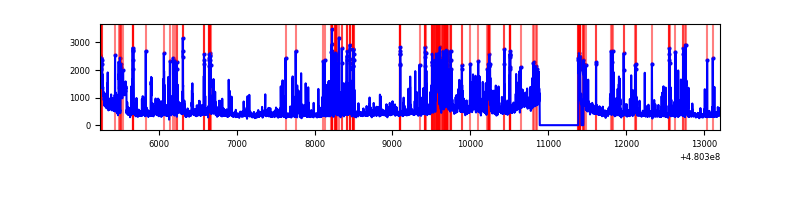 |
Top three noisy pixels from each quadrant. If the there are fewer than three noisy pixels in the level2.evt file, extra rows are filled as -1
| Pixel properties | Quadrant properties | ||||||
|---|---|---|---|---|---|---|---|
| Quadrant | DetID | PixID | Counts | Sigma | Mean | Median | Sigma |
| A | 12 | 3 | 1819996 | 9501.56 | 770 | 749 | 191.5 |
| A | 9 | 160 | 316936 | 1651.38 | 770 | 749 | 191.5 |
| A | 12 | 194 | 212762 | 1107.3 | 770 | 749 | 191.5 |
| B | 5 | 185 | 1094464 | 6696.25 | 765 | 739 | 163.3 |
| B | 4 | 170 | 313238 | 1913.25 | 765 | 739 | 163.3 |
| B | 10 | 60 | 279898 | 1709.13 | 765 | 739 | 163.3 |
| C | 4 | 12 | 11155271 | 85667.67 | 469 | 463 | 130.2 |
| C | 10 | 171 | 1283365 | 9852.54 | 469 | 463 | 130.2 |
| C | 1 | 45 | 140551 | 1075.86 | 469 | 463 | 130.2 |
| D | 12 | 2 | 526771 | 2551.32 | 734 | 705 | 206.2 |
| D | 8 | 176 | 281297 | 1360.82 | 734 | 705 | 206.2 |
| D | 10 | 181 | 270665 | 1309.25 | 734 | 705 | 206.2 |
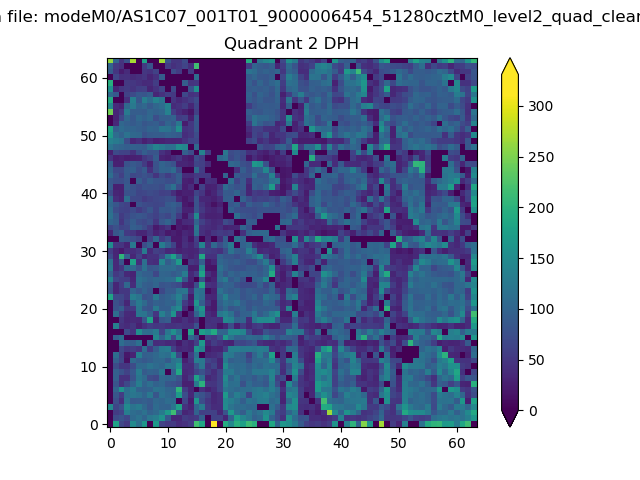
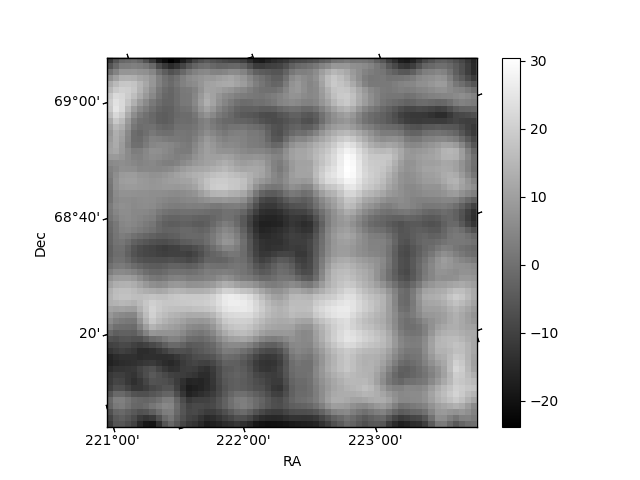
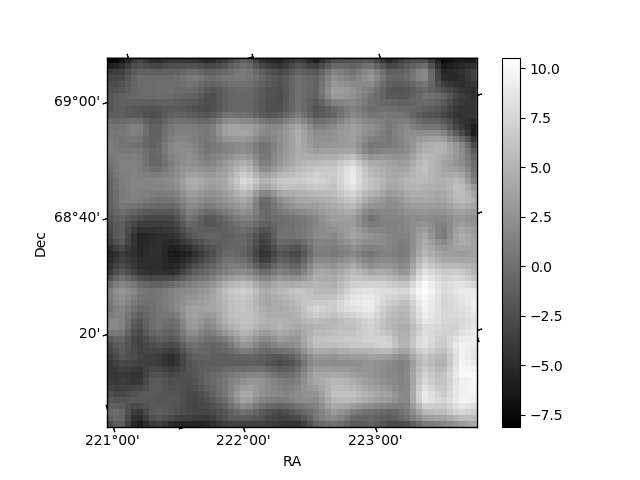
Histogram calculated using DETX and DETY for each event in the final _common_clean file
| Quadrant A | 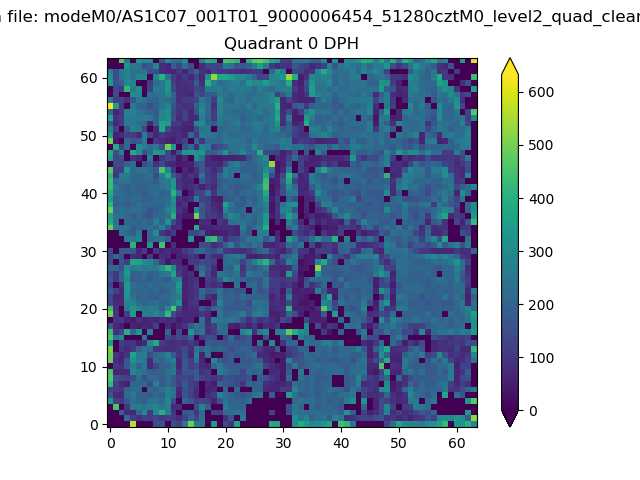 |
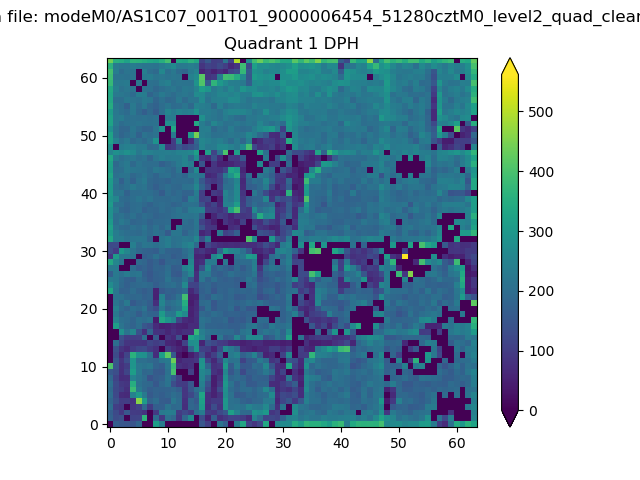 |
Quadrant B |
|---|---|---|---|
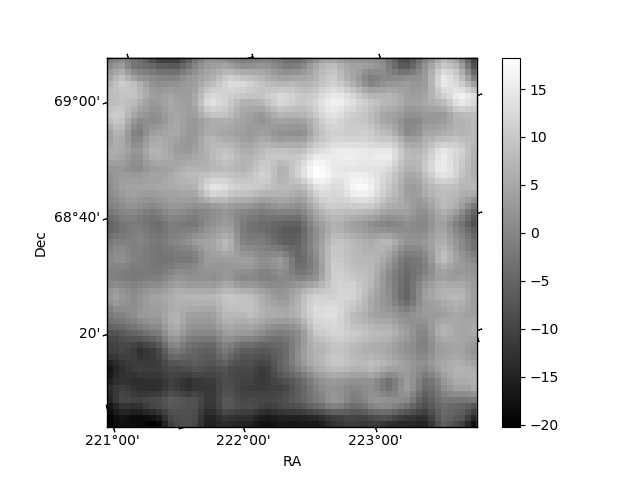
| Quadrant D | 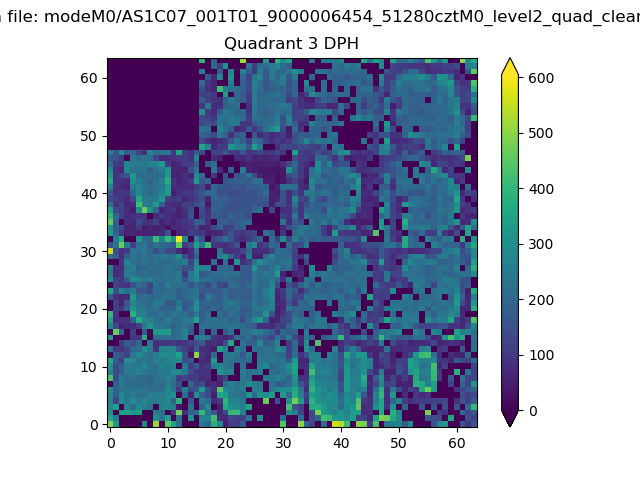 |
 |
Quadrant C |
| Plot type | Count rate plots | Images |
|---|---|---|
| Comparison with Poisson distribution Blue bars denote a histogram of data divided into 1 sec bins. Red curve is a Poisson curve with rate = median count rate of data. |
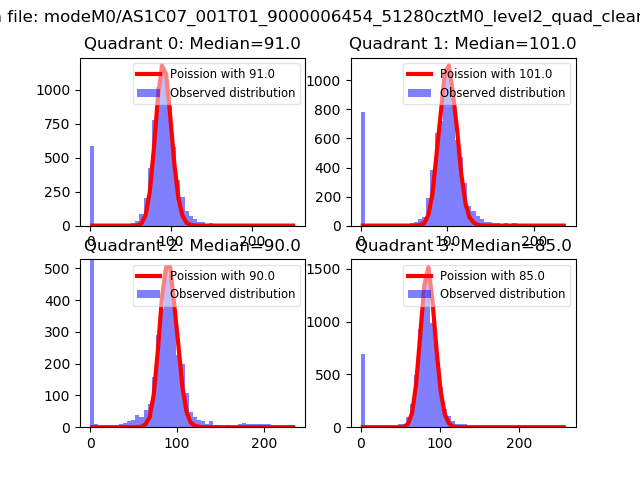 |
 |
| Quadrant-wise count rates Data is divided into 100 sec bins |
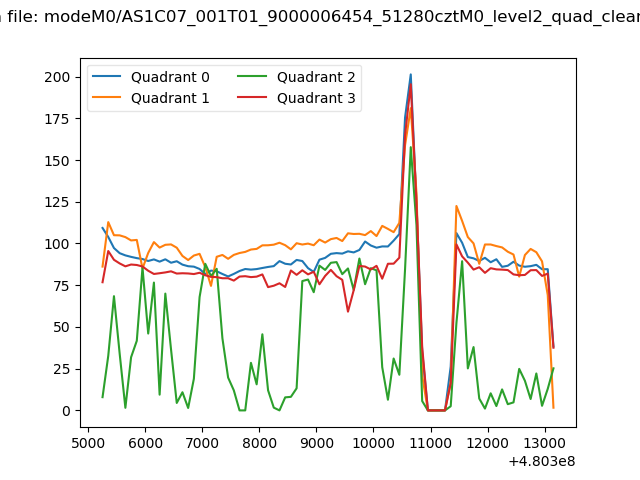 |
|
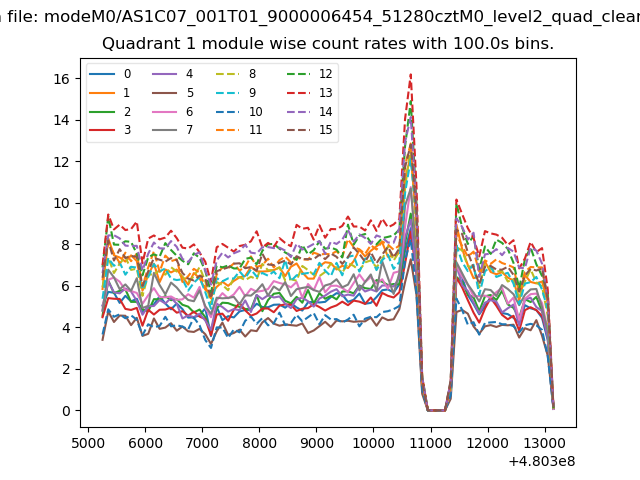
| Module-wise count rates for Quadrant A Data is divided into 100 sec bins |
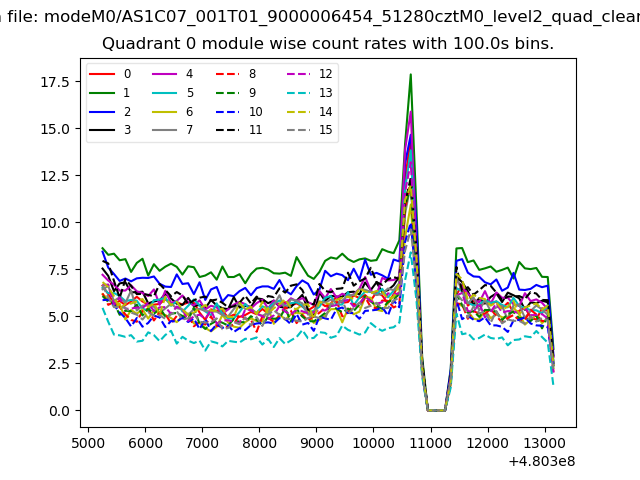 |
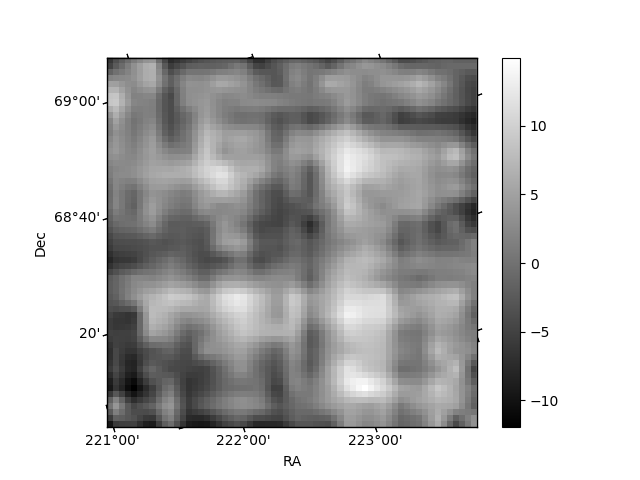 |
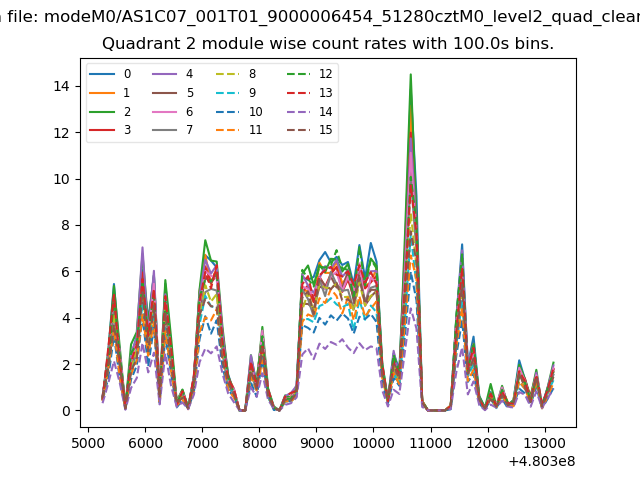
| Module-wise count rates for Quadrant B Data is divided into 100 sec bins |
 |
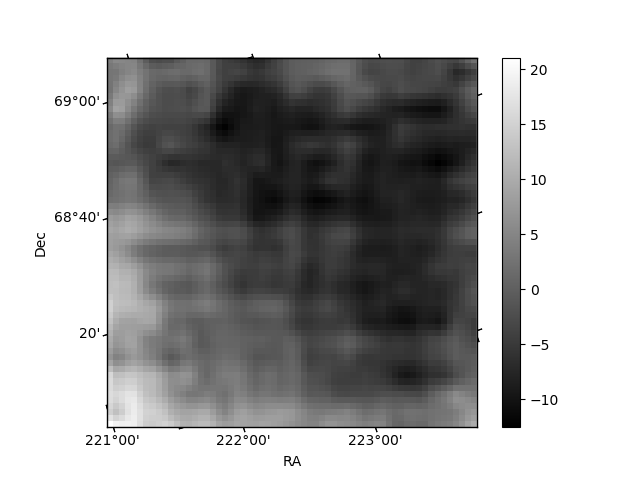 |
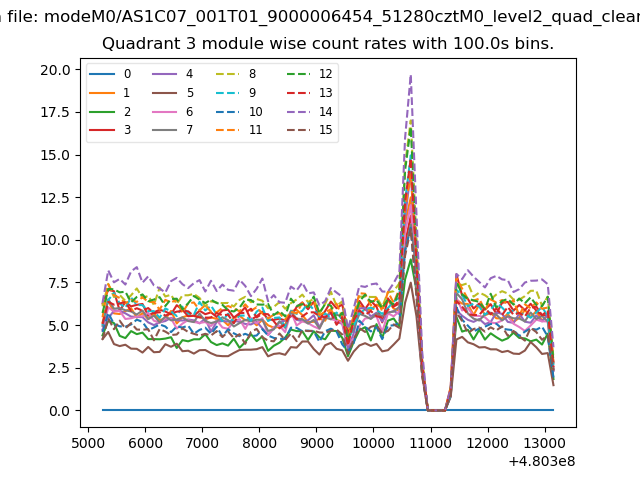
| Module-wise count rates for Quadrant C Data is divided into 100 sec bins |
 |
 |
| Module-wise count rates for Quadrant D Data is divided into 100 sec bins |
 |
 |
| Parameter | Plot |
|---|---|
| CZT HV Monitor | 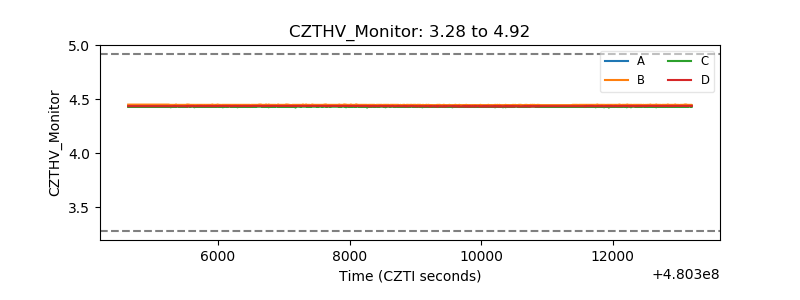 |
| D_VDD | 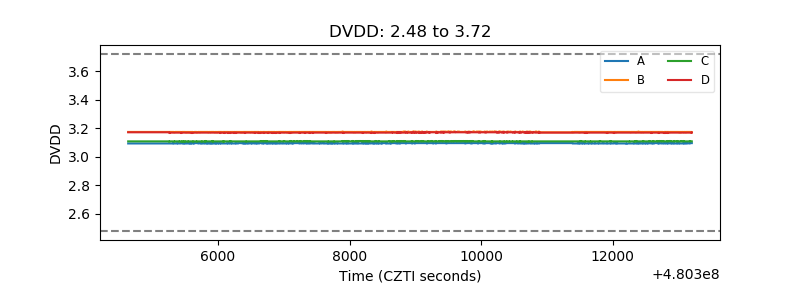 |
| Temperature 1 | 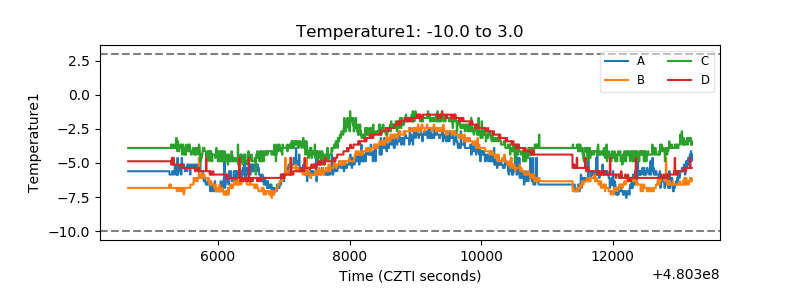 |
| Veto HV Monitor | 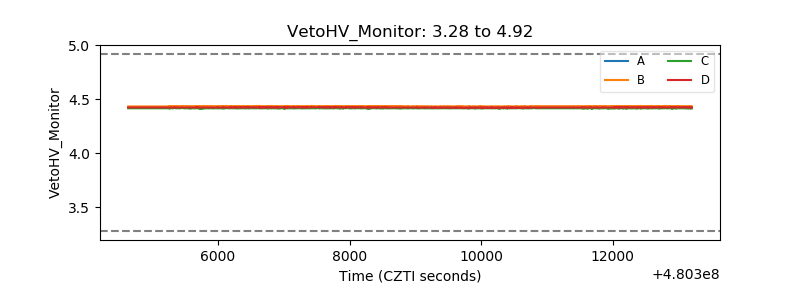 |
| Veto LLD | 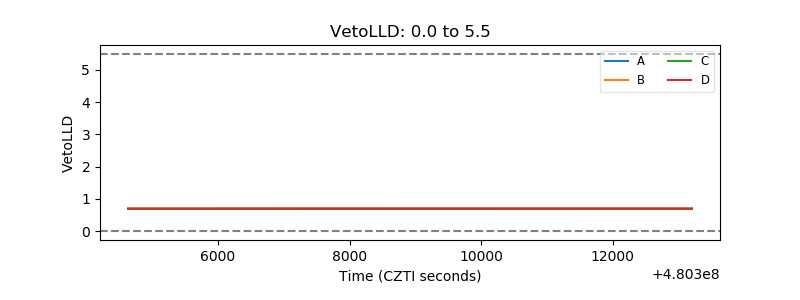 |
| Alpha Counter | 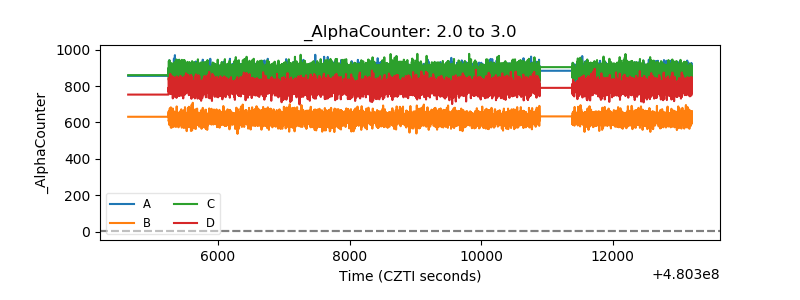 |
| _CPM_Rate | 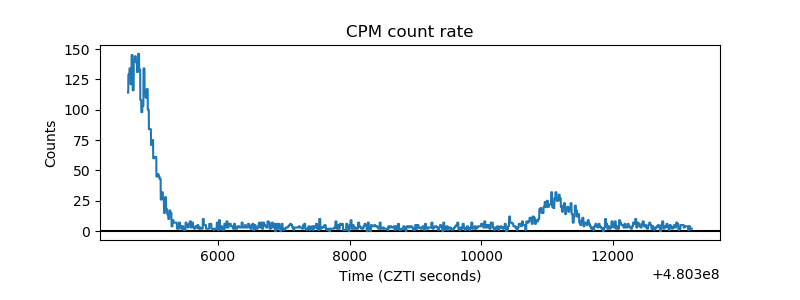 |
| CZT Counter | 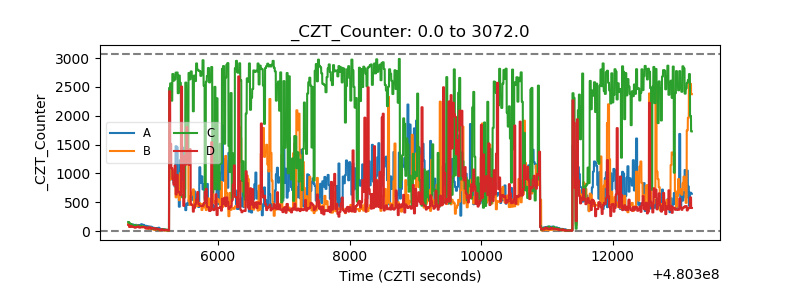 |
| +2.5 Volts monitor | 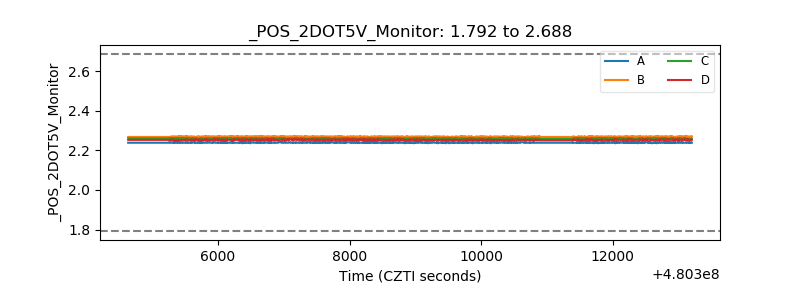 |
| +5 Volts monitor | 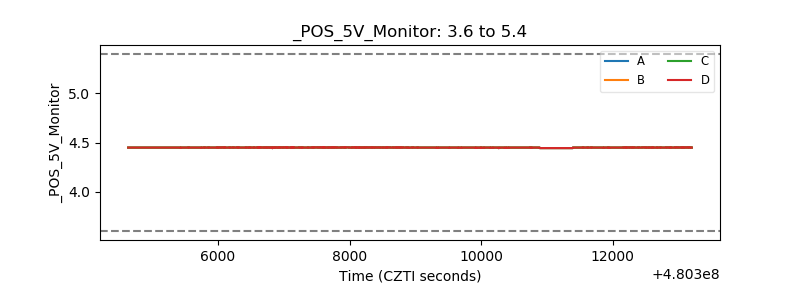 |
| _ROLL_ROT | 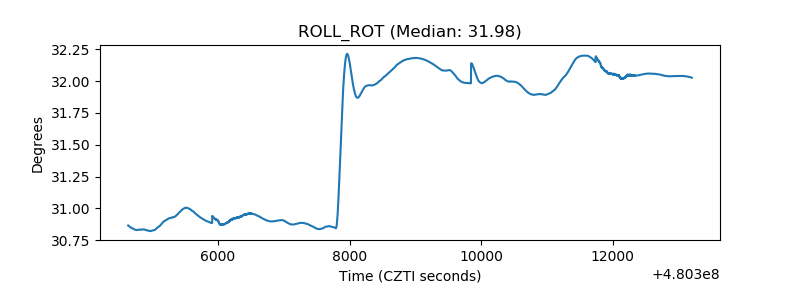 |
| _Roll_DEC | 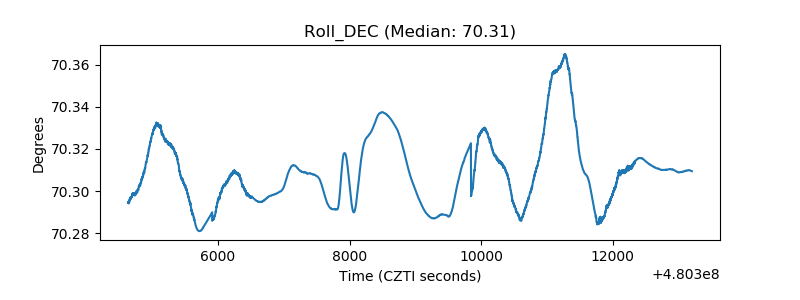 |
| _Roll_RA | 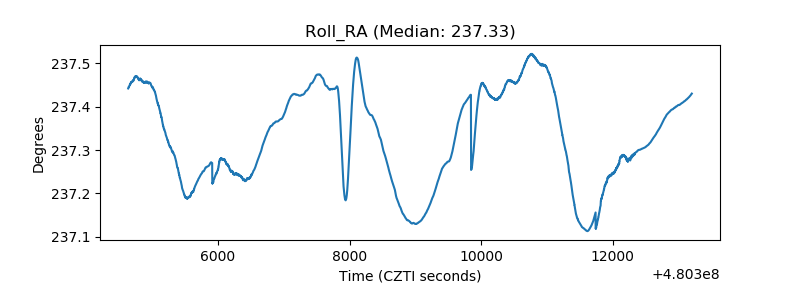 |
| Veto Counter | 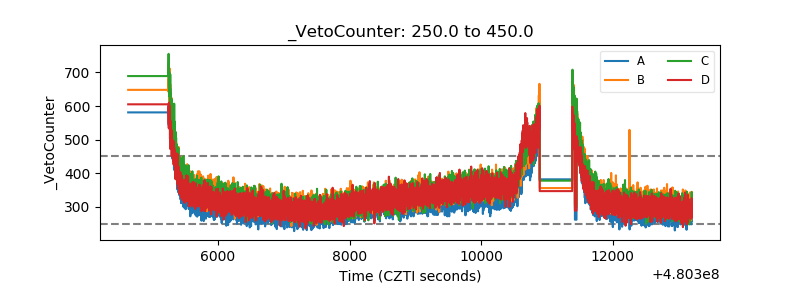 |