| Param | Original file | Final file |
|---|---|---|
| Filename | modeM0/AS1C07_001T01_9000006454_51281cztM0_level2.fits | modeM0/AS1C07_001T01_9000006454_51281cztM0_level2_quad_clean.evt |
| Size (bytes) | 830,131,200 | 86,564,160 |
| Size | 791.7 MB | 82.6 MB |
| Events in quadrant A | 6,582,799 | 618,037 |
| Events in quadrant B | 4,275,144 | 692,815 |
| Events in quadrant C | 14,742,488 | 236,214 |
| Events in quadrant D | 4,587,804 | 587,450 |
| Mode M0 | |||
|---|---|---|---|
| Quadrant | BADHDUFLAG | Total packets | Discarded packets |
| A | 0 | 24499 | 0 |
| B | 0 | 17510 | 0 |
| C | 0 | 48568 | 2 |
| D | 0 | 18769 | 0 |
| Mode SS | |||
|---|---|---|---|
| Quadrant | BADHDUFLAG | Total packets | Discarded packets |
| A | 0 | 138 | 0 |
| B | 0 | 138 | 0 |
| C | 0 | 138 | 0 |
| D | 0 | 138 | 0 |
| Quadrant | Total seconds | Saturated seconds | Saturation percentage |
|---|---|---|---|
| A | 6986 | 471 | 6.742056% |
| B | 6986 | 229 | 3.277985% |
| C | 6986 | 4566 | 65.359290% |
| D | 6986 | 241 | 3.449757% |
Noise dominated data is calculated using 1-second bins in cleaned event files. If a bin has >2000 counts, and if more than 50% of those come from <1% of pixels, then it is considered to be noise-dominated and hence unusable.
| Quadrant | # 1 sec bins | Bins with >0 counts | Bins with >2000 counts | High rate bins dominated by noise | Noise dominated (total time) | Noise dominated (detector-on time) | Marked lightcurve |
|---|---|---|---|---|---|---|---|
| A | 6986 | 6986 | 394 | 394 | 5.64% | 5.64% |  |
| B | 6986 | 6986 | 193 | 193 | 2.76% | 2.76% |  |
| C | 6985 | 6985 | 4635 | 4635 | 66.36% | 66.36% | 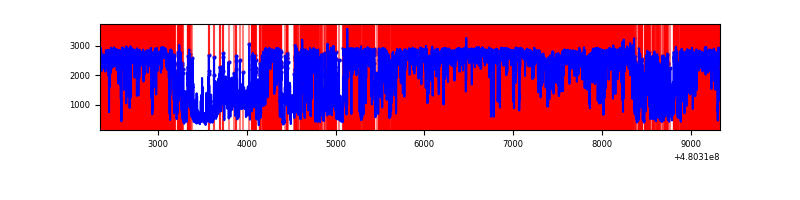 |
| D | 6986 | 6986 | 253 | 253 | 3.62% | 3.62% |  |
Top three noisy pixels from each quadrant. If the there are fewer than three noisy pixels in the level2.evt file, extra rows are filled as -1
| Pixel properties | Quadrant properties | ||||||
|---|---|---|---|---|---|---|---|
| Quadrant | DetID | PixID | Counts | Sigma | Mean | Median | Sigma |
| A | 12 | 3 | 1640301 | 9395.26 | 701 | 684 | 174.5 |
| A | 12 | 250 | 898018 | 5141.86 | 701 | 684 | 174.5 |
| A | 3 | 114 | 367661 | 2102.84 | 701 | 684 | 174.5 |
| B | 5 | 185 | 652378 | 4340.6 | 708 | 684 | 150.1 |
| B | 4 | 170 | 207101 | 1374.84 | 708 | 684 | 150.1 |
| B | 10 | 247 | 143288 | 949.81 | 708 | 684 | 150.1 |
| C | 4 | 12 | 10078210 | 94902.91 | 377 | 373 | 106.2 |
| C | 10 | 171 | 1772438 | 16687.52 | 377 | 373 | 106.2 |
| C | 13 | 49 | 876010 | 8245.87 | 377 | 373 | 106.2 |
| D | 3 | 12 | 314881 | 1631.43 | 685 | 658 | 192.6 |
| D | 2 | 216 | 253237 | 1311.38 | 685 | 658 | 192.6 |
| D | 10 | 181 | 248264 | 1285.56 | 685 | 658 | 192.6 |
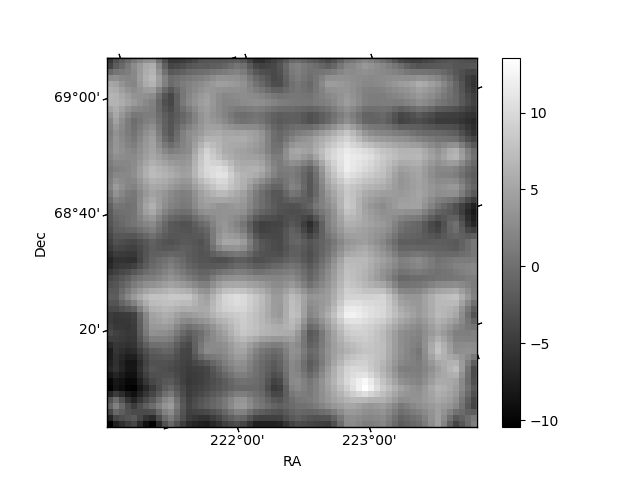
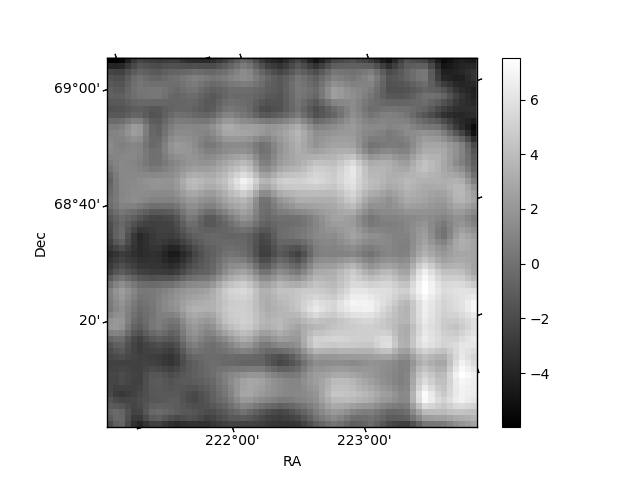
Histogram calculated using DETX and DETY for each event in the final _common_clean file
| Quadrant A | 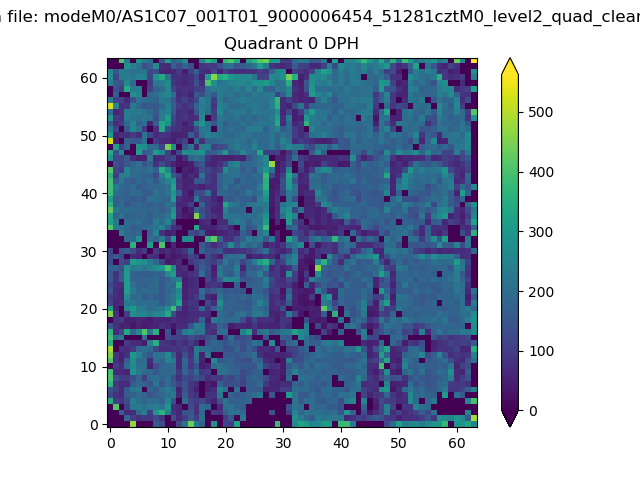 |
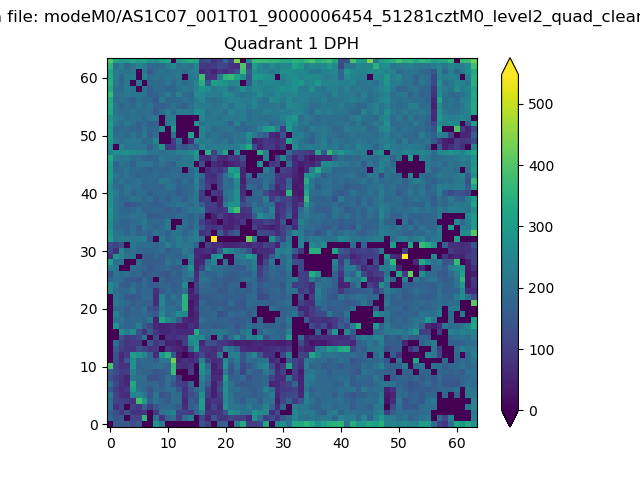 |
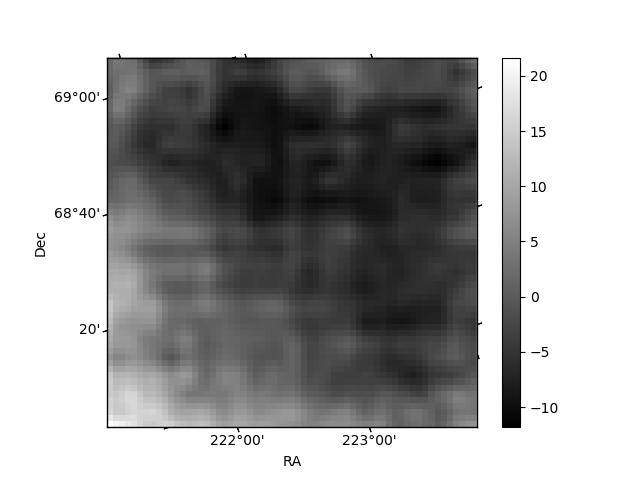
Quadrant B |
|---|---|---|---|
| Quadrant D | 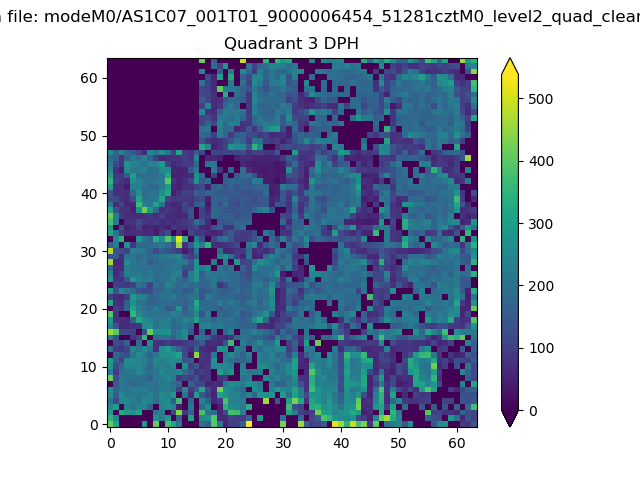 |
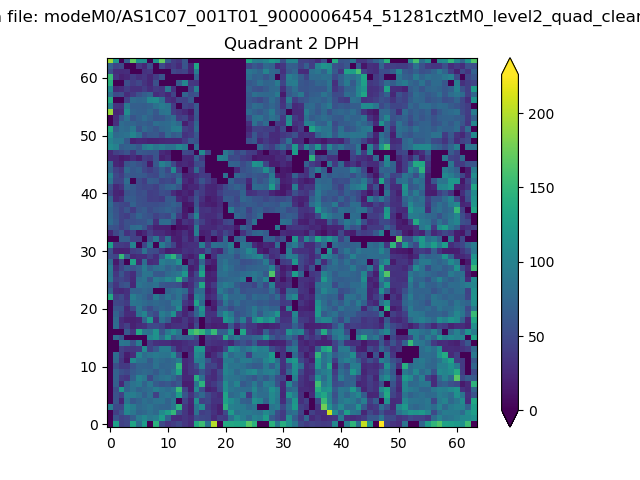 |
Quadrant C |
| Plot type | Count rate plots | Images |
|---|---|---|
| Comparison with Poisson distribution Blue bars denote a histogram of data divided into 1 sec bins. Red curve is a Poisson curve with rate = median count rate of data. |
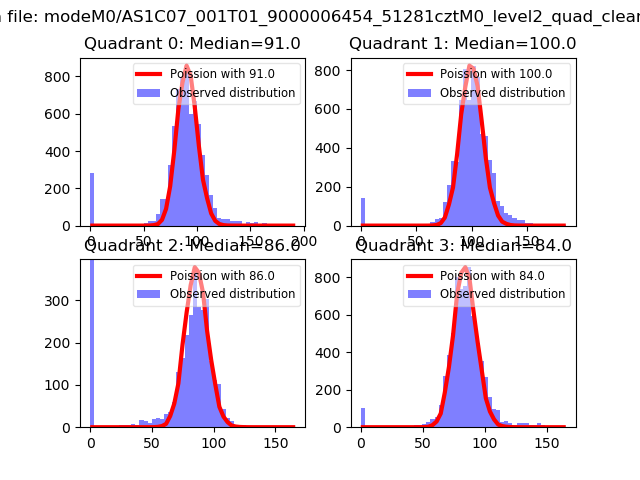 |
 |
| Quadrant-wise count rates Data is divided into 100 sec bins |
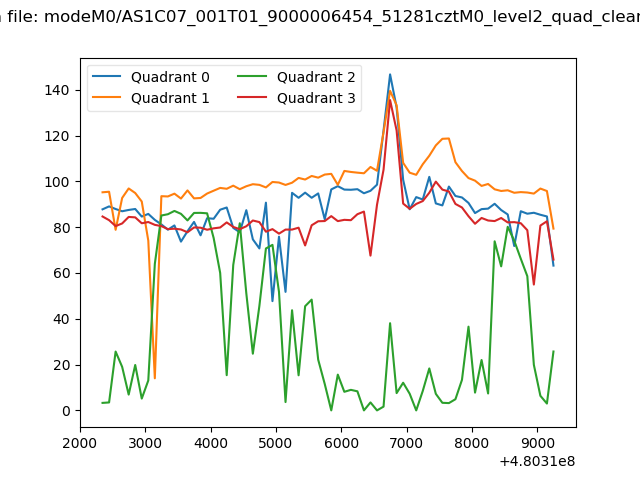 |
|
| Module-wise count rates for Quadrant A Data is divided into 100 sec bins |
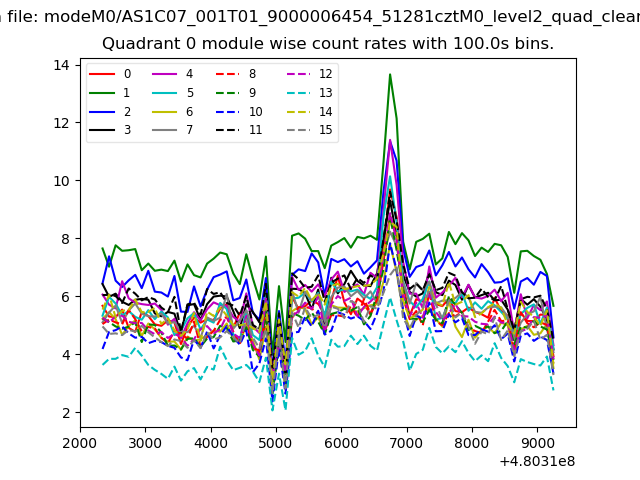 |
 |
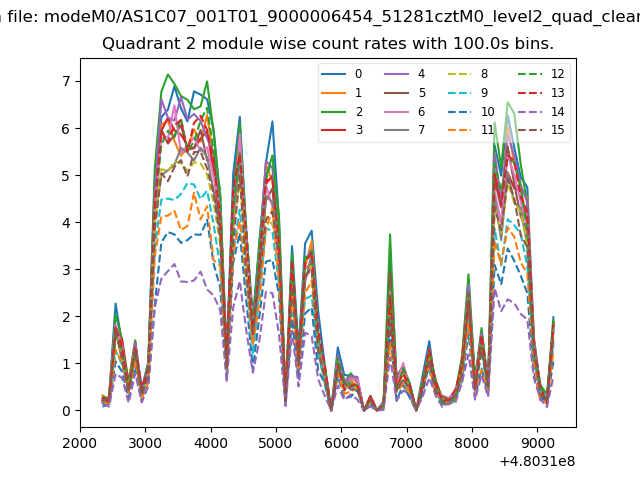
| Module-wise count rates for Quadrant B Data is divided into 100 sec bins |
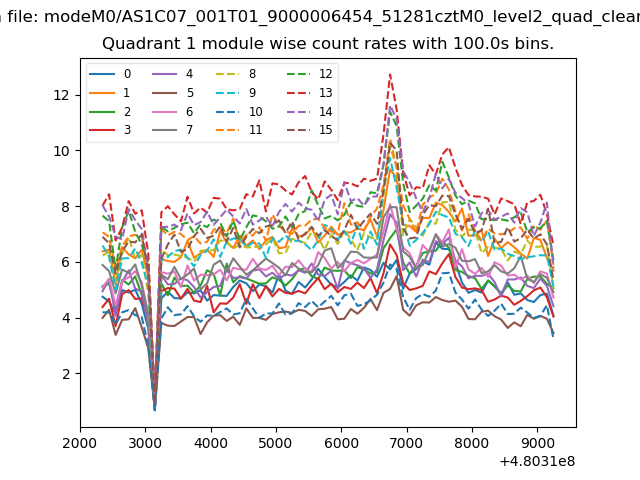 |
 |
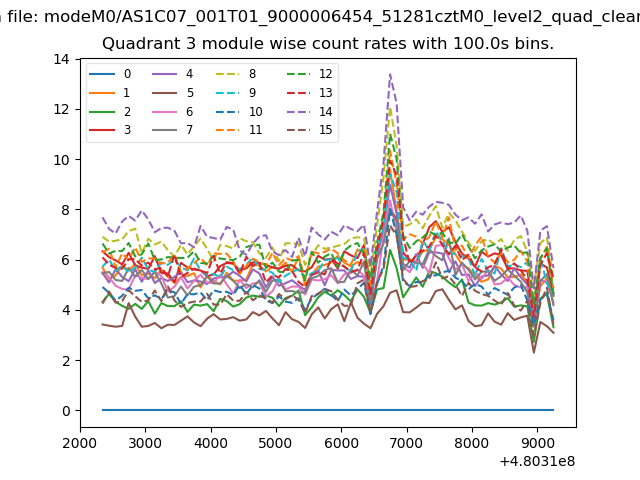
| Module-wise count rates for Quadrant C Data is divided into 100 sec bins |
 |
 |
| Module-wise count rates for Quadrant D Data is divided into 100 sec bins |
 |
 |
| Parameter | Plot |
|---|---|
| CZT HV Monitor | 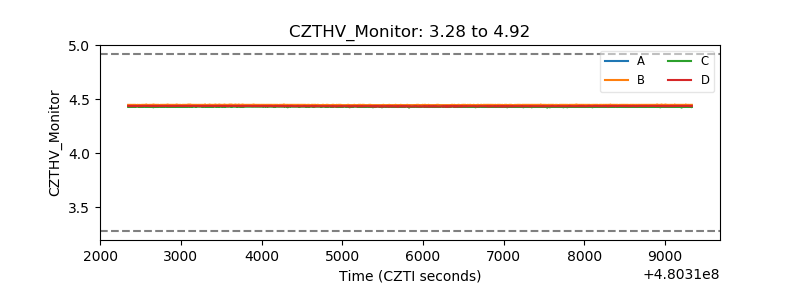 |
| D_VDD | 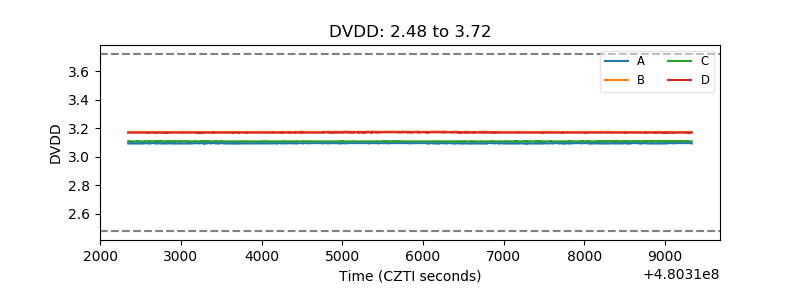 |
| Temperature 1 | 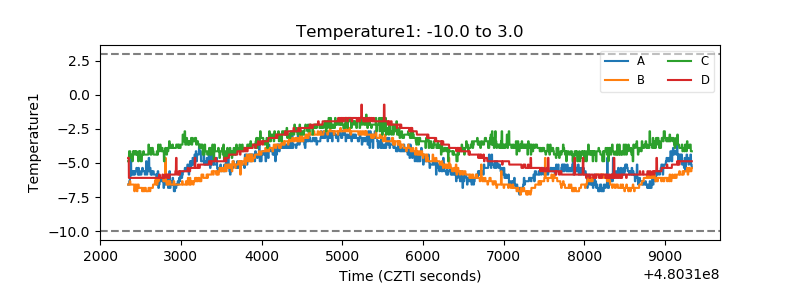 |
| Veto HV Monitor | 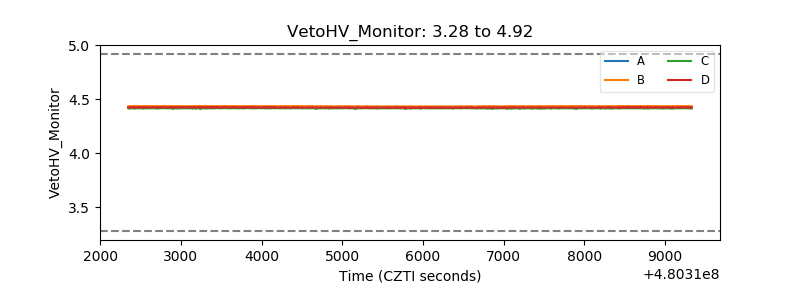 |
| Veto LLD | 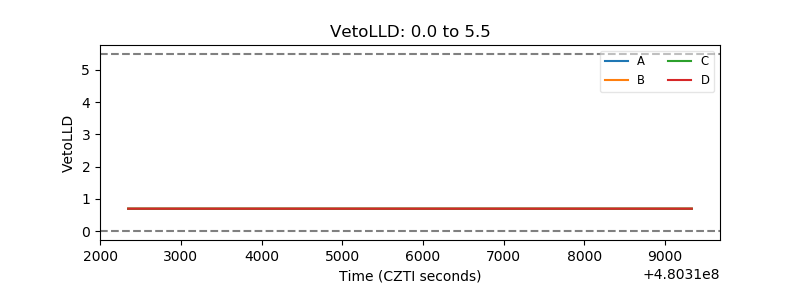 |
| Alpha Counter | 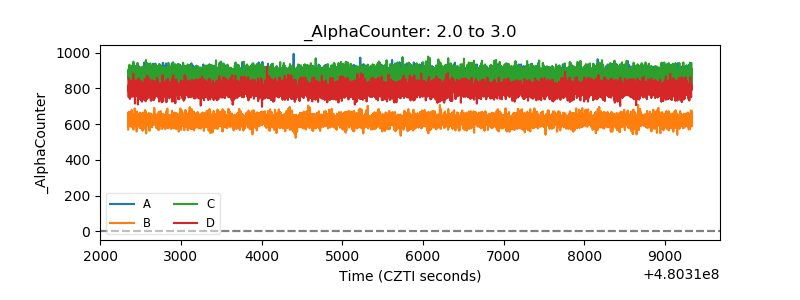 |
| _CPM_Rate | 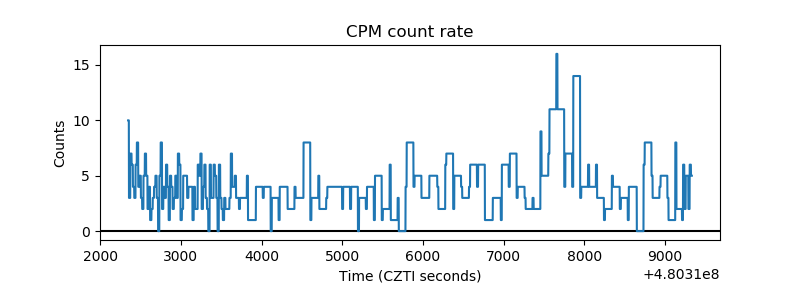 |
| CZT Counter | 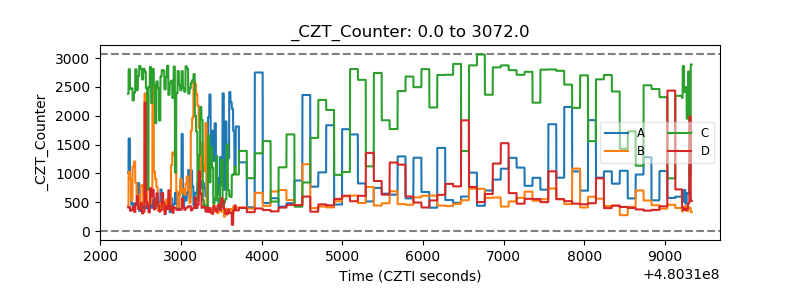 |
| +2.5 Volts monitor | 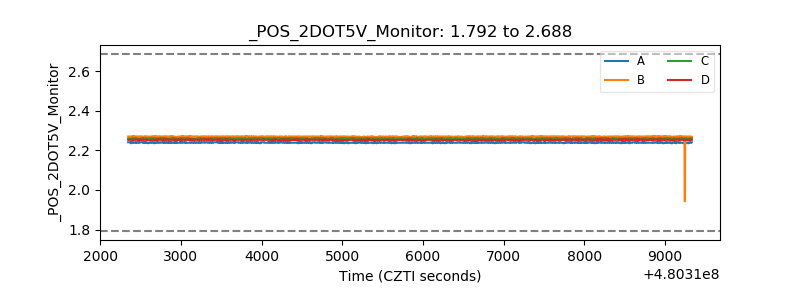 |
| +5 Volts monitor | 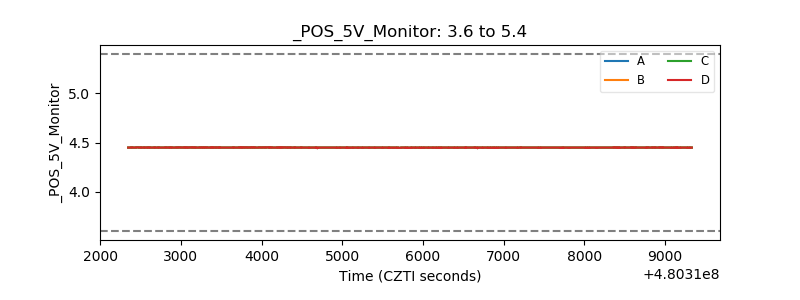 |
| _ROLL_ROT | 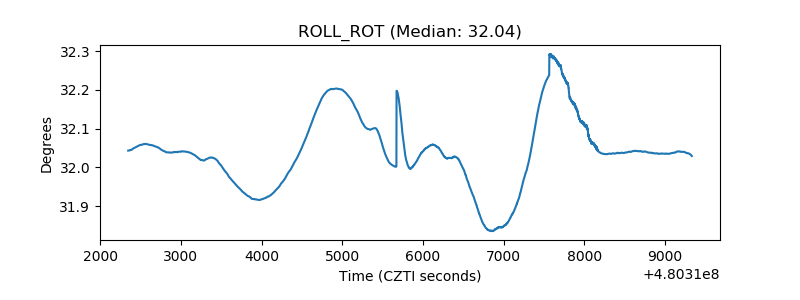 |
| _Roll_DEC | 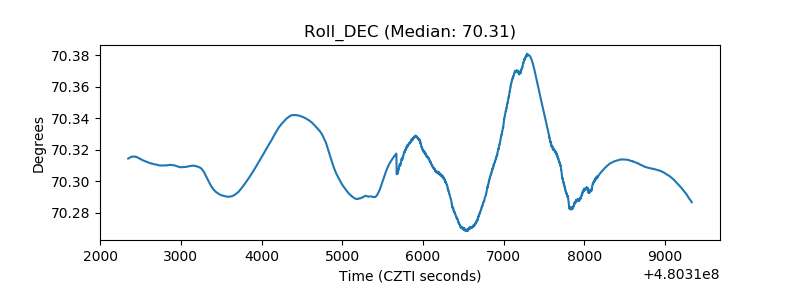 |
| _Roll_RA | 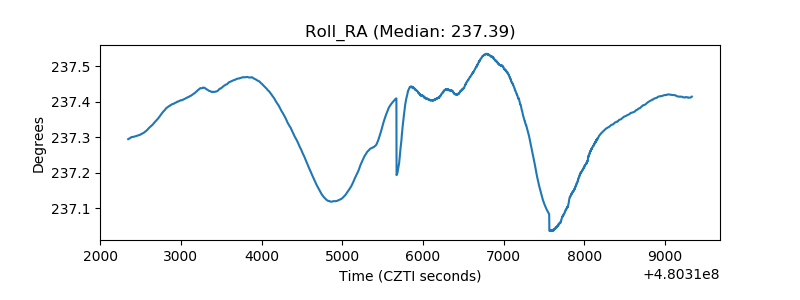 |
| Veto Counter | 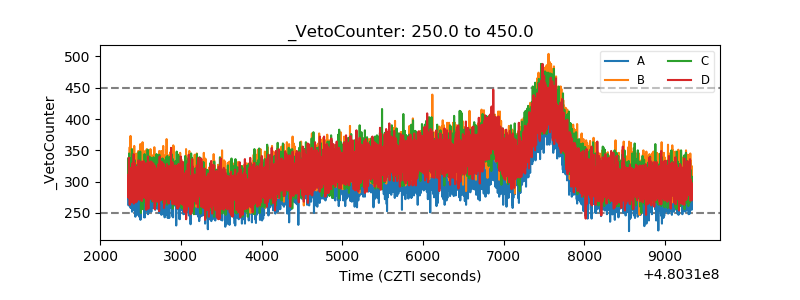 |