| Param | Original file | Final file |
|---|---|---|
| Filename | modeM0/AS1C07_001T01_9000006454_51282cztM0_level2.fits | modeM0/AS1C07_001T01_9000006454_51282cztM0_level2_quad_clean.evt |
| Size (bytes) | 860,561,280 | 100,517,760 |
| Size | 820.7 MB | 95.9 MB |
| Events in quadrant A | 7,969,796 | 657,286 |
| Events in quadrant B | 4,124,557 | 771,228 |
| Events in quadrant C | 12,106,361 | 464,699 |
| Events in quadrant D | 7,056,083 | 611,011 |
| Mode M0 | |||
|---|---|---|---|
| Quadrant | BADHDUFLAG | Total packets | Discarded packets |
| A | 0 | 29208 | 0 |
| B | 0 | 17871 | 0 |
| C | 0 | 41339 | 0 |
| D | 0 | 26588 | 0 |
| Mode SS | |||
|---|---|---|---|
| Quadrant | BADHDUFLAG | Total packets | Discarded packets |
| A | 0 | 156 | 0 |
| B | 0 | 156 | 0 |
| C | 0 | 156 | 0 |
| D | 0 | 156 | 0 |
| Quadrant | Total seconds | Saturated seconds | Saturation percentage |
|---|---|---|---|
| A | 7747 | 756 | 9.758616% |
| B | 7747 | 104 | 1.342455% |
| C | 7747 | 2799 | 36.130115% |
| D | 7747 | 750 | 9.681167% |
Noise dominated data is calculated using 1-second bins in cleaned event files. If a bin has >2000 counts, and if more than 50% of those come from <1% of pixels, then it is considered to be noise-dominated and hence unusable.
| Quadrant | # 1 sec bins | Bins with >0 counts | Bins with >2000 counts | High rate bins dominated by noise | Noise dominated (total time) | Noise dominated (detector-on time) | Marked lightcurve |
|---|---|---|---|---|---|---|---|
| A | 7747 | 7747 | 676 | 676 | 8.73% | 8.73% | 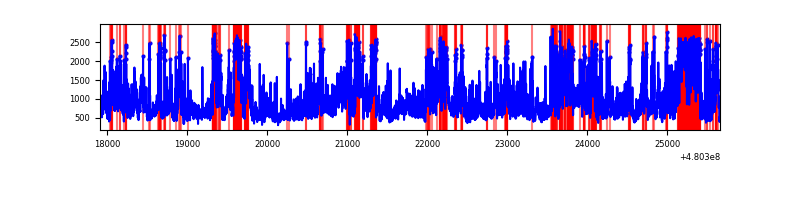 |
| B | 7747 | 7747 | 66 | 66 | 0.85% | 0.85% | 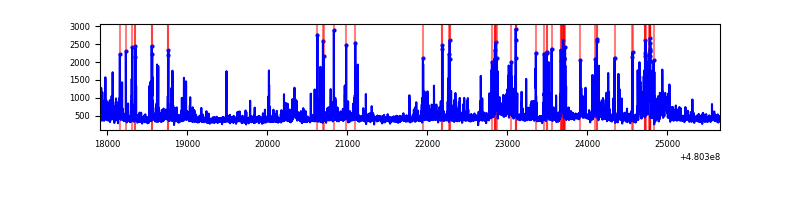 |
| C | 7747 | 7747 | 2860 | 2860 | 36.92% | 36.92% | 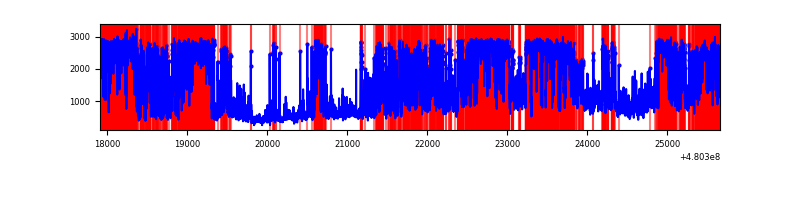 |
| D | 7747 | 7747 | 796 | 796 | 10.27% | 10.27% | 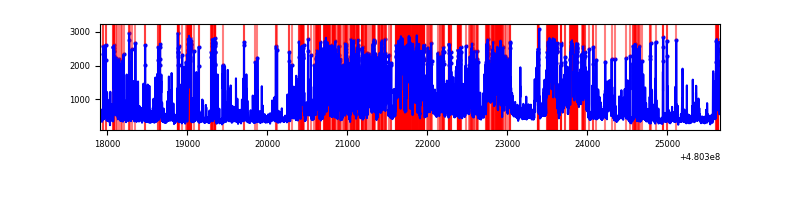 |
Top three noisy pixels from each quadrant. If the there are fewer than three noisy pixels in the level2.evt file, extra rows are filled as -1
| Pixel properties | Quadrant properties | ||||||
|---|---|---|---|---|---|---|---|
| Quadrant | DetID | PixID | Counts | Sigma | Mean | Median | Sigma |
| A | 12 | 3 | 2138373 | 11335.58 | 756 | 739 | 188.6 |
| A | 12 | 250 | 1673243 | 8869.06 | 756 | 739 | 188.6 |
| A | 8 | 78 | 316807 | 1676.07 | 756 | 739 | 188.6 |
| B | 5 | 185 | 518886 | 3088.41 | 780 | 754 | 167.8 |
| B | 7 | 252 | 108682 | 643.32 | 780 | 754 | 167.8 |
| B | 10 | 247 | 65050 | 383.25 | 780 | 754 | 167.8 |
| C | 4 | 12 | 6058806 | 35792.47 | 611 | 607 | 169.3 |
| C | 10 | 171 | 1842440 | 10881.74 | 611 | 607 | 169.3 |
| C | 13 | 49 | 755880 | 4462.23 | 611 | 607 | 169.3 |
| D | 8 | 176 | 1398262 | 6870.34 | 722 | 697 | 203.4 |
| D | 6 | 42 | 910069 | 4470.42 | 722 | 697 | 203.4 |
| D | 2 | 216 | 447421 | 2196.07 | 722 | 697 | 203.4 |
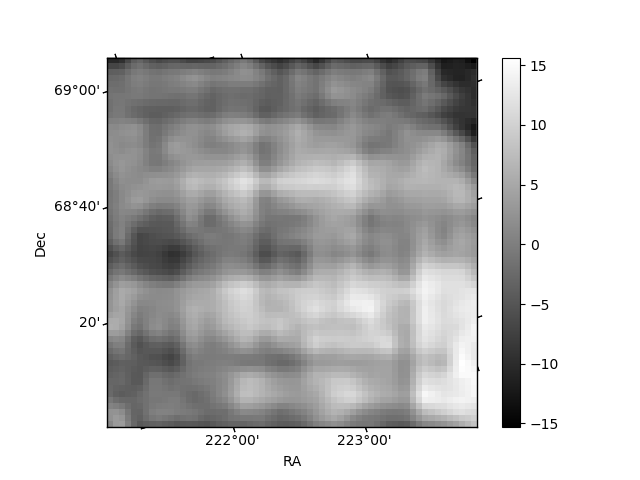
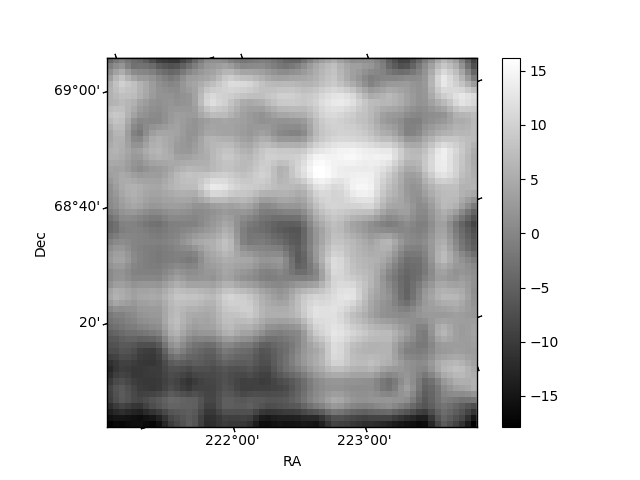
Histogram calculated using DETX and DETY for each event in the final _common_clean file
| Quadrant A | 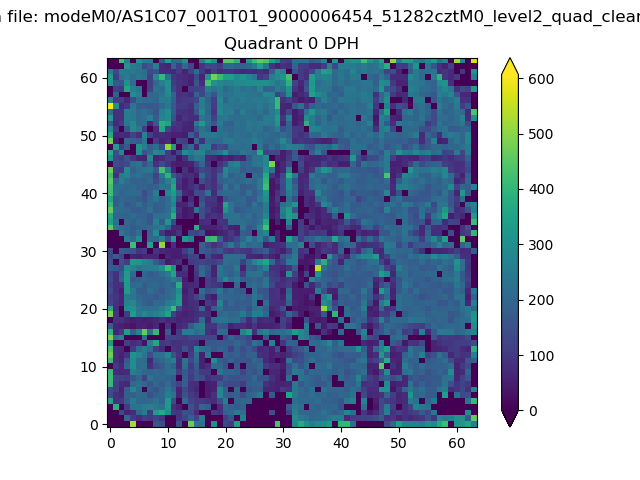 |
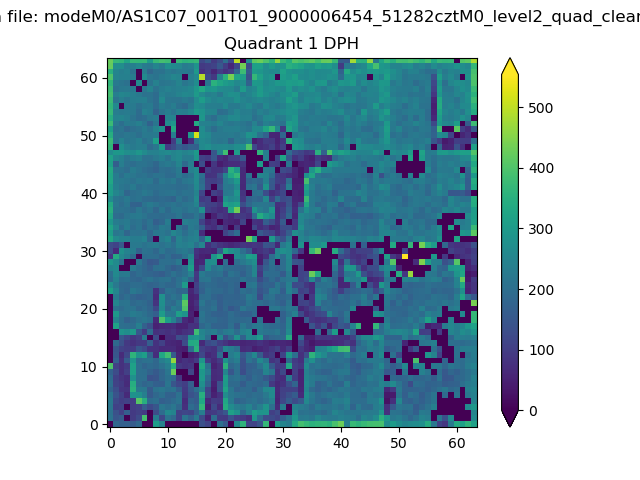 |
Quadrant B |
|---|---|---|---|
| Quadrant D | 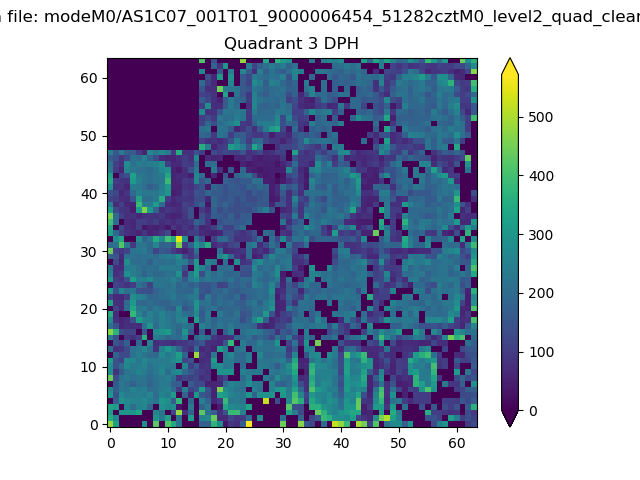 |
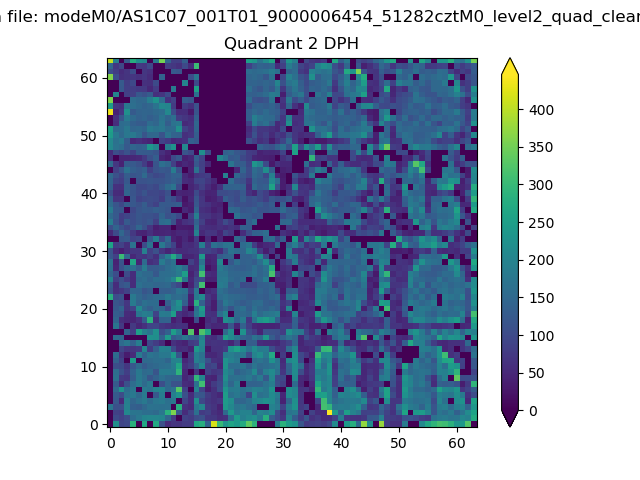 |
Quadrant C |
| Plot type | Count rate plots | Images |
|---|---|---|
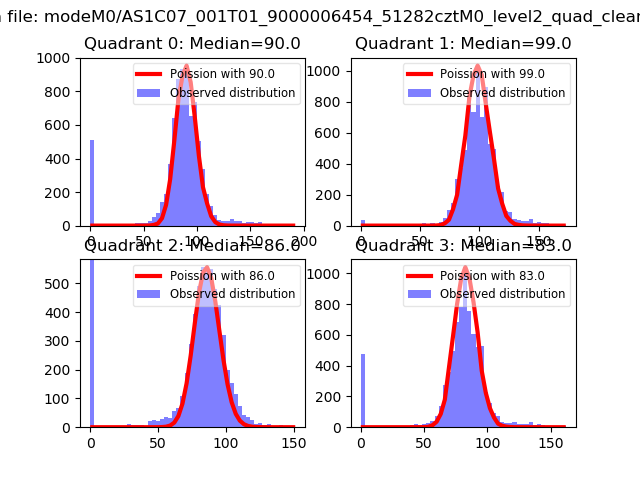
| Comparison with Poisson distribution Blue bars denote a histogram of data divided into 1 sec bins. Red curve is a Poisson curve with rate = median count rate of data. |
 |
 |
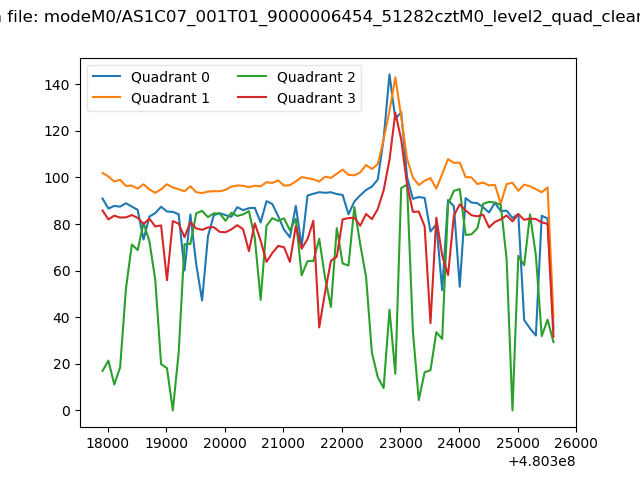
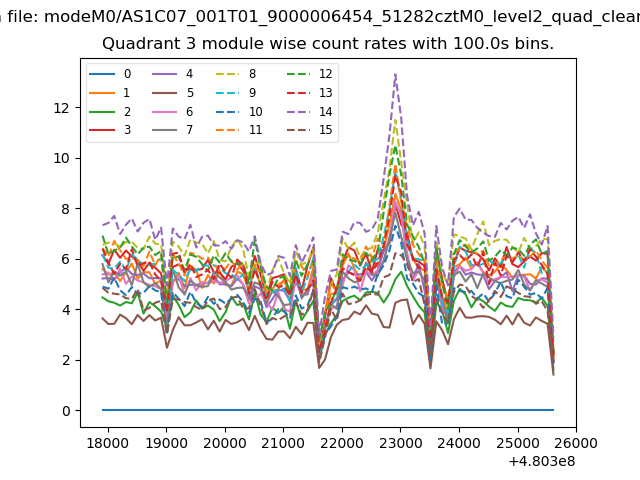
| Quadrant-wise count rates Data is divided into 100 sec bins |
 |
|
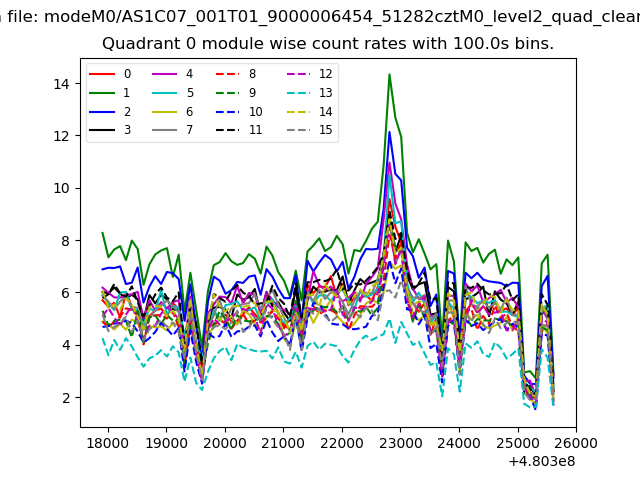
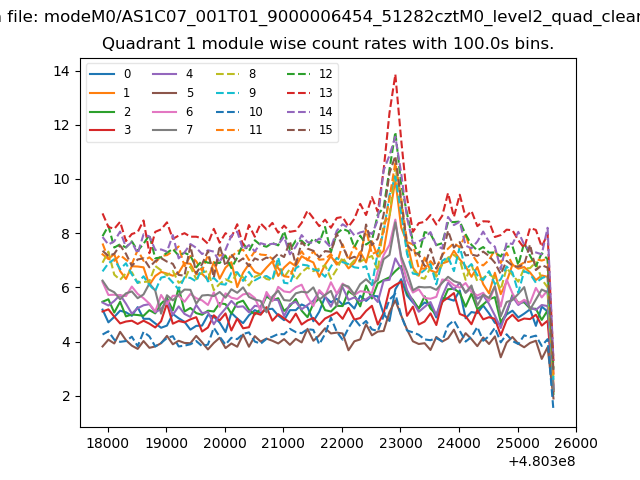
| Module-wise count rates for Quadrant A Data is divided into 100 sec bins |
 |
 |
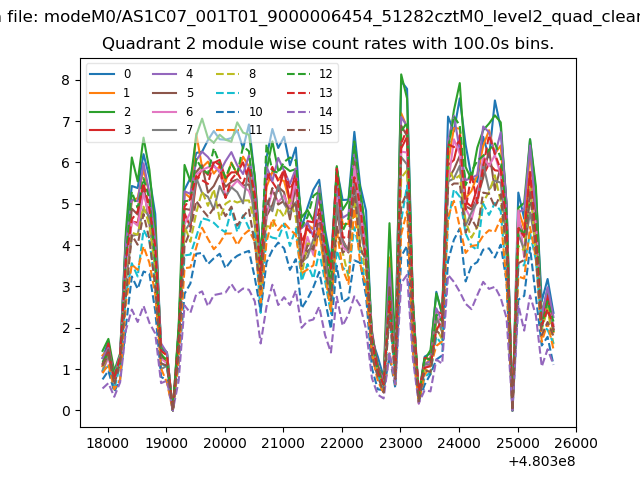
| Module-wise count rates for Quadrant B Data is divided into 100 sec bins |
 |
 |
| Module-wise count rates for Quadrant C Data is divided into 100 sec bins |
 |
 |
| Module-wise count rates for Quadrant D Data is divided into 100 sec bins |
 |
 |
| Parameter | Plot |
|---|---|
| CZT HV Monitor | 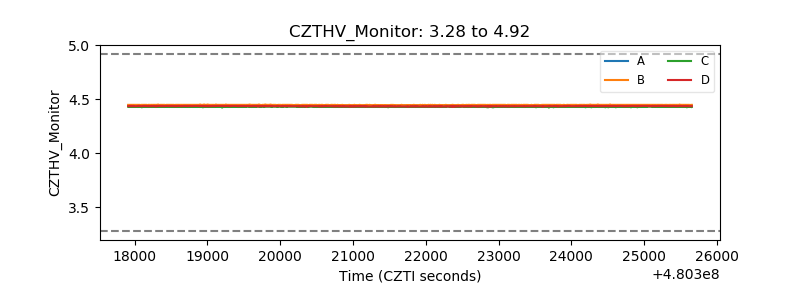 |
| D_VDD | 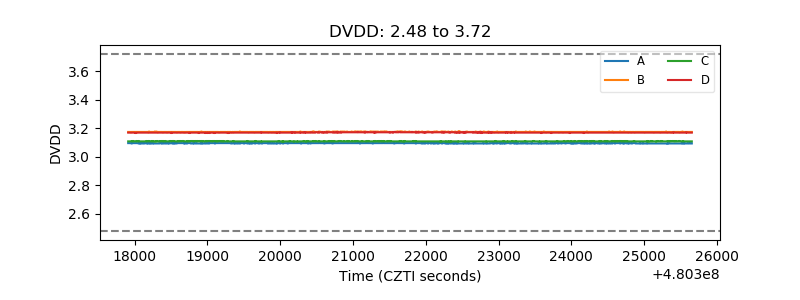 |
| Temperature 1 | 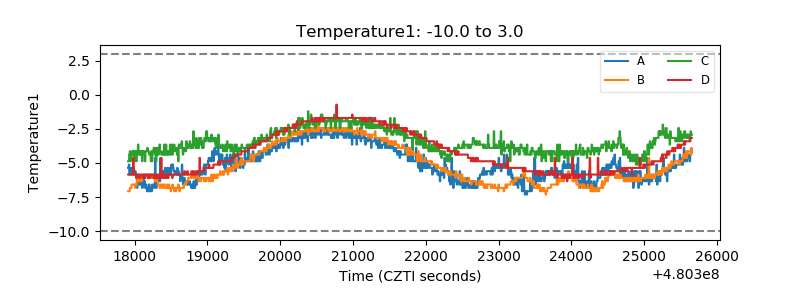 |
| Veto HV Monitor | 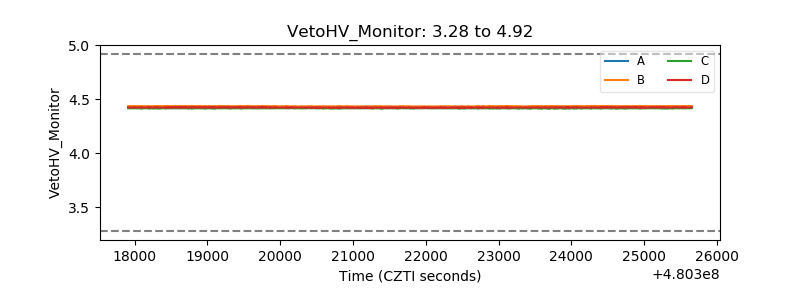 |
| Veto LLD | 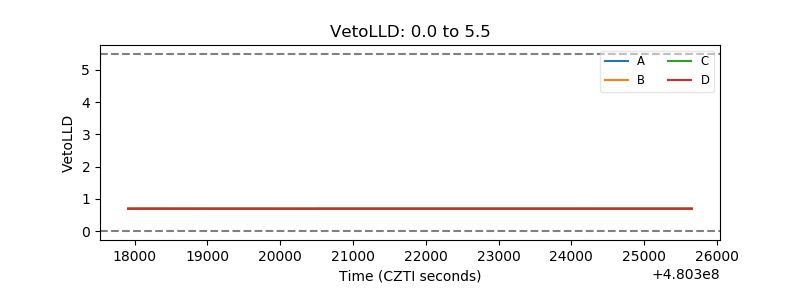 |
| Alpha Counter | 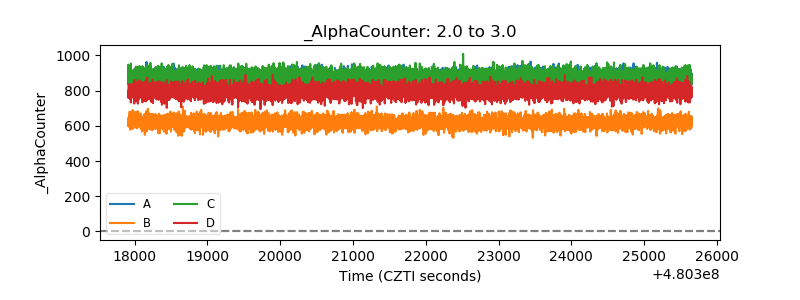 |
| _CPM_Rate | 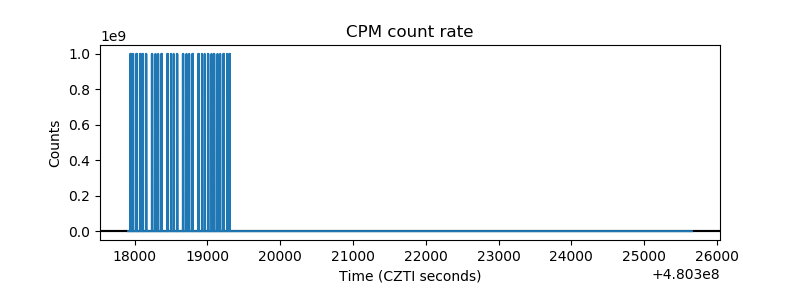 |
| CZT Counter | 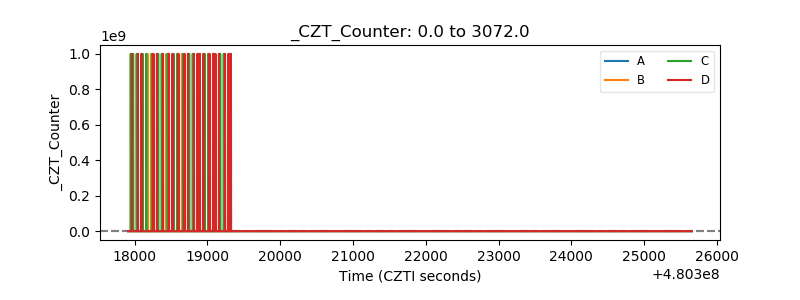 |
| +2.5 Volts monitor | 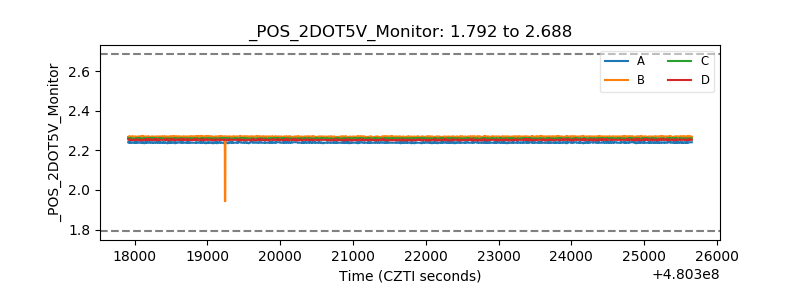 |
| +5 Volts monitor | 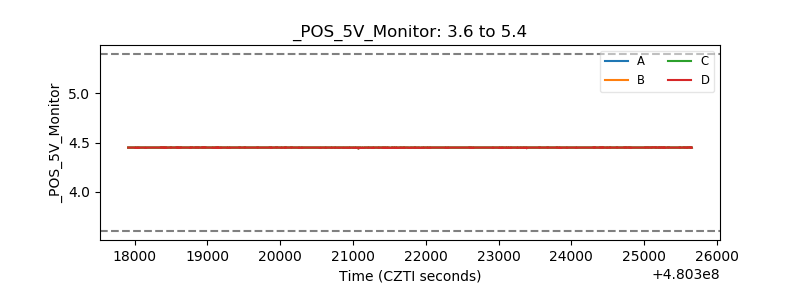 |
| _ROLL_ROT | 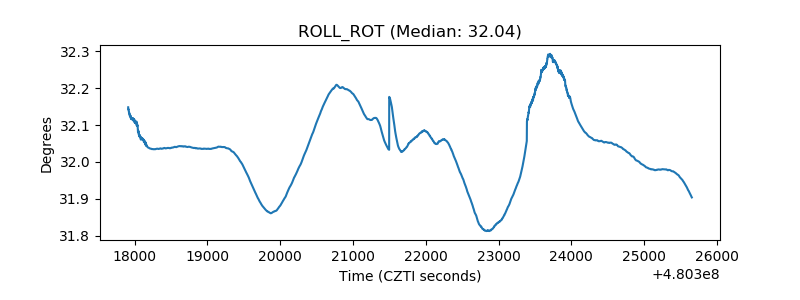 |
| _Roll_DEC | 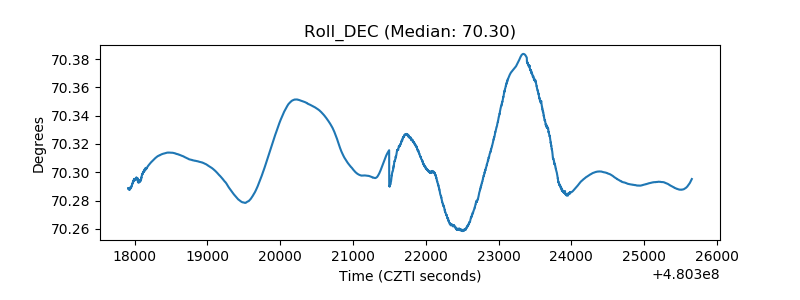 |
| _Roll_RA | 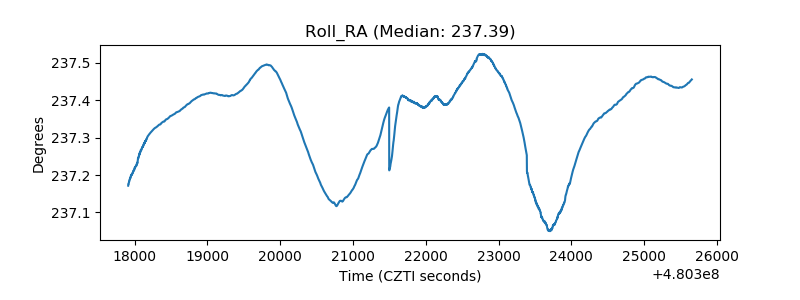 |
| Veto Counter | 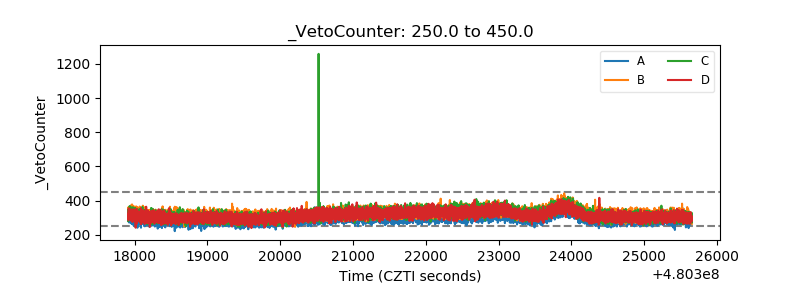 |