| Param | Original file | Final file |
|---|---|---|
| Filename | modeM0/AS1C07_001T01_9000006454_51283cztM0_level2.fits | modeM0/AS1C07_001T01_9000006454_51283cztM0_level2_quad_clean.evt |
| Size (bytes) | 904,158,720 | 94,412,160 |
| Size | 862.3 MB | 90.0 MB |
| Events in quadrant A | 7,572,949 | 637,455 |
| Events in quadrant B | 5,155,441 | 710,236 |
| Events in quadrant C | 12,554,629 | 442,946 |
| Events in quadrant D | 7,607,454 | 545,730 |
| Mode M0 | |||
|---|---|---|---|
| Quadrant | BADHDUFLAG | Total packets | Discarded packets |
| A | 0 | 27827 | 0 |
| B | 0 | 20496 | 0 |
| C | 0 | 42532 | 0 |
| D | 0 | 27893 | 0 |
| Mode SS | |||
|---|---|---|---|
| Quadrant | BADHDUFLAG | Total packets | Discarded packets |
| A | 0 | 150 | 0 |
| B | 0 | 150 | 0 |
| C | 0 | 150 | 0 |
| D | 0 | 150 | 0 |
| Quadrant | Total seconds | Saturated seconds | Saturation percentage |
|---|---|---|---|
| A | 7497 | 671 | 8.950247% |
| B | 7498 | 422 | 5.628168% |
| C | 7498 | 2869 | 38.263537% |
| D | 7497 | 1108 | 14.779245% |
Noise dominated data is calculated using 1-second bins in cleaned event files. If a bin has >2000 counts, and if more than 50% of those come from <1% of pixels, then it is considered to be noise-dominated and hence unusable.
| Quadrant | # 1 sec bins | Bins with >0 counts | Bins with >2000 counts | High rate bins dominated by noise | Noise dominated (total time) | Noise dominated (detector-on time) | Marked lightcurve |
|---|---|---|---|---|---|---|---|
| A | 7496 | 7496 | 563 | 563 | 7.51% | 7.51% | 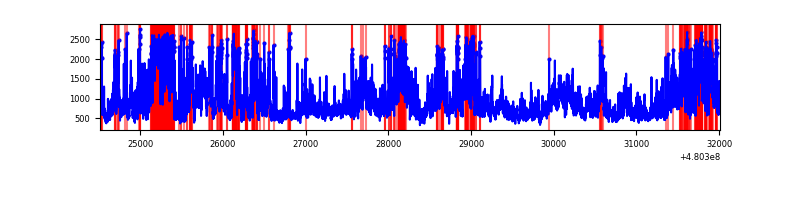 |
| B | 7497 | 7497 | 318 | 318 | 4.24% | 4.24% | 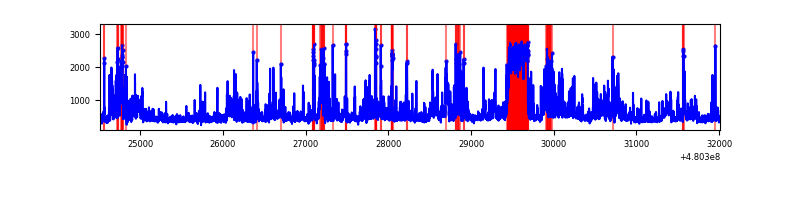 |
| C | 7497 | 7497 | 2964 | 2964 | 39.54% | 39.54% | 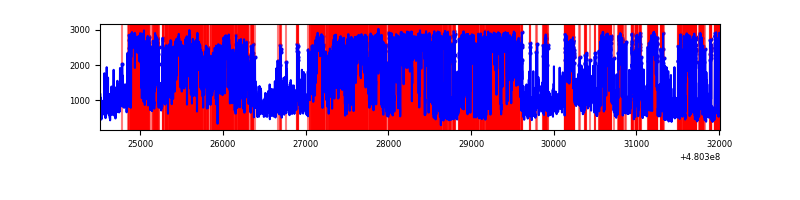 |
| D | 7496 | 7496 | 1163 | 1163 | 15.51% | 15.51% | 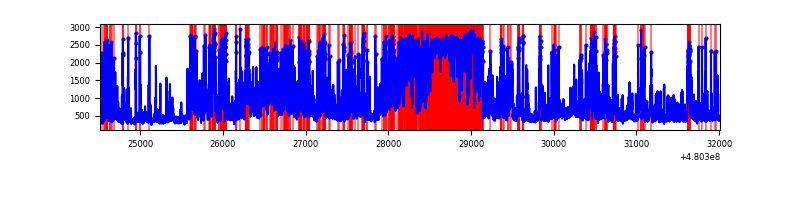 |
Top three noisy pixels from each quadrant. If the there are fewer than three noisy pixels in the level2.evt file, extra rows are filled as -1
| Pixel properties | Quadrant properties | ||||||
|---|---|---|---|---|---|---|---|
| Quadrant | DetID | PixID | Counts | Sigma | Mean | Median | Sigma |
| A | 12 | 3 | 2332262 | 12629.76 | 744 | 728 | 184.6 |
| A | 12 | 250 | 963324 | 5214.32 | 744 | 728 | 184.6 |
| A | 9 | 160 | 281795 | 1522.52 | 744 | 728 | 184.6 |
| B | 5 | 185 | 1043057 | 6541.94 | 743 | 718 | 159.3 |
| B | 4 | 170 | 530563 | 3325.42 | 743 | 718 | 159.3 |
| B | 8 | 128 | 177124 | 1107.16 | 743 | 718 | 159.3 |
| C | 4 | 12 | 5900241 | 35428.69 | 596 | 591 | 166.5 |
| C | 10 | 171 | 3045809 | 18287.2 | 596 | 591 | 166.5 |
| C | 3 | 233 | 264453 | 1584.55 | 596 | 591 | 166.5 |
| D | 8 | 176 | 1251647 | 6594.89 | 689 | 667 | 189.7 |
| D | 7 | 60 | 1206811 | 6358.52 | 689 | 667 | 189.7 |
| D | 3 | 12 | 776651 | 4090.81 | 689 | 667 | 189.7 |
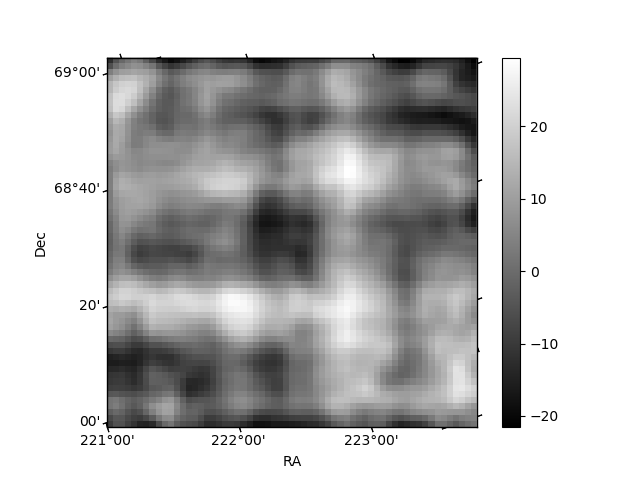
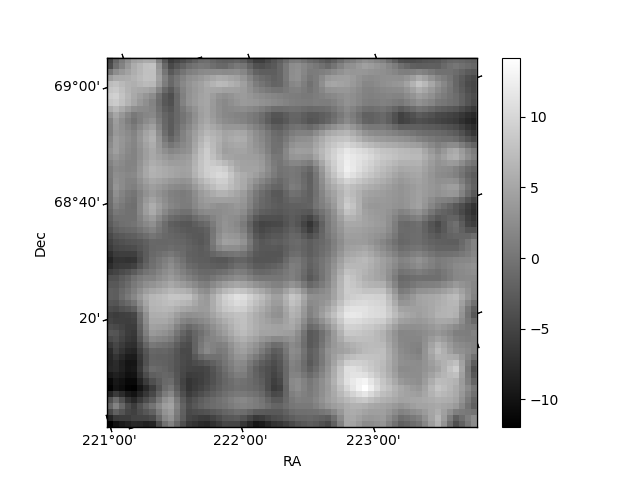
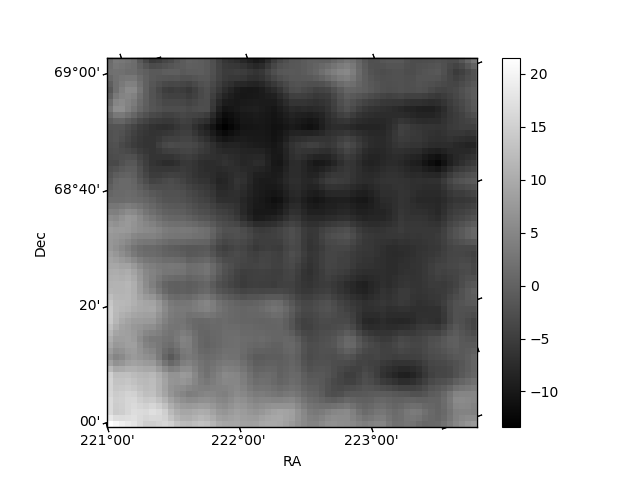
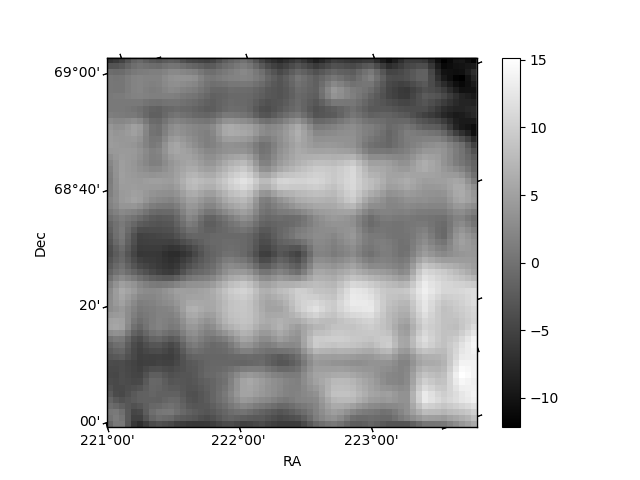
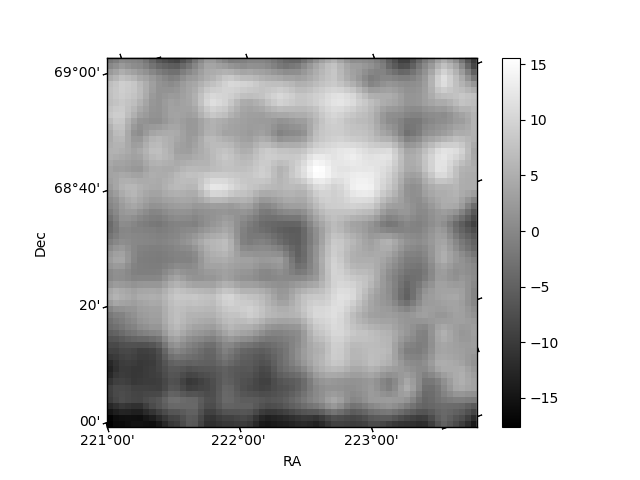
Histogram calculated using DETX and DETY for each event in the final _common_clean file
| Quadrant A | 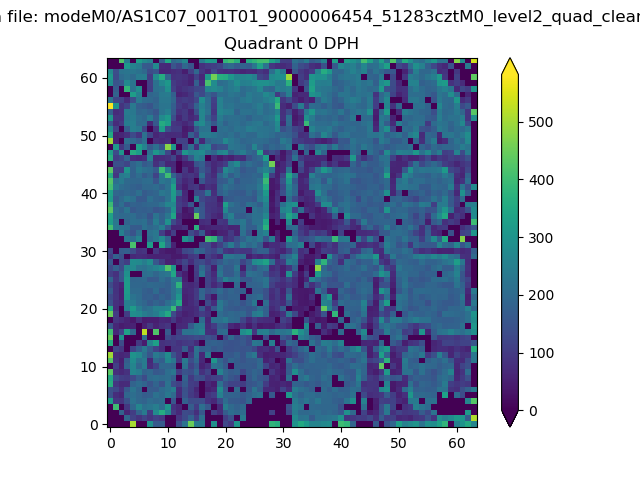 |
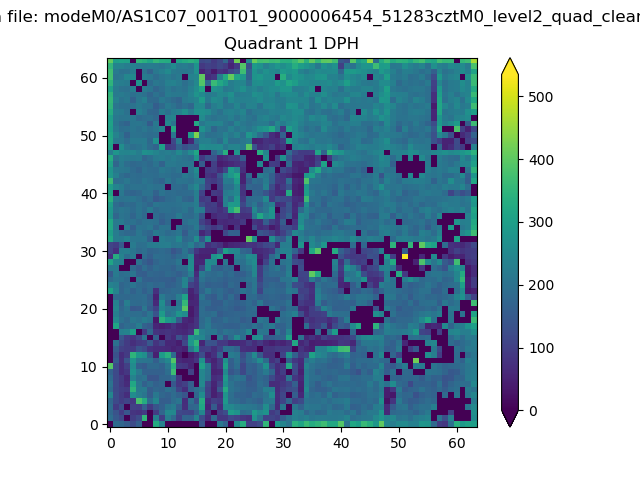 |
Quadrant B |
|---|---|---|---|
| Quadrant D | 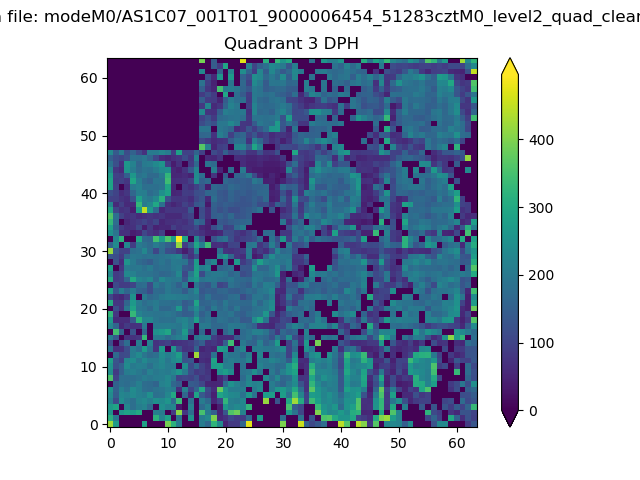 |
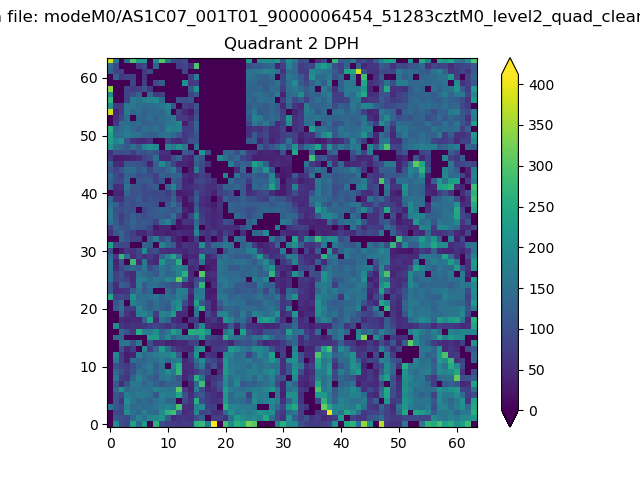 |
Quadrant C |
| Plot type | Count rate plots | Images |
|---|---|---|
| Comparison with Poisson distribution Blue bars denote a histogram of data divided into 1 sec bins. Red curve is a Poisson curve with rate = median count rate of data. |
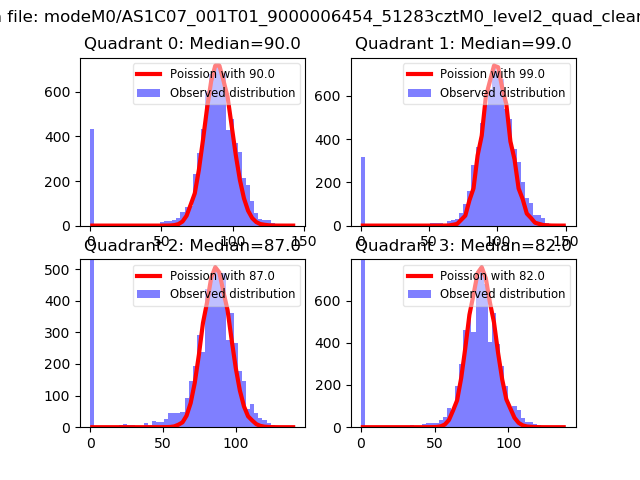 |
 |
| Quadrant-wise count rates Data is divided into 100 sec bins |
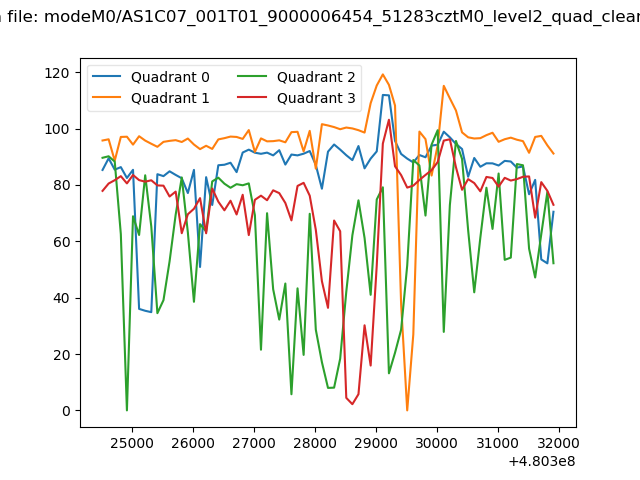 |
|
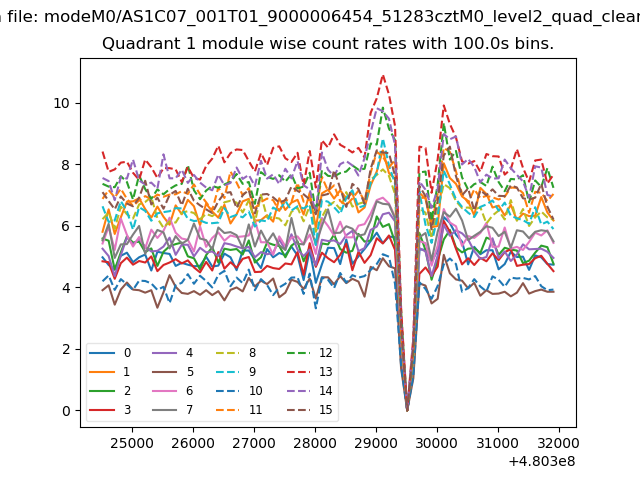
| Module-wise count rates for Quadrant A Data is divided into 100 sec bins |
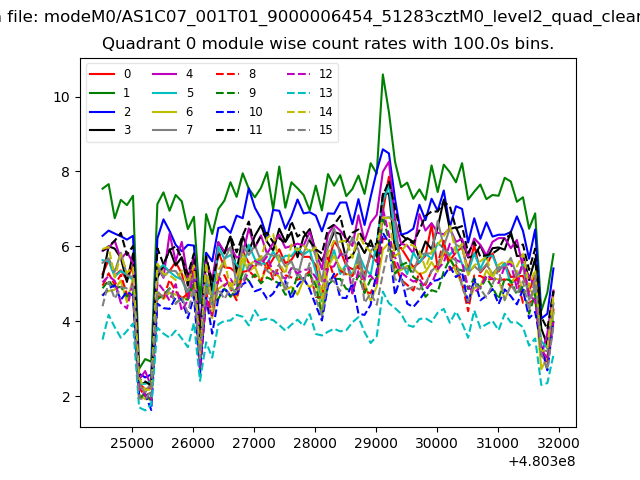 |
 |
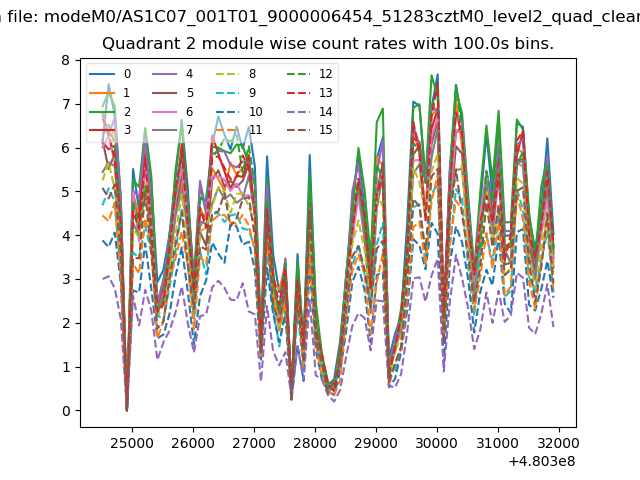
| Module-wise count rates for Quadrant B Data is divided into 100 sec bins |
 |
 |
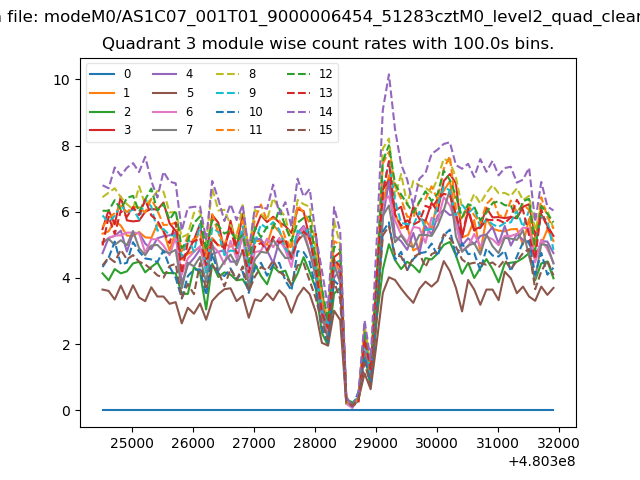
| Module-wise count rates for Quadrant C Data is divided into 100 sec bins |
 |
 |
| Module-wise count rates for Quadrant D Data is divided into 100 sec bins |
 |
 |
| Parameter | Plot |
|---|---|
| CZT HV Monitor |  |
| D_VDD | 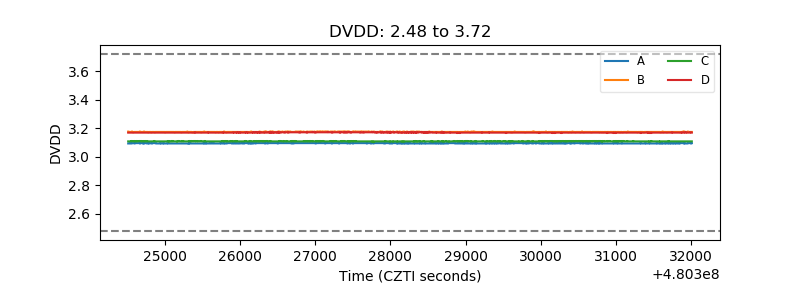 |
| Temperature 1 | 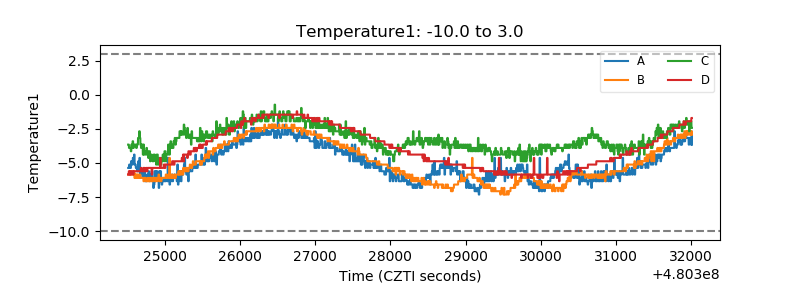 |
| Veto HV Monitor | 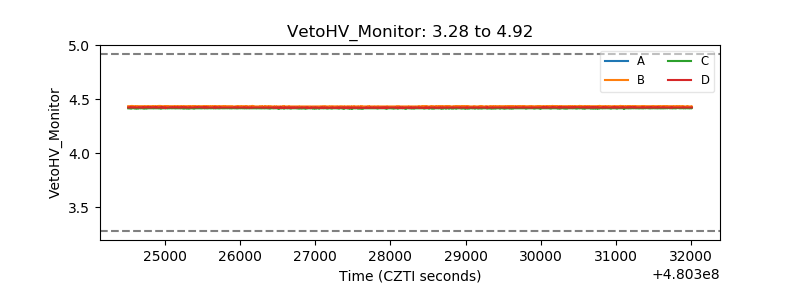 |
| Veto LLD |  |
| Alpha Counter | 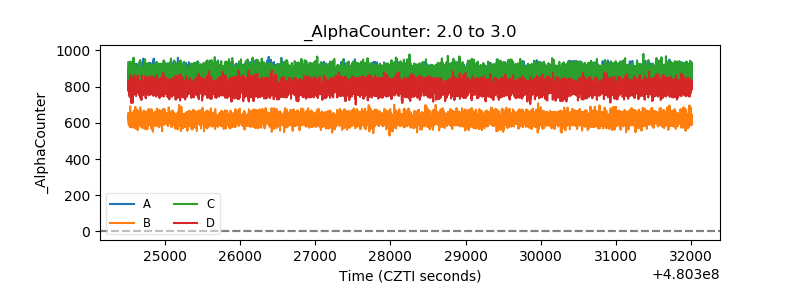 |
| _CPM_Rate | 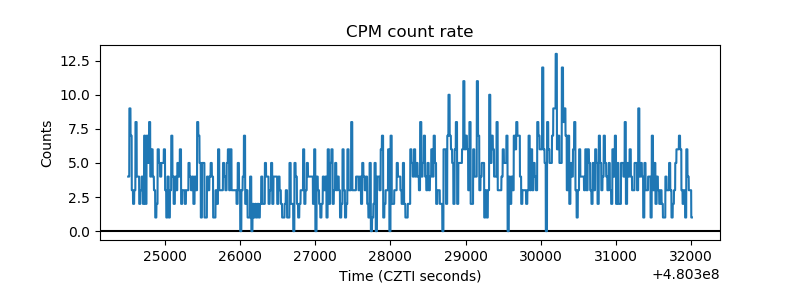 |
| CZT Counter | 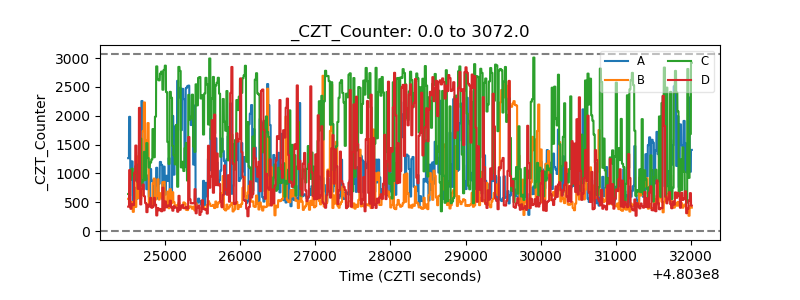 |
| +2.5 Volts monitor | 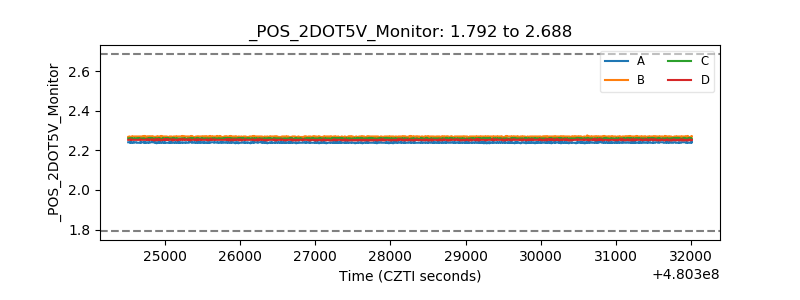 |
| +5 Volts monitor | 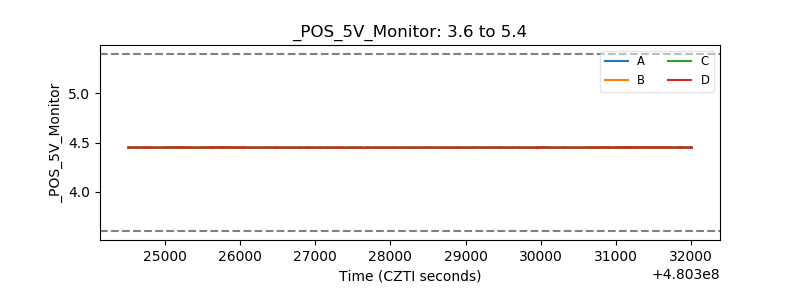 |
| _ROLL_ROT | 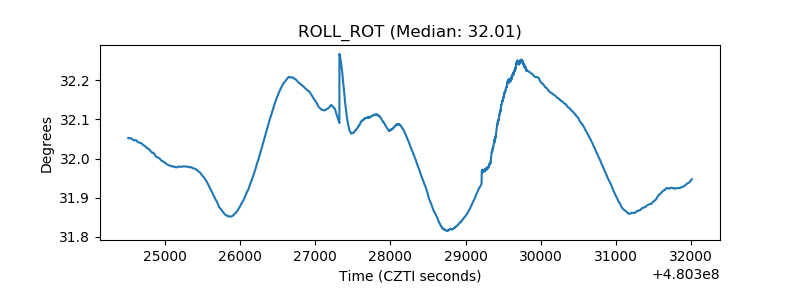 |
| _Roll_DEC | 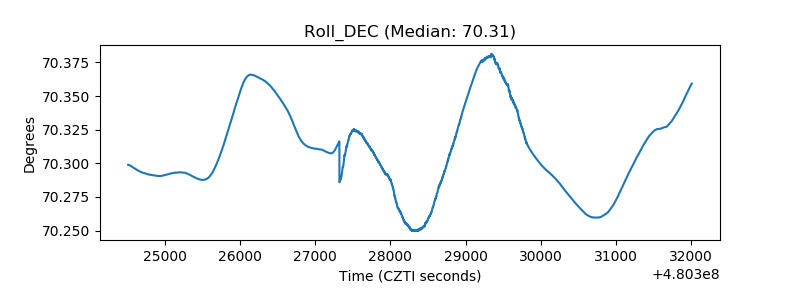 |
| _Roll_RA | 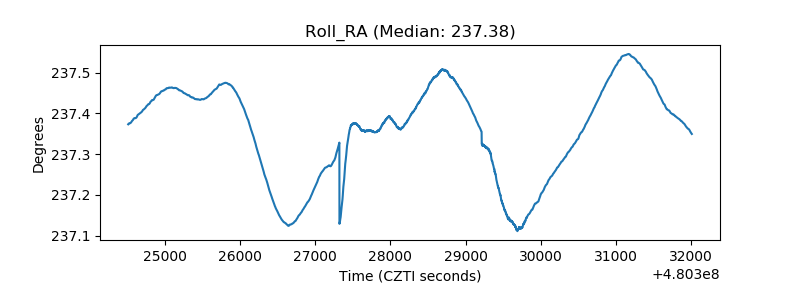 |
| Veto Counter | 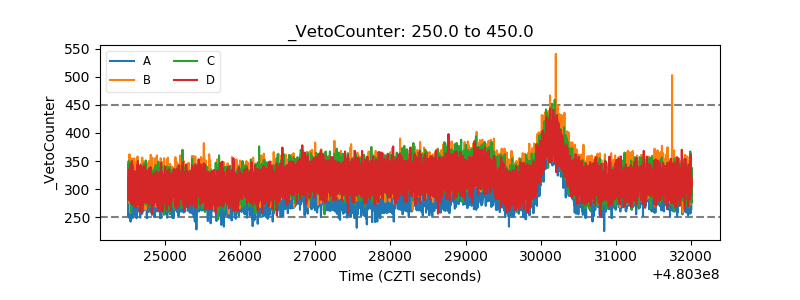 |