| Param | Original file | Final file |
|---|---|---|
| Filename | modeM0/AS1C07_001T01_9000006454_51286cztM0_level2.fits | modeM0/AS1C07_001T01_9000006454_51286cztM0_level2_quad_clean.evt |
| Size (bytes) | 2,324,272,320 | 223,418,880 |
| Size | 2.2 GB | 213.1 MB |
| Events in quadrant A | 21,052,769 | 1,426,873 |
| Events in quadrant B | 11,039,263 | 1,814,029 |
| Events in quadrant C | 31,564,666 | 999,417 |
| Events in quadrant D | 20,935,095 | 1,227,938 |
| Mode M0 | |||
|---|---|---|---|
| Quadrant | BADHDUFLAG | Total packets | Discarded packets |
| A | 0 | 75669 | 41 |
| B | 0 | 45962 | 37 |
| C | 0 | 106895 | 67 |
| D | 0 | 75327 | 51 |
| Mode SS | |||
|---|---|---|---|
| Quadrant | BADHDUFLAG | Total packets | Discarded packets |
| A | 0 | 382 | 0 |
| B | 0 | 381 | 1 |
| C | 0 | 382 | 0 |
| D | 0 | 382 | 0 |
| Mode M9 | |||
|---|---|---|---|
| Quadrant | BADHDUFLAG | Total packets | Discarded packets |
| A | 0 | 10 | 0 |
| B | 0 | 10 | 0 |
| C | 0 | 10 | 0 |
| D | 0 | 10 | 0 |
| Quadrant | Total seconds | Saturated seconds | Saturation percentage |
|---|---|---|---|
| A | 18786 | 3112 | 16.565528% |
| B | 18781 | 738 | 3.929503% |
| C | 18780 | 7737 | 41.198083% |
| D | 18785 | 3853 | 20.511046% |
Noise dominated data is calculated using 1-second bins in cleaned event files. If a bin has >2000 counts, and if more than 50% of those come from <1% of pixels, then it is considered to be noise-dominated and hence unusable.
| Quadrant | # 1 sec bins | Bins with >0 counts | Bins with >2000 counts | High rate bins dominated by noise | Noise dominated (total time) | Noise dominated (detector-on time) | Marked lightcurve |
|---|---|---|---|---|---|---|---|
| A | 19907 | 18792 | 2356 | 2356 | 11.84% | 12.54% | 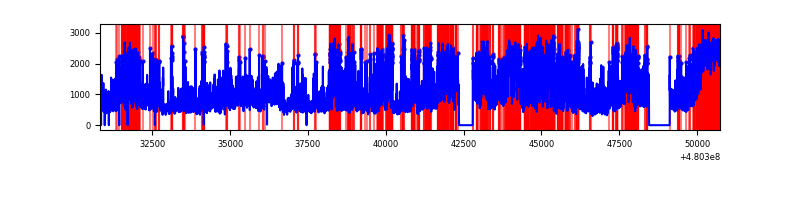 |
| B | 19907 | 18792 | 253 | 253 | 1.27% | 1.35% | 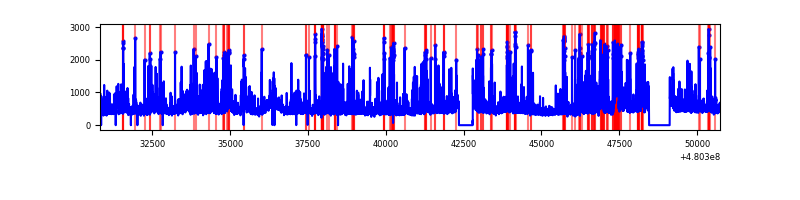 |
| C | 19907 | 18791 | 7576 | 7576 | 38.06% | 40.32% | 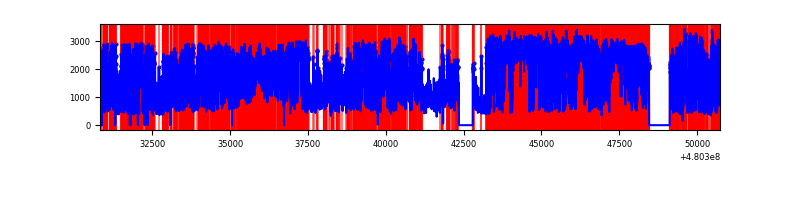 |
| D | 19907 | 18794 | 3793 | 3793 | 19.05% | 20.18% | 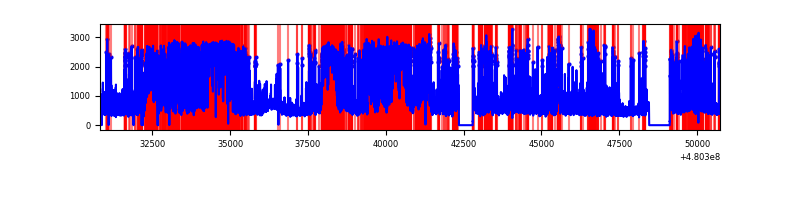 |
Top three noisy pixels from each quadrant. If the there are fewer than three noisy pixels in the level2.evt file, extra rows are filled as -1
| Pixel properties | Quadrant properties | ||||||
|---|---|---|---|---|---|---|---|
| Quadrant | DetID | PixID | Counts | Sigma | Mean | Median | Sigma |
| A | 12 | 3 | 5335342 | 11475.87 | 1869 | 1822 | 464.8 |
| A | 12 | 250 | 3789208 | 8149.13 | 1869 | 1822 | 464.8 |
| A | 9 | 96 | 1407006 | 3023.47 | 1869 | 1822 | 464.8 |
| B | 5 | 185 | 996385 | 2377.9 | 1951 | 1878 | 418.2 |
| B | 5 | 172 | 435378 | 1036.51 | 1951 | 1878 | 418.2 |
| B | 4 | 170 | 349084 | 830.18 | 1951 | 1878 | 418.2 |
| C | 4 | 12 | 17245078 | 40805.44 | 1530 | 1519 | 422.6 |
| C | 10 | 171 | 3810233 | 9013.0 | 1530 | 1519 | 422.6 |
| C | 3 | 233 | 1736666 | 4106.08 | 1530 | 1519 | 422.6 |
| D | 12 | 2 | 3328077 | 6831.54 | 1755 | 1695 | 486.9 |
| D | 7 | 60 | 3270828 | 6713.96 | 1755 | 1695 | 486.9 |
| D | 8 | 176 | 1453883 | 2982.42 | 1755 | 1695 | 486.9 |
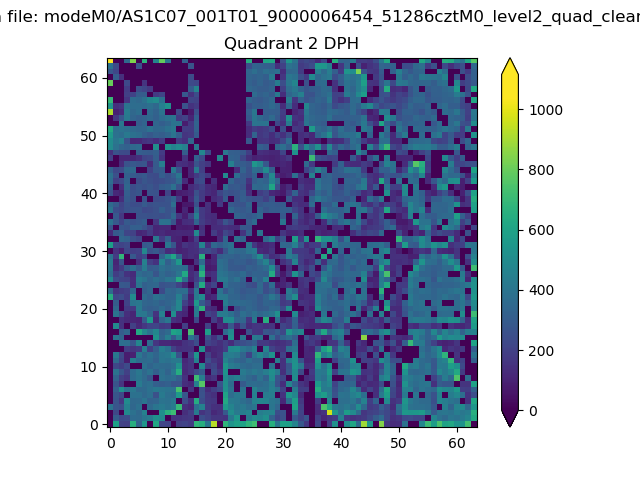
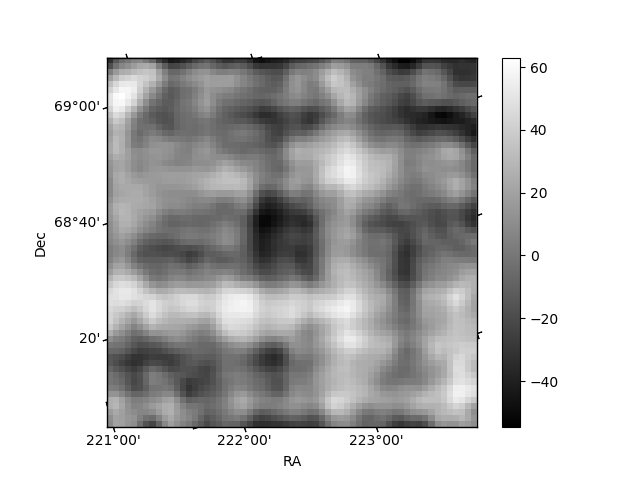
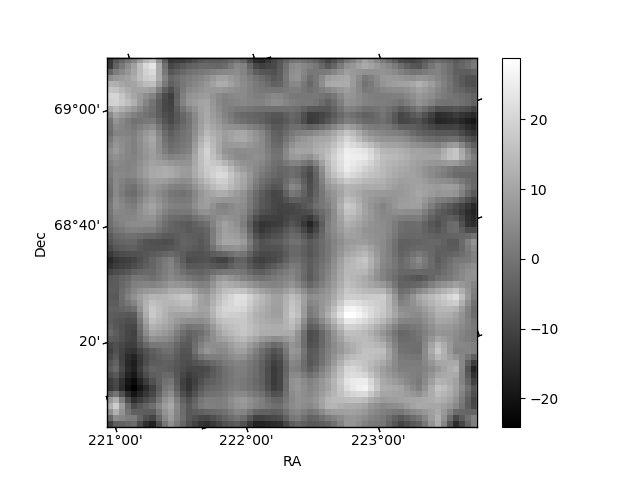
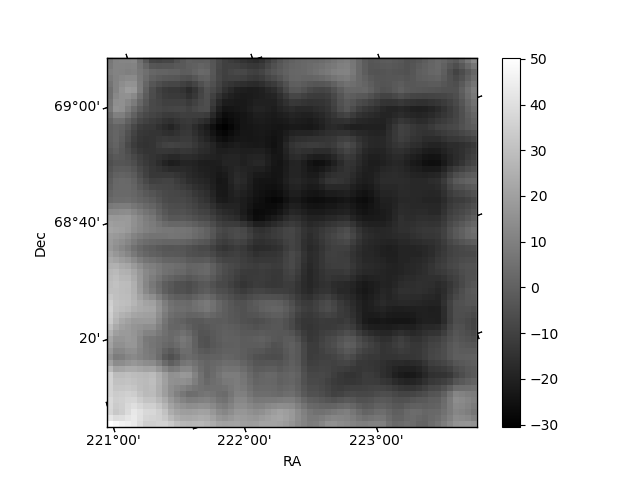
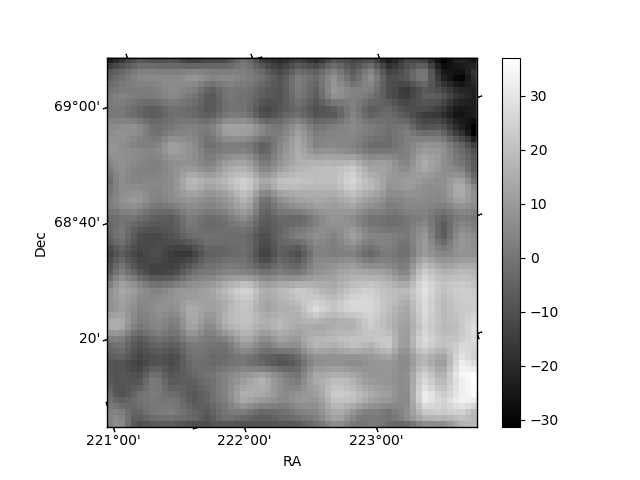
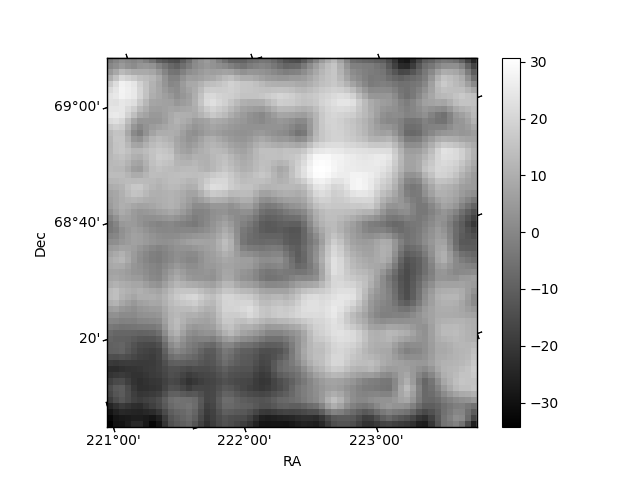
Histogram calculated using DETX and DETY for each event in the final _common_clean file
| Quadrant A | 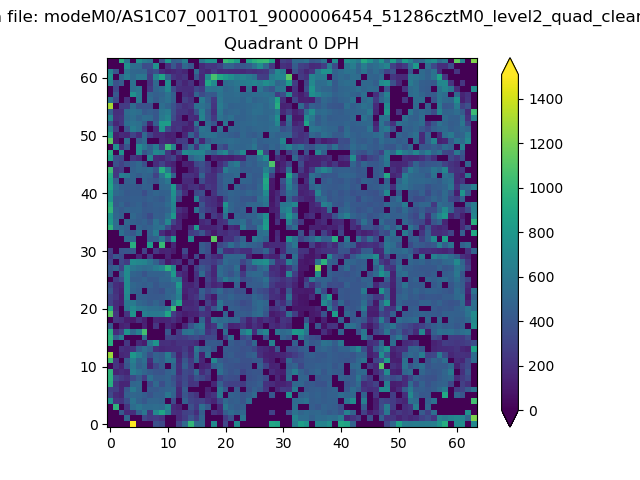 |
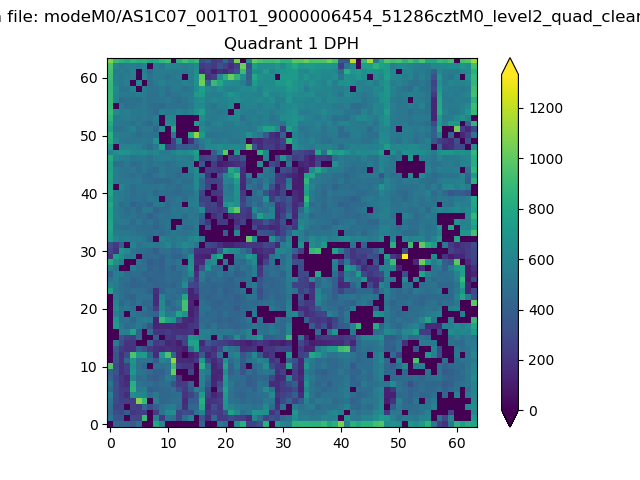 |
Quadrant B |
|---|---|---|---|
| Quadrant D | 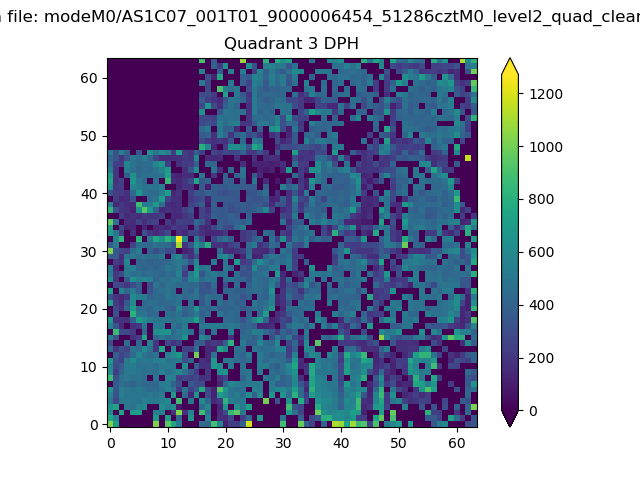 |
 |
Quadrant C |
| Plot type | Count rate plots | Images |
|---|---|---|
| Comparison with Poisson distribution Blue bars denote a histogram of data divided into 1 sec bins. Red curve is a Poisson curve with rate = median count rate of data. |
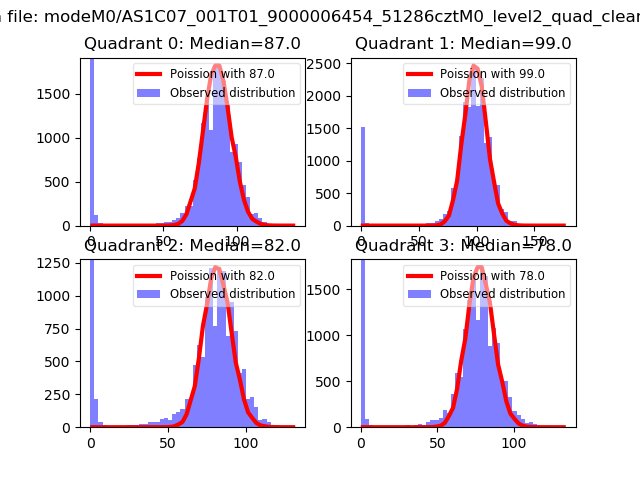 |
 |
| Quadrant-wise count rates Data is divided into 100 sec bins |
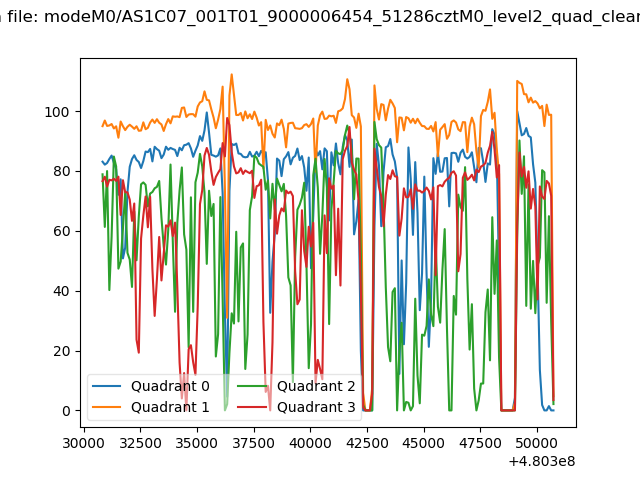 |
|
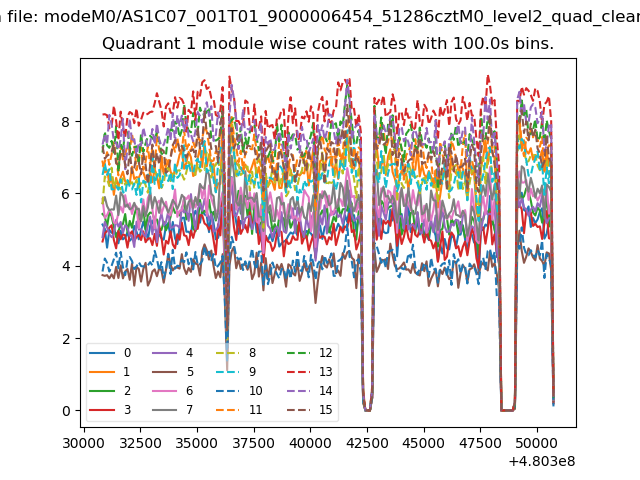
| Module-wise count rates for Quadrant A Data is divided into 100 sec bins |
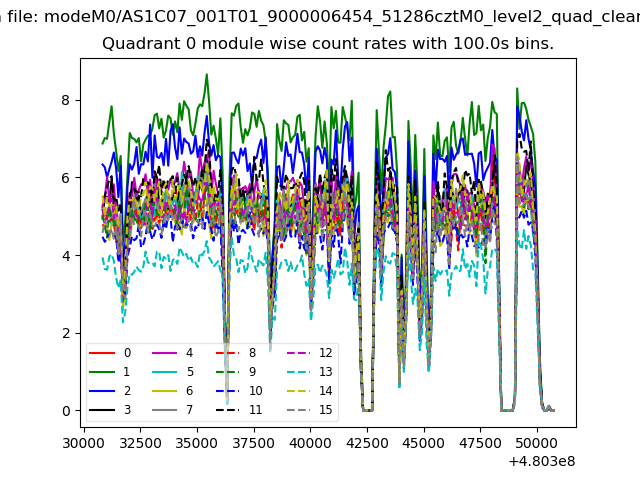 |
 |
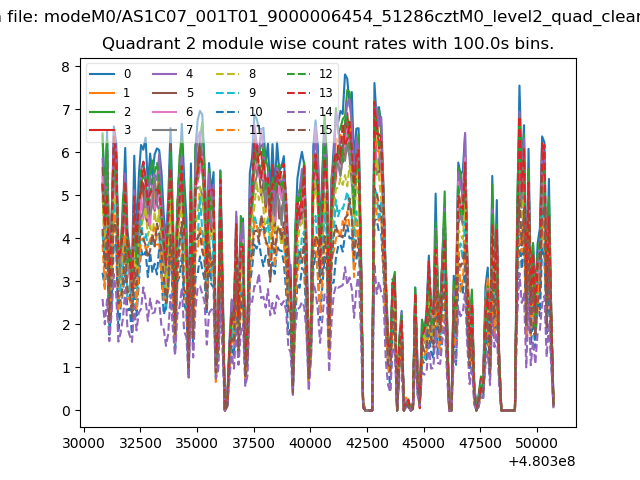
| Module-wise count rates for Quadrant B Data is divided into 100 sec bins |
 |
 |
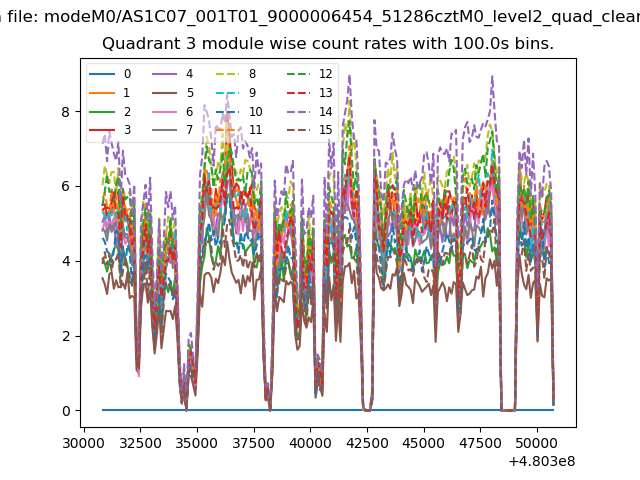
| Module-wise count rates for Quadrant C Data is divided into 100 sec bins |
 |
 |
| Module-wise count rates for Quadrant D Data is divided into 100 sec bins |
 |
 |
| Parameter | Plot |
|---|---|
| CZT HV Monitor | 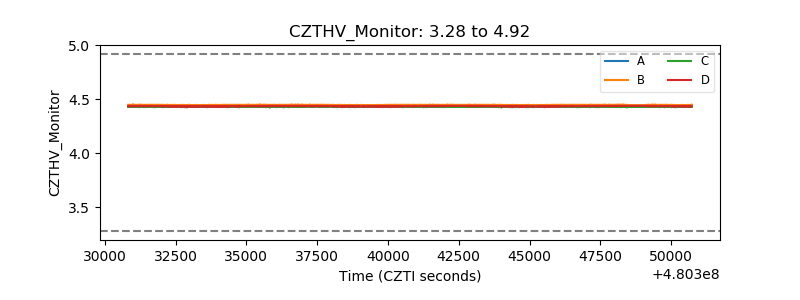 |
| D_VDD |  |
| Temperature 1 | 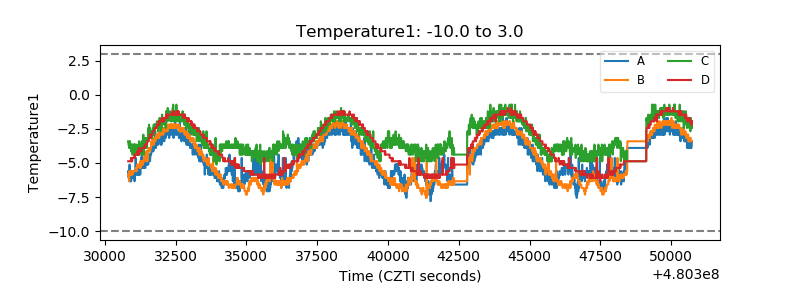 |
| Veto HV Monitor | 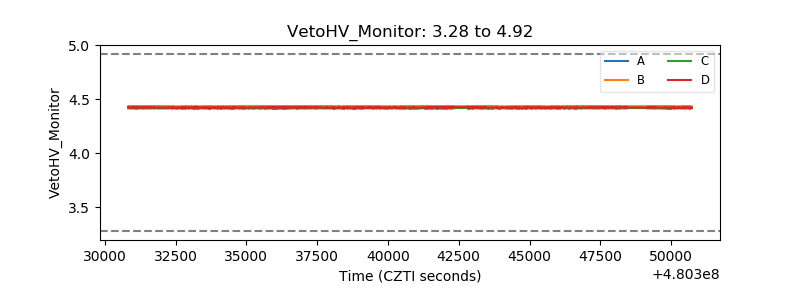 |
| Veto LLD | 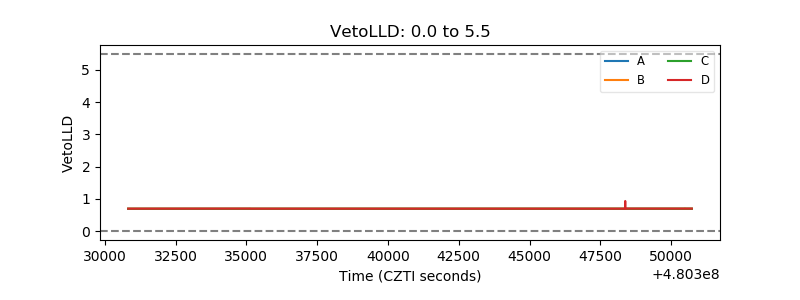 |
| Alpha Counter | 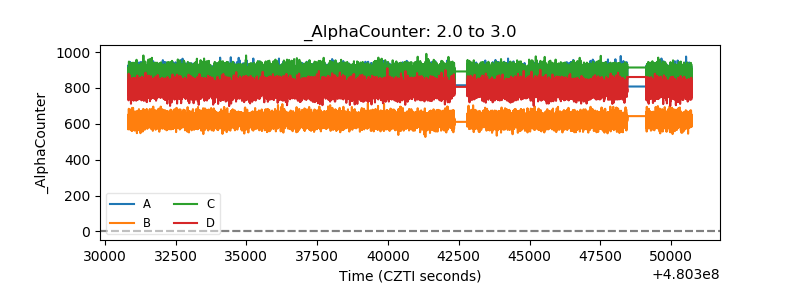 |
| _CPM_Rate | 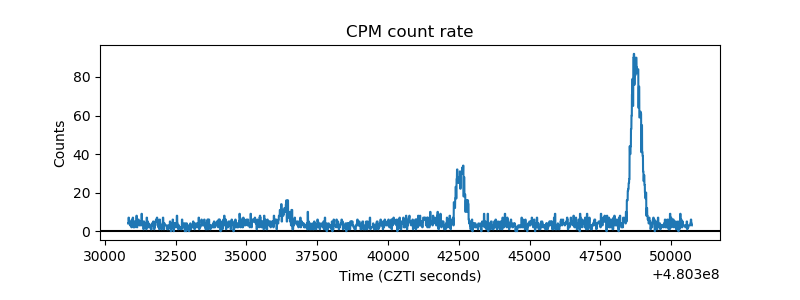 |
| CZT Counter | 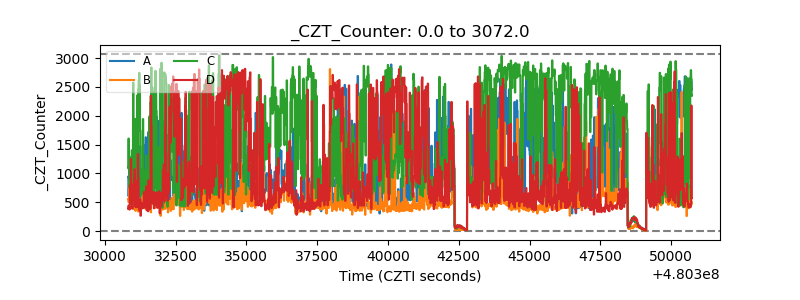 |
| +2.5 Volts monitor | 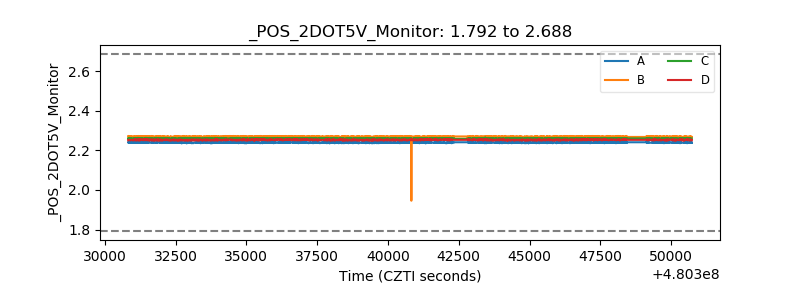 |
| +5 Volts monitor | 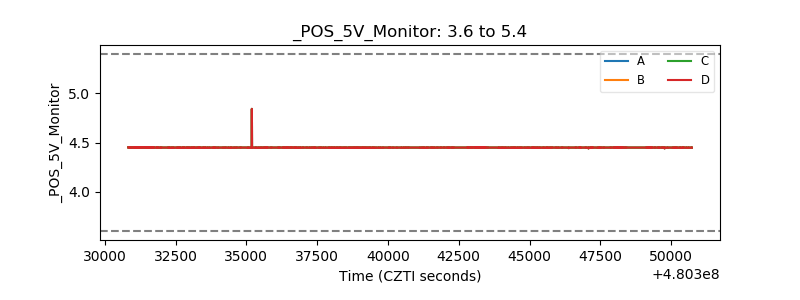 |
| _ROLL_ROT | 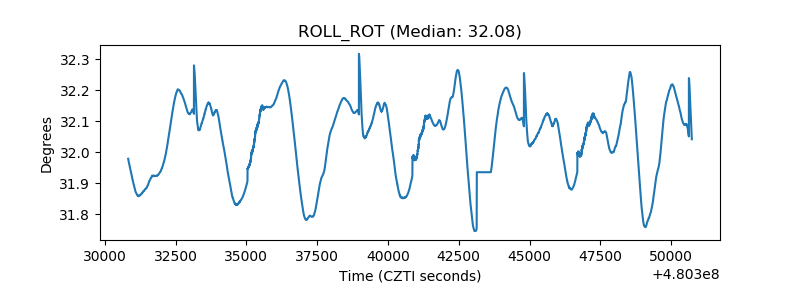 |
| _Roll_DEC | 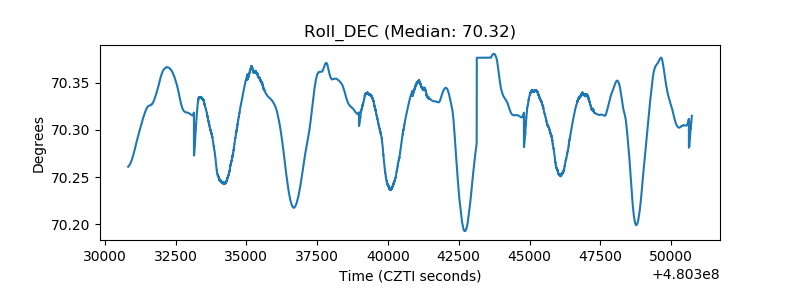 |
| _Roll_RA | 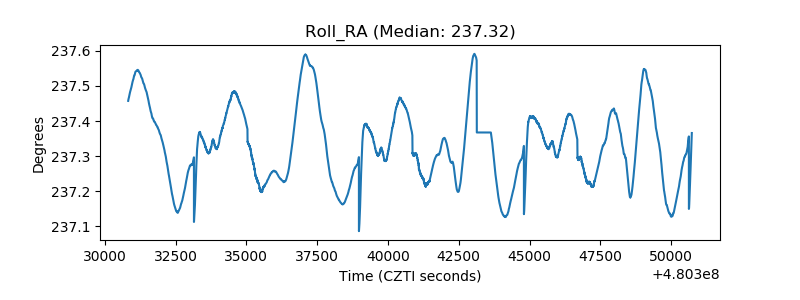 |
| Veto Counter | 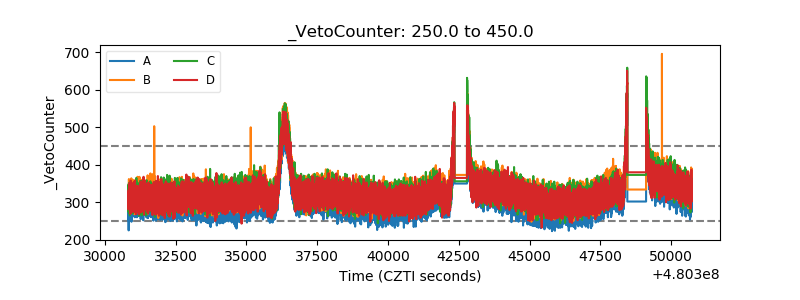 |