| Param | Original file | Final file |
|---|---|---|
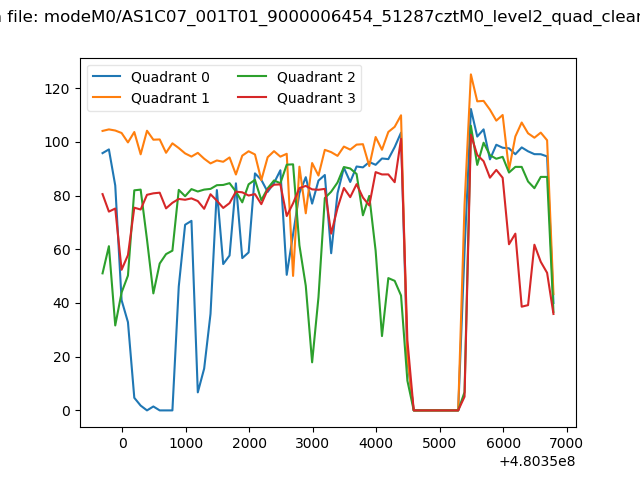
| Filename | modeM0/AS1C07_001T01_9000006454_51287cztM0_level2.fits | modeM0/AS1C07_001T01_9000006454_51287cztM0_level2_quad_clean.evt |
| Size (bytes) | 711,668,160 | 80,219,520 |
| Size | 678.7 MB | 76.5 MB |
| Events in quadrant A | 8,841,794 | 442,962 |
| Events in quadrant B | 4,156,161 | 612,393 |
| Events in quadrant C | 7,044,883 | 457,688 |
| Events in quadrant D | 5,817,428 | 478,709 |
| Mode M0 | |||
|---|---|---|---|
| Quadrant | BADHDUFLAG | Total packets | Discarded packets |
| A | 0 | 30719 | 70 |
| B | 0 | 16593 | 29 |
| C | 0 | 25299 | 58 |
| D | 0 | 21716 | 47 |
| Mode SS | |||
|---|---|---|---|
| Quadrant | BADHDUFLAG | Total packets | Discarded packets |
| A | 0 | 130 | 0 |
| B | 0 | 130 | 0 |
| C | 0 | 130 | 0 |
| D | 0 | 130 | 0 |
| Mode M9 | |||
|---|---|---|---|
| Quadrant | BADHDUFLAG | Total packets | Discarded packets |
| A | 0 | 8 | 0 |
| B | 0 | 8 | 0 |
| C | 0 | 8 | 0 |
| D | 0 | 8 | 0 |
| Quadrant | Total seconds | Saturated seconds | Saturation percentage |
|---|---|---|---|
| A | 6247 | 1723 | 27.581239% |
| B | 6246 | 322 | 5.155299% |
| C | 6251 | 1334 | 21.340586% |
| D | 6244 | 787 | 12.604100% |
Noise dominated data is calculated using 1-second bins in cleaned event files. If a bin has >2000 counts, and if more than 50% of those come from <1% of pixels, then it is considered to be noise-dominated and hence unusable.
| Quadrant | # 1 sec bins | Bins with >0 counts | Bins with >2000 counts | High rate bins dominated by noise | Noise dominated (total time) | Noise dominated (detector-on time) | Marked lightcurve |
|---|---|---|---|---|---|---|---|
| A | 7146 | 6259 | 1621 | 1621 | 22.68% | 25.90% | 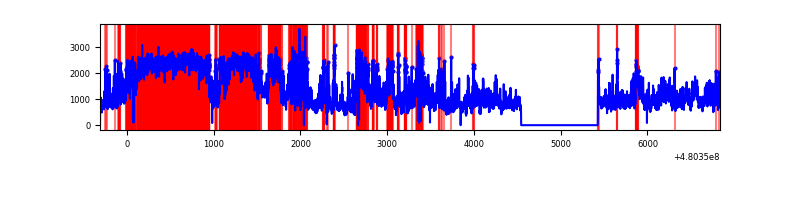 |
| B | 7147 | 6259 | 207 | 207 | 2.90% | 3.31% | 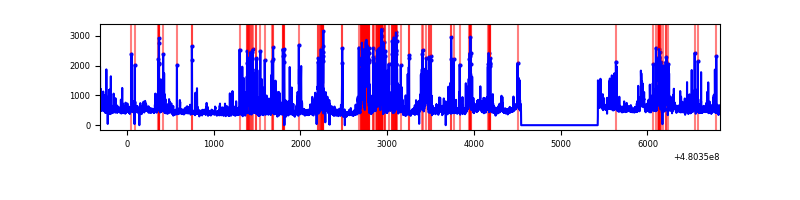 |
| C | 7146 | 6262 | 1279 | 1279 | 17.90% | 20.42% | 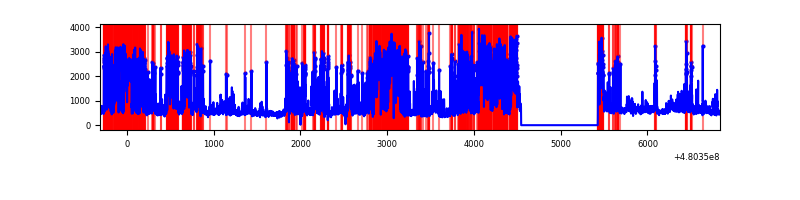 |
| D | 7146 | 6256 | 668 | 668 | 9.35% | 10.68% | 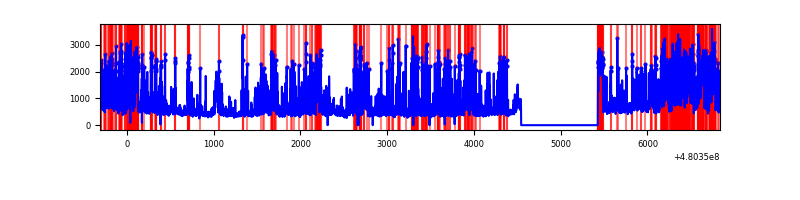 |
Top three noisy pixels from each quadrant. If the there are fewer than three noisy pixels in the level2.evt file, extra rows are filled as -1
| Pixel properties | Quadrant properties | ||||||
|---|---|---|---|---|---|---|---|
| Quadrant | DetID | PixID | Counts | Sigma | Mean | Median | Sigma |
| A | 12 | 3 | 2066921 | 13868.44 | 596 | 582 | 149.0 |
| A | 9 | 96 | 1762025 | 11822.1 | 596 | 582 | 149.0 |
| A | 12 | 250 | 1241925 | 8331.4 | 596 | 582 | 149.0 |
| B | 5 | 185 | 633665 | 4588.52 | 647 | 626 | 138.0 |
| B | 5 | 172 | 183099 | 1322.64 | 647 | 626 | 138.0 |
| B | 10 | 247 | 178497 | 1289.28 | 647 | 626 | 138.0 |
| C | 4 | 12 | 3834867 | 24380.09 | 574 | 570 | 157.3 |
| C | 10 | 171 | 353139 | 2241.78 | 574 | 570 | 157.3 |
| C | 13 | 3 | 180206 | 1142.2 | 574 | 570 | 157.3 |
| D | 2 | 216 | 1012867 | 5970.33 | 605 | 582 | 169.6 |
| D | 8 | 176 | 630756 | 3716.69 | 605 | 582 | 169.6 |
| D | 12 | 2 | 570383 | 3360.62 | 605 | 582 | 169.6 |
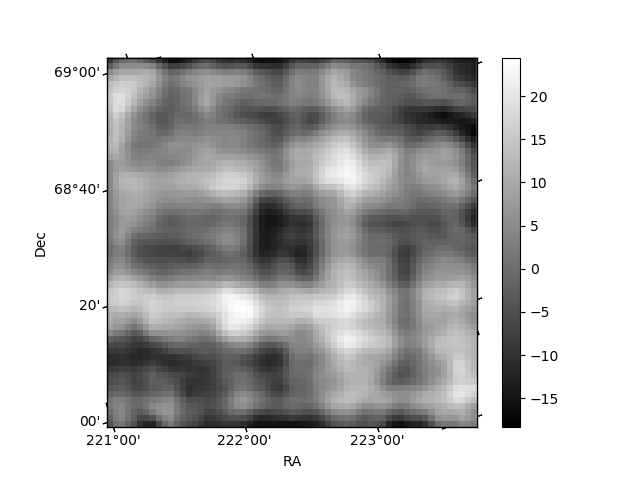
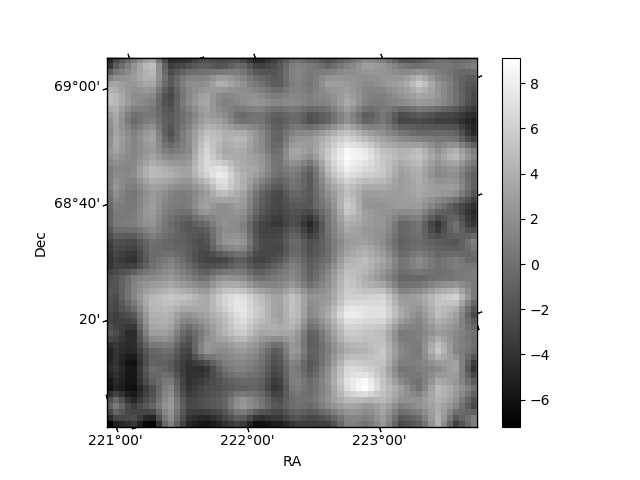
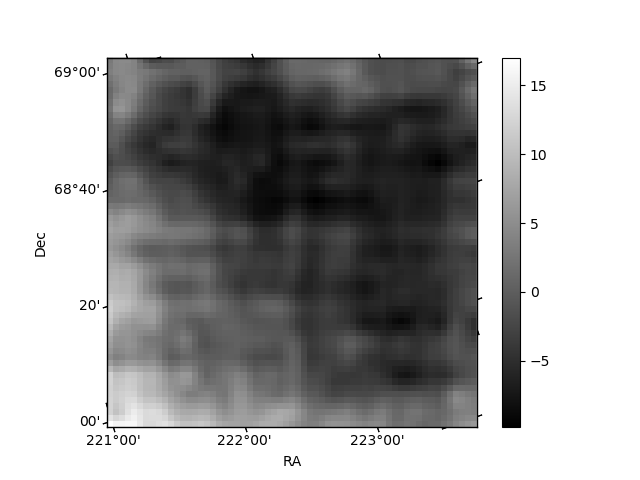
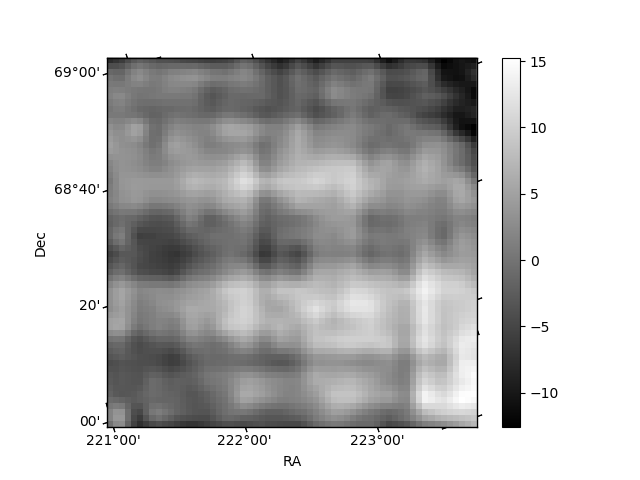
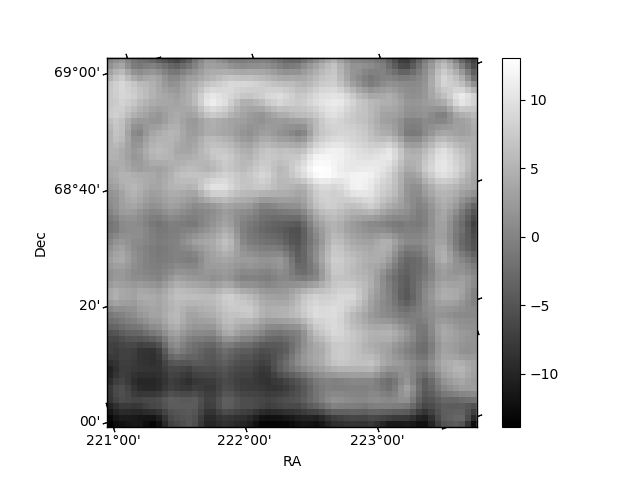
Histogram calculated using DETX and DETY for each event in the final _common_clean file
| Quadrant A | 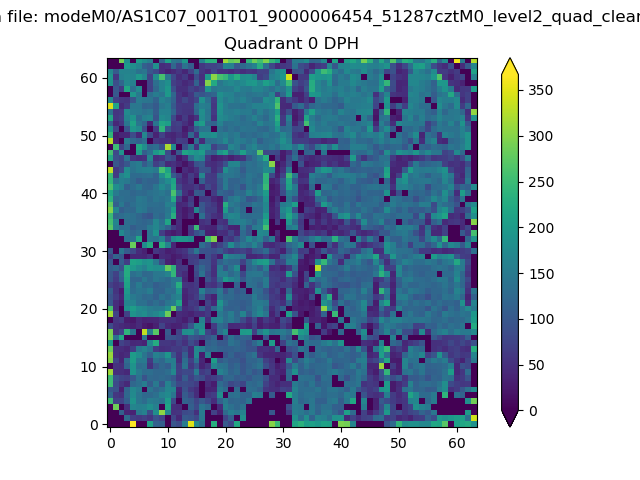 |
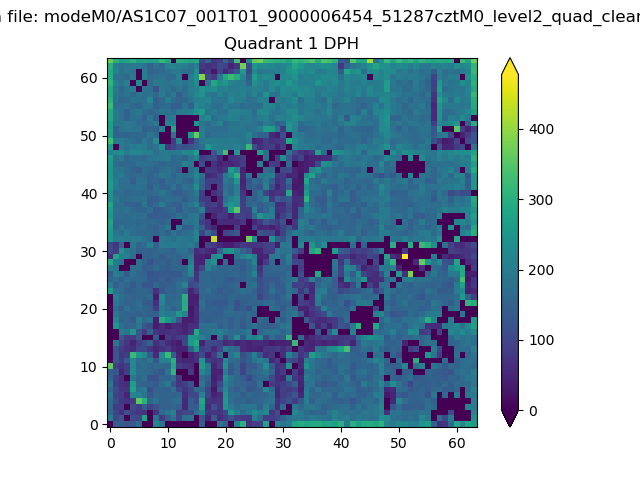 |
Quadrant B |
|---|---|---|---|
| Quadrant D | 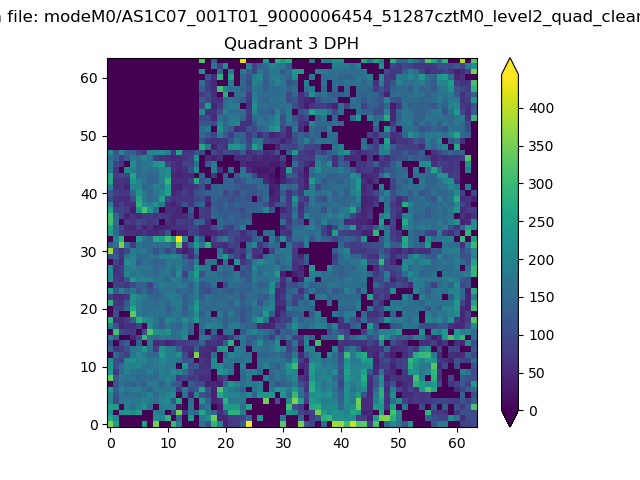 |
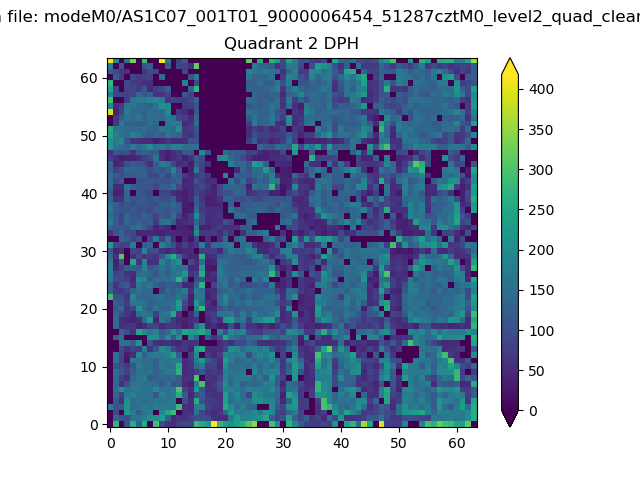 |
Quadrant C |
| Plot type | Count rate plots | Images |
|---|---|---|
| Comparison with Poisson distribution Blue bars denote a histogram of data divided into 1 sec bins. Red curve is a Poisson curve with rate = median count rate of data. |
 |
 |
| Quadrant-wise count rates Data is divided into 100 sec bins |
 |
|
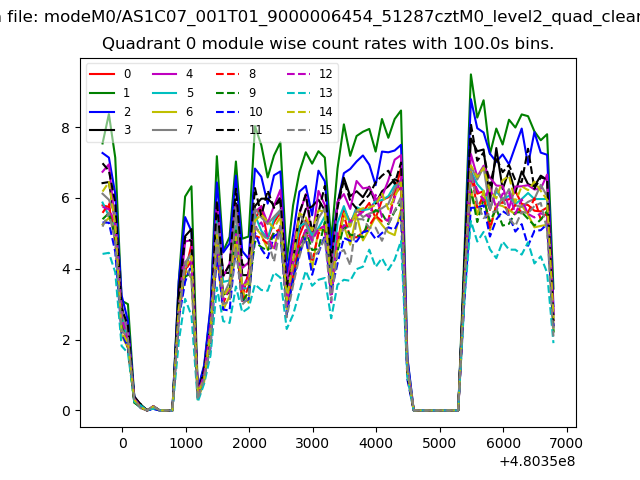
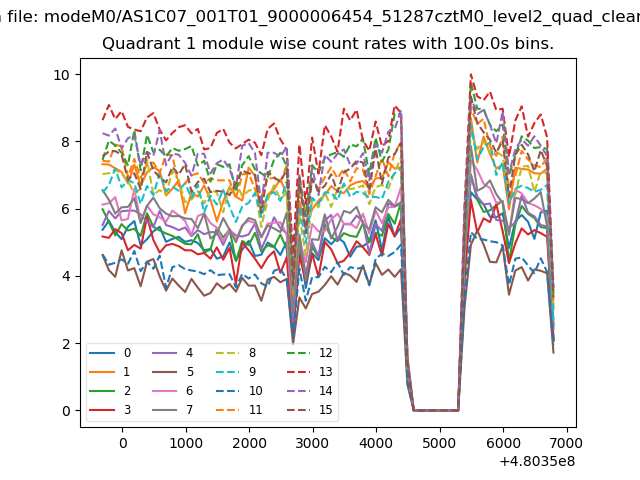
| Module-wise count rates for Quadrant A Data is divided into 100 sec bins |
 |
 |
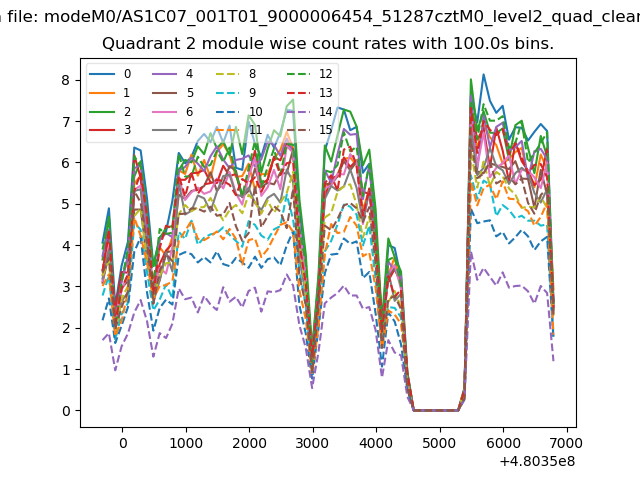
| Module-wise count rates for Quadrant B Data is divided into 100 sec bins |
 |
 |
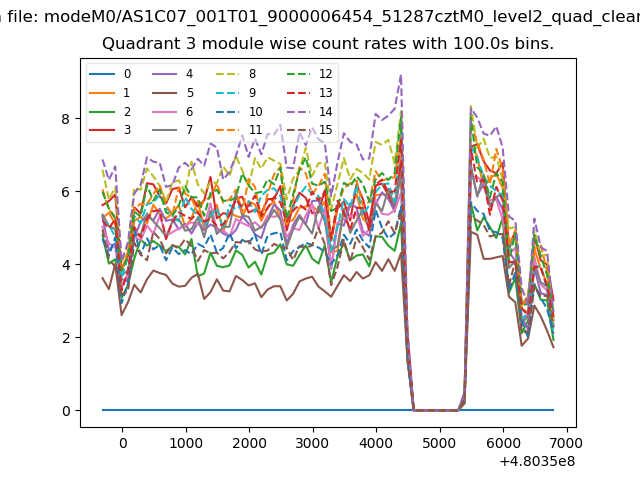
| Module-wise count rates for Quadrant C Data is divided into 100 sec bins |
 |
 |
| Module-wise count rates for Quadrant D Data is divided into 100 sec bins |
 |
 |
| Parameter | Plot |
|---|---|
| CZT HV Monitor | 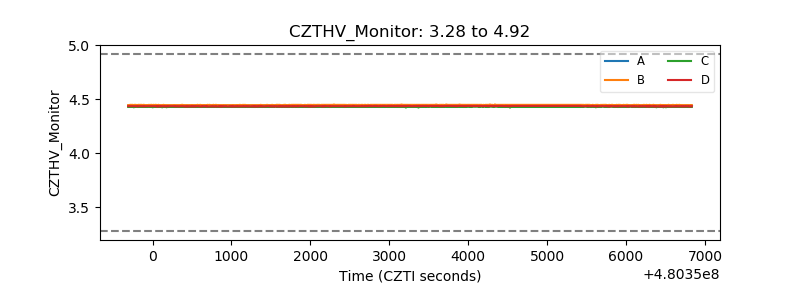 |
| D_VDD | 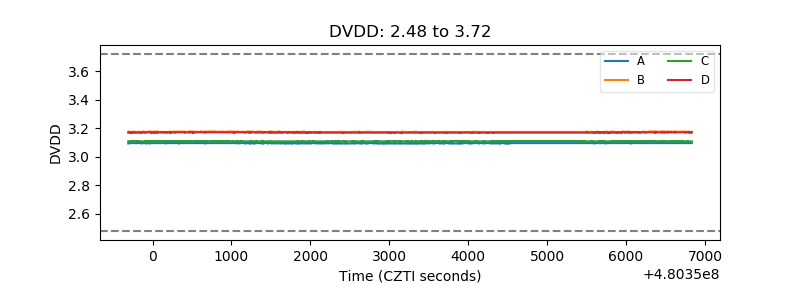 |
| Temperature 1 | 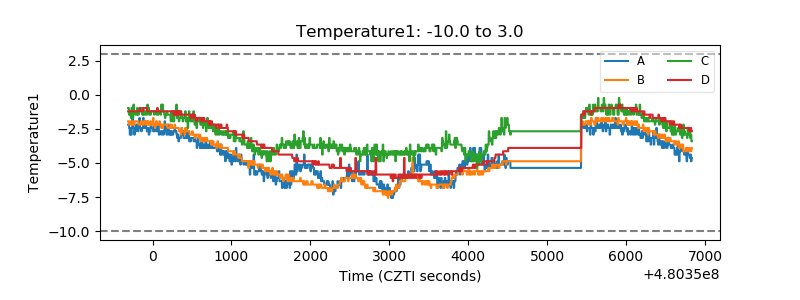 |
| Veto HV Monitor | 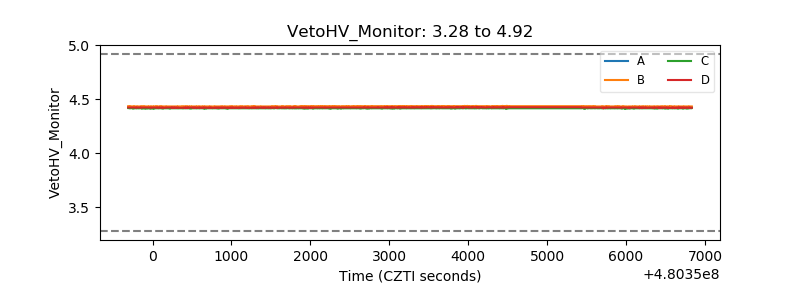 |
| Veto LLD | 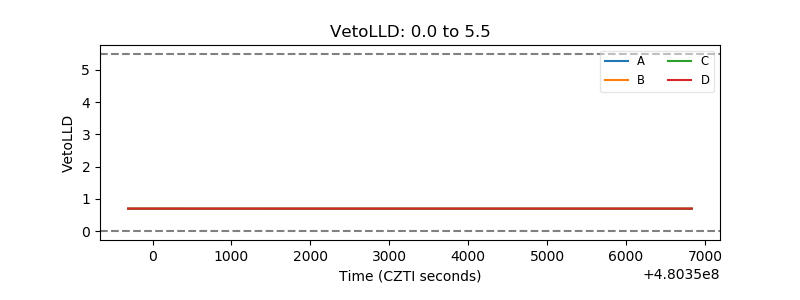 |
| Alpha Counter | 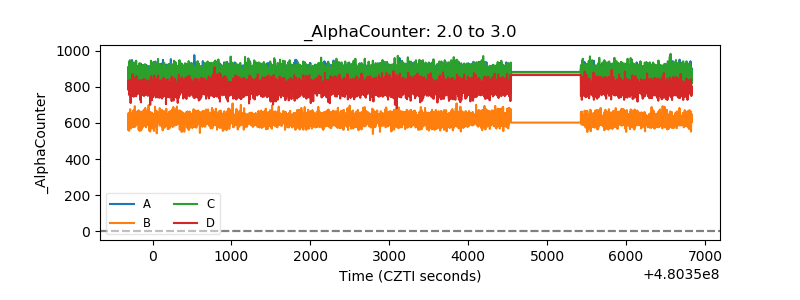 |
| _CPM_Rate | 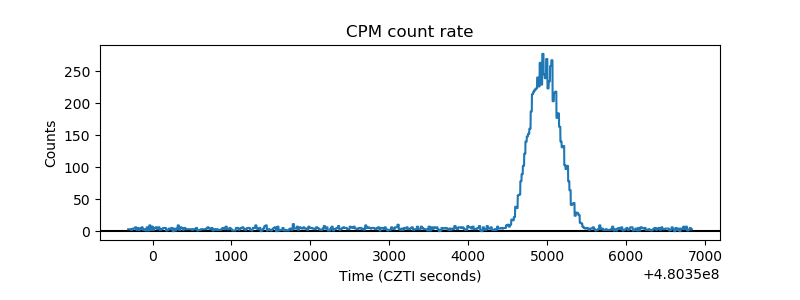 |
| CZT Counter | 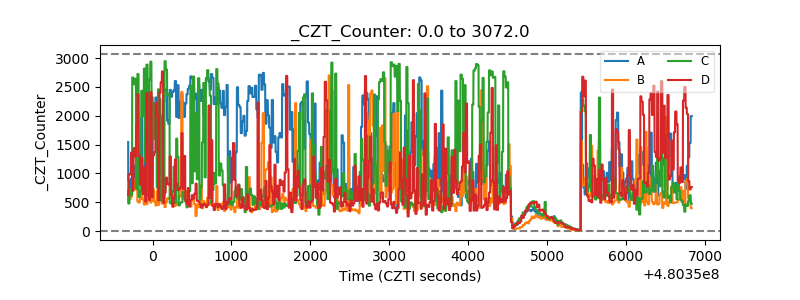 |
| +2.5 Volts monitor | 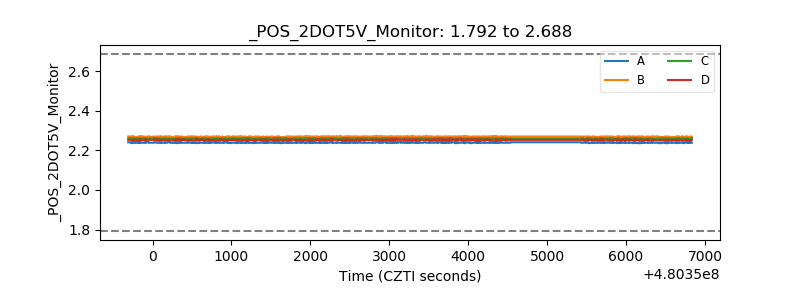 |
| +5 Volts monitor | 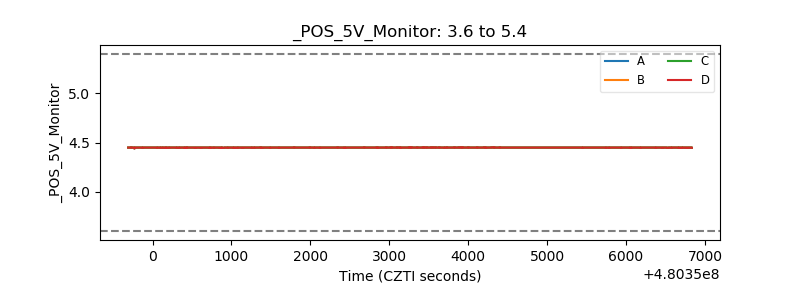 |
| _ROLL_ROT | 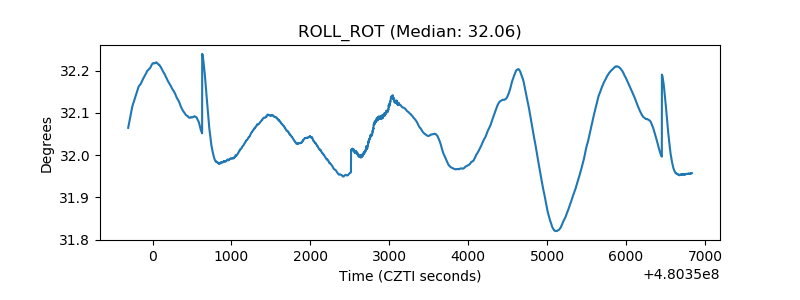 |
| _Roll_DEC | 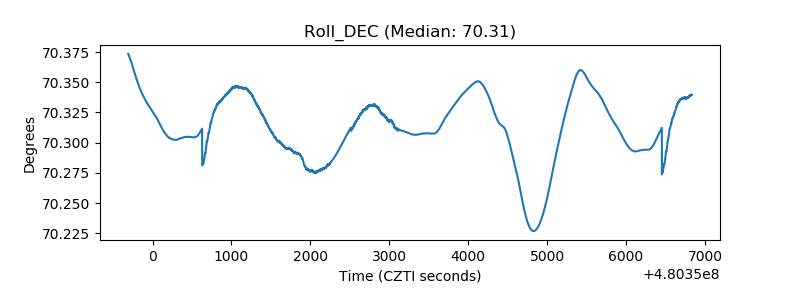 |
| _Roll_RA | 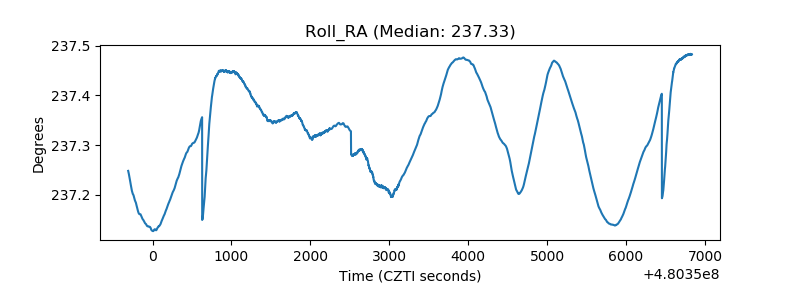 |
| Veto Counter | 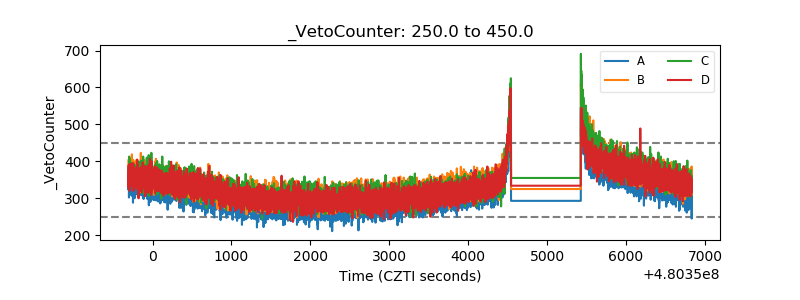 |