| Param | Original file | Final file |
|---|---|---|
| Filename | modeM0/AS1C07_001T01_9000006454_51289cztM0_level2.fits | modeM0/AS1C07_001T01_9000006454_51289cztM0_level2_quad_clean.evt |
| Size (bytes) | 746,619,840 | 88,626,240 |
| Size | 712.0 MB | 84.5 MB |
| Events in quadrant A | 6,417,753 | 616,868 |
| Events in quadrant B | 4,697,987 | 677,985 |
| Events in quadrant C | 9,794,085 | 406,242 |
| Events in quadrant D | 6,218,212 | 522,115 |
| Mode M0 | |||
|---|---|---|---|
| Quadrant | BADHDUFLAG | Total packets | Discarded packets |
| A | 0 | 23788 | 2 |
| B | 0 | 18403 | 4 |
| C | 0 | 33649 | 28 |
| D | 0 | 23160 | 5 |
| Mode SS | |||
|---|---|---|---|
| Quadrant | BADHDUFLAG | Total packets | Discarded packets |
| A | 0 | 138 | 0 |
| B | 0 | 138 | 0 |
| C | 0 | 138 | 0 |
| D | 0 | 138 | 0 |
| Mode M9 | |||
|---|---|---|---|
| Quadrant | BADHDUFLAG | Total packets | Discarded packets |
| A | 0 | 17 | 0 |
| B | 0 | 18 | 0 |
| C | 0 | 18 | 0 |
| D | 0 | 18 | 0 |
| Quadrant | Total seconds | Saturated seconds | Saturation percentage |
|---|---|---|---|
| A | 6592 | 254 | 3.853155% |
| B | 6591 | 229 | 3.474435% |
| C | 6588 | 2480 | 37.644202% |
| D | 6590 | 803 | 12.185129% |
Noise dominated data is calculated using 1-second bins in cleaned event files. If a bin has >2000 counts, and if more than 50% of those come from <1% of pixels, then it is considered to be noise-dominated and hence unusable.
| Quadrant | # 1 sec bins | Bins with >0 counts | Bins with >2000 counts | High rate bins dominated by noise | Noise dominated (total time) | Noise dominated (detector-on time) | Marked lightcurve |
|---|---|---|---|---|---|---|---|
| A | 7622 | 6593 | 117 | 117 | 1.54% | 1.77% | 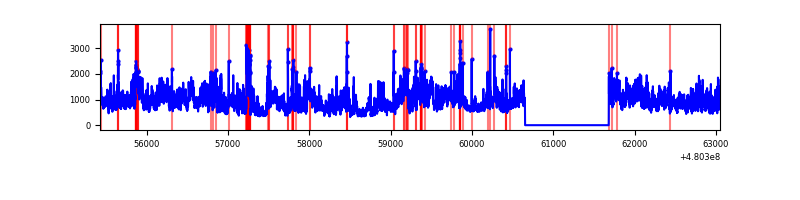 |
| B | 7622 | 6593 | 145 | 145 | 1.90% | 2.20% | 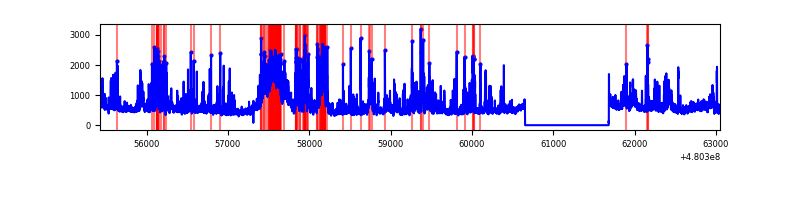 |
| C | 7621 | 6592 | 2395 | 2395 | 31.43% | 36.33% | 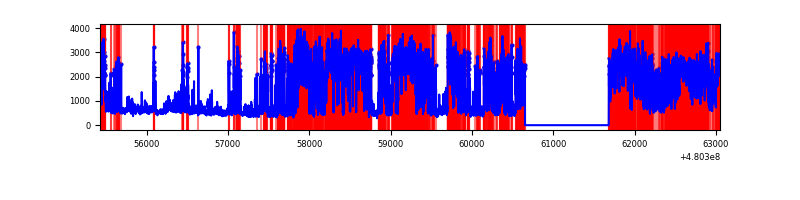 |
| D | 7621 | 6592 | 691 | 691 | 9.07% | 10.48% | 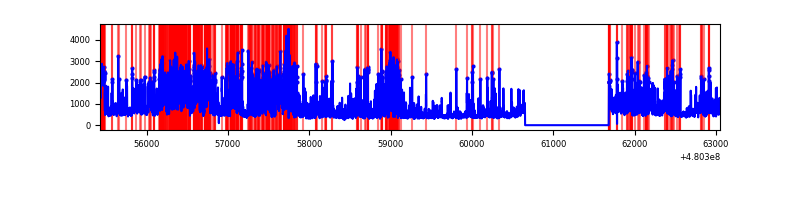 |
Top three noisy pixels from each quadrant. If the there are fewer than three noisy pixels in the level2.evt file, extra rows are filled as -1
| Pixel properties | Quadrant properties | ||||||
|---|---|---|---|---|---|---|---|
| Quadrant | DetID | PixID | Counts | Sigma | Mean | Median | Sigma |
| A | 12 | 3 | 2308119 | 13161.63 | 699 | 680 | 175.3 |
| A | 9 | 191 | 316974 | 1804.14 | 699 | 680 | 175.3 |
| A | 12 | 194 | 269626 | 1534.07 | 699 | 680 | 175.3 |
| B | 10 | 254 | 603002 | 4020.06 | 702 | 678 | 149.8 |
| B | 5 | 185 | 377224 | 2513.16 | 702 | 678 | 149.8 |
| B | 4 | 170 | 270389 | 1800.12 | 702 | 678 | 149.8 |
| C | 4 | 12 | 6560840 | 42445.98 | 566 | 563 | 154.6 |
| C | 10 | 171 | 572578 | 3701.02 | 566 | 563 | 154.6 |
| C | 13 | 3 | 143422 | 924.32 | 566 | 563 | 154.6 |
| D | 12 | 2 | 1020725 | 5605.59 | 652 | 628 | 182.0 |
| D | 2 | 216 | 919792 | 5050.95 | 652 | 628 | 182.0 |
| D | 8 | 176 | 444594 | 2439.66 | 652 | 628 | 182.0 |
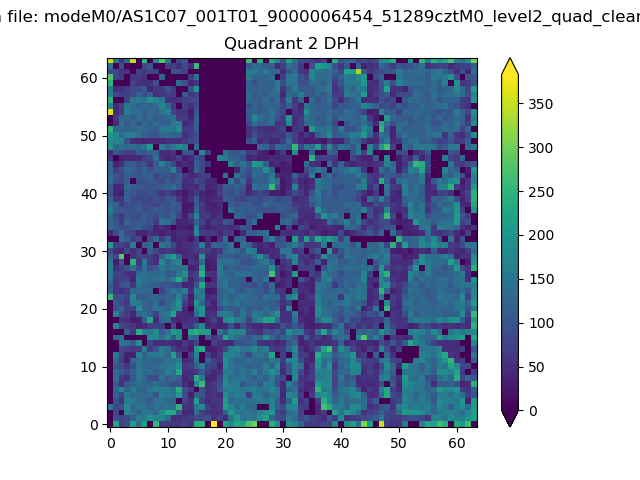
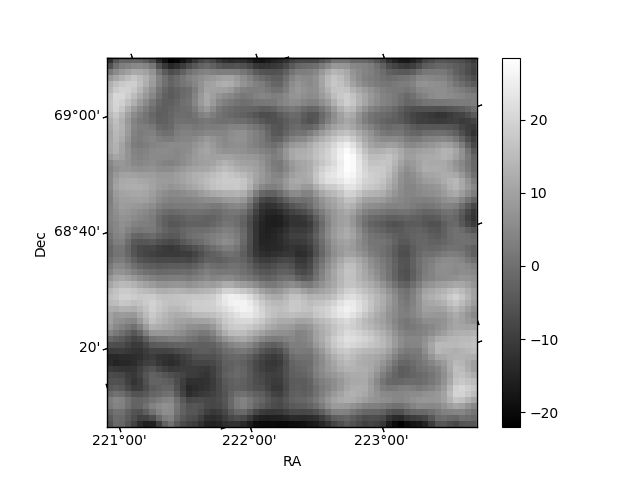
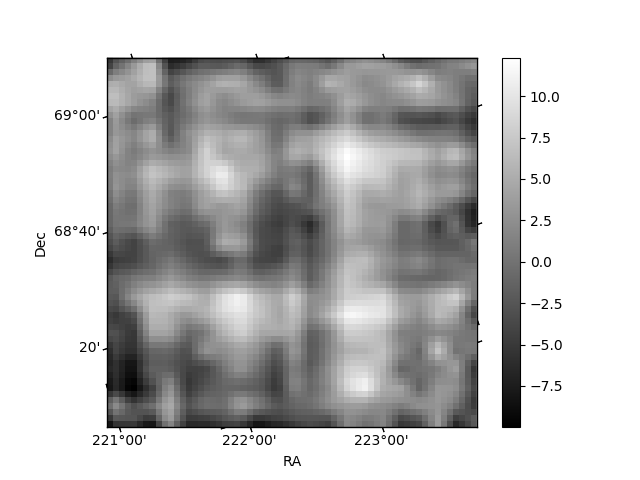
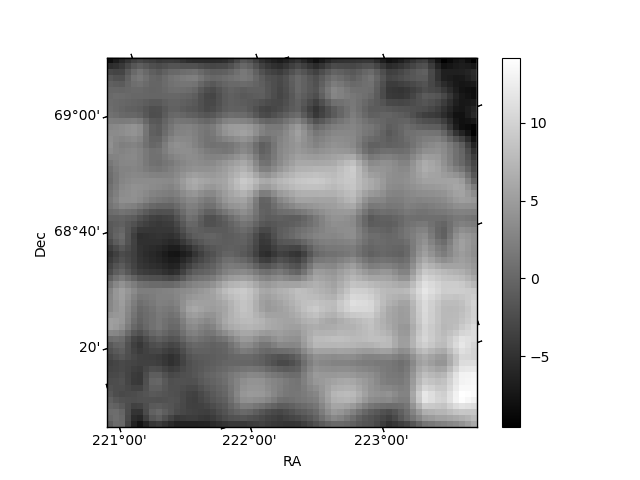
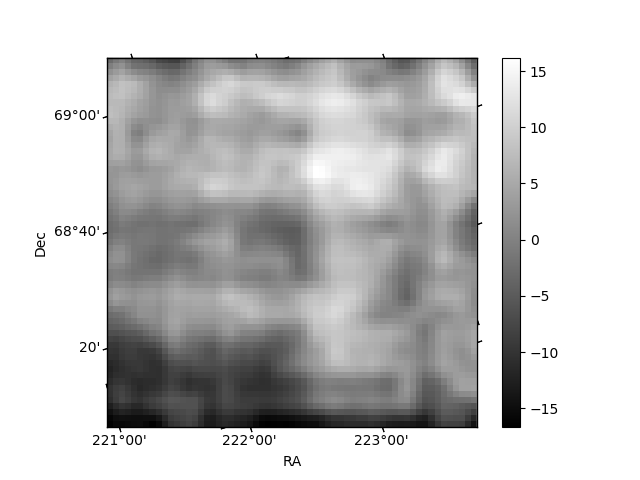
Histogram calculated using DETX and DETY for each event in the final _common_clean file
| Quadrant A | 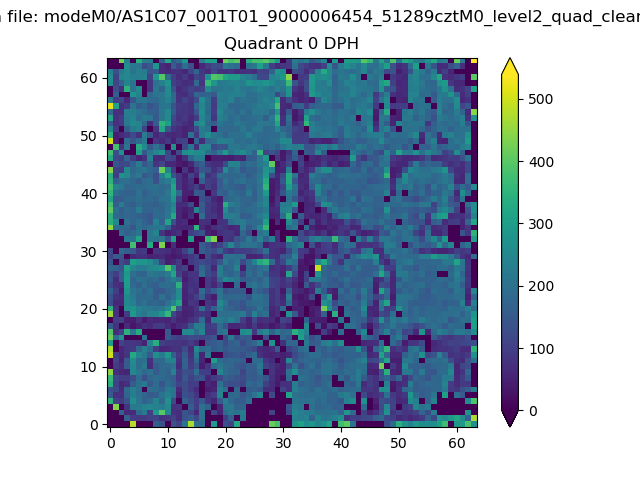 |
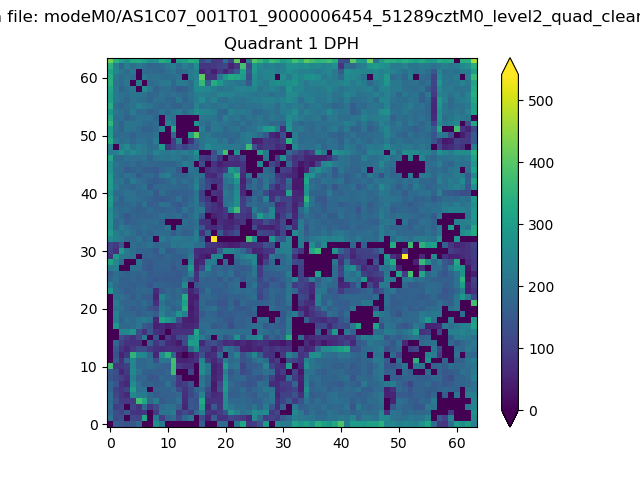 |
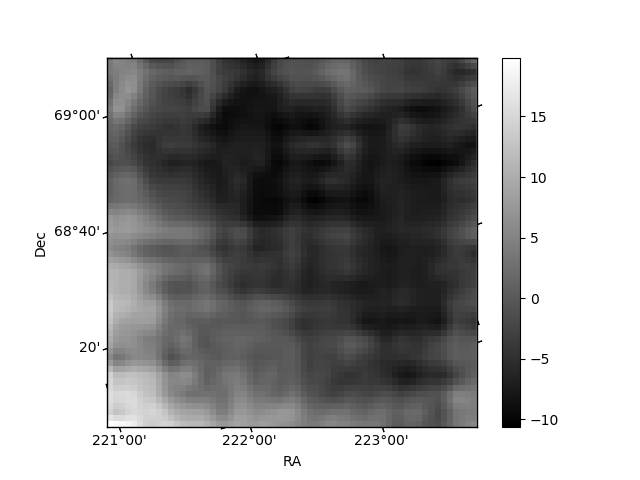
Quadrant B |
|---|---|---|---|
| Quadrant D | 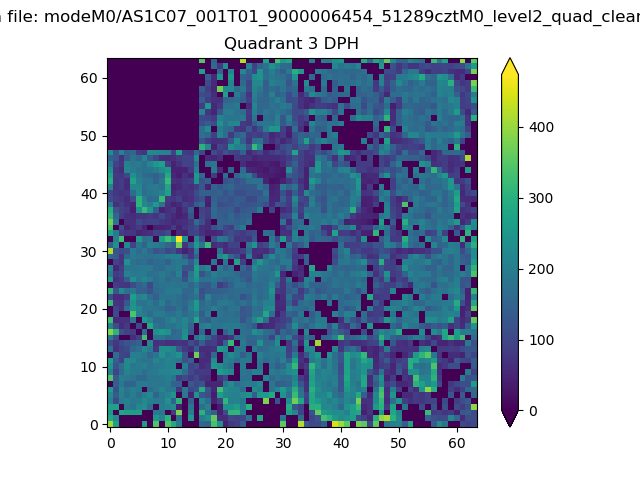 |
 |
Quadrant C |
| Plot type | Count rate plots | Images |
|---|---|---|
| Comparison with Poisson distribution Blue bars denote a histogram of data divided into 1 sec bins. Red curve is a Poisson curve with rate = median count rate of data. |
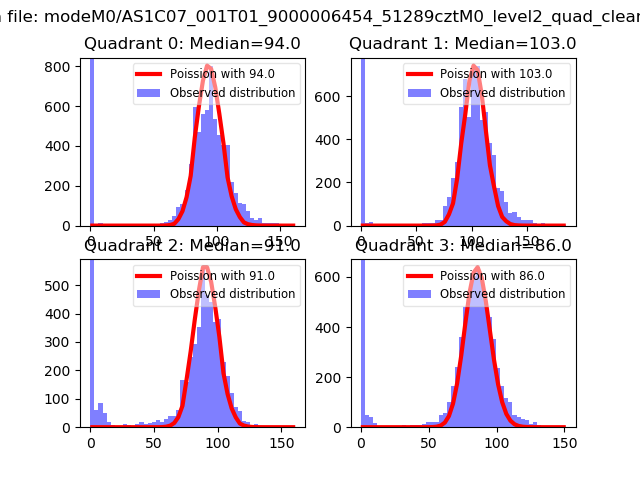 |
 |
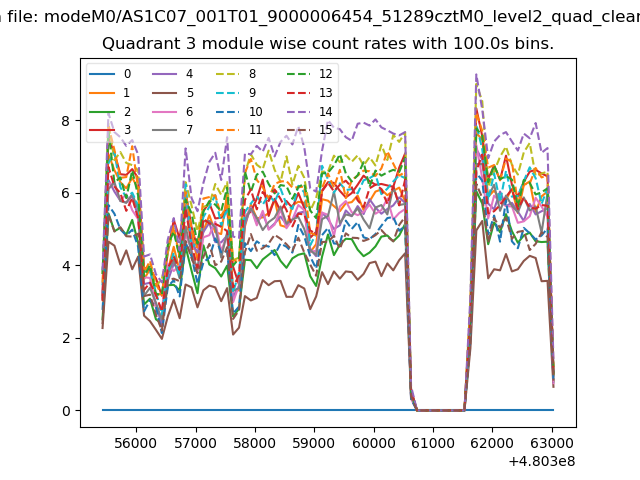
| Quadrant-wise count rates Data is divided into 100 sec bins |
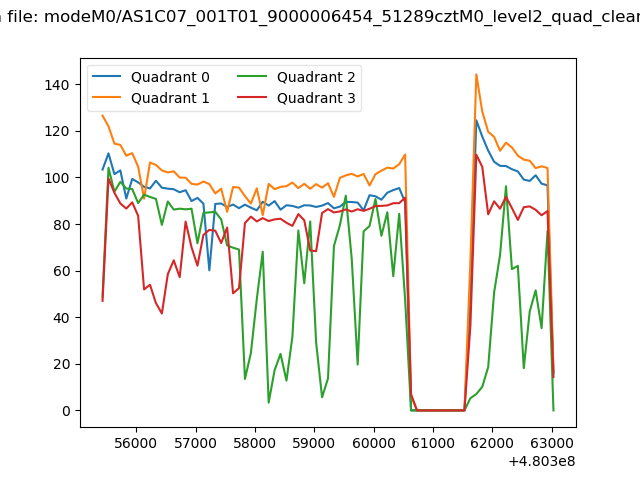 |
|
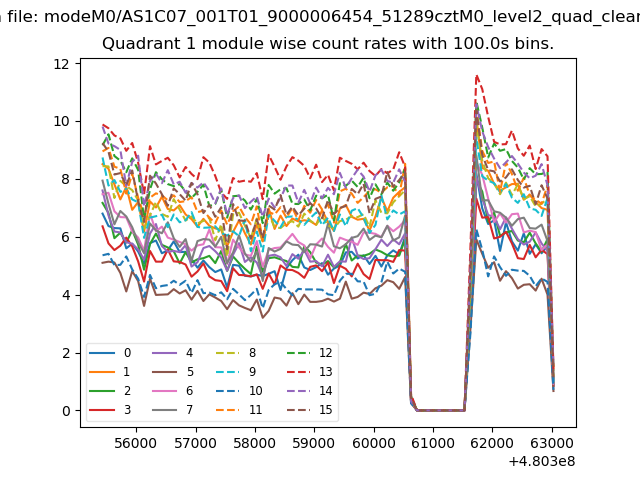
| Module-wise count rates for Quadrant A Data is divided into 100 sec bins |
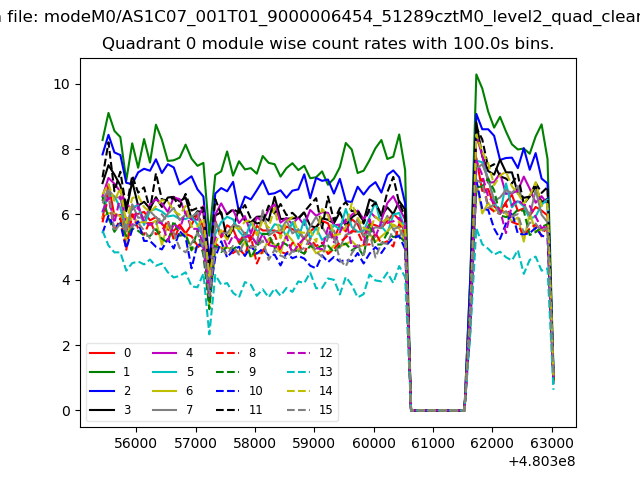 |
 |
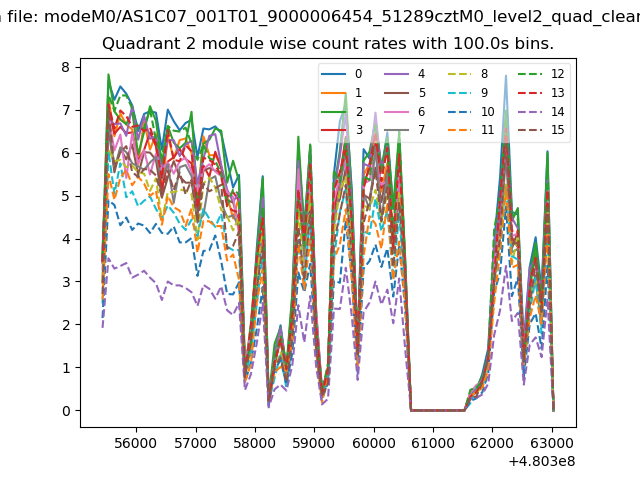
| Module-wise count rates for Quadrant B Data is divided into 100 sec bins |
 |
 |
| Module-wise count rates for Quadrant C Data is divided into 100 sec bins |
 |
 |
| Module-wise count rates for Quadrant D Data is divided into 100 sec bins |
 |
 |
| Parameter | Plot |
|---|---|
| CZT HV Monitor | 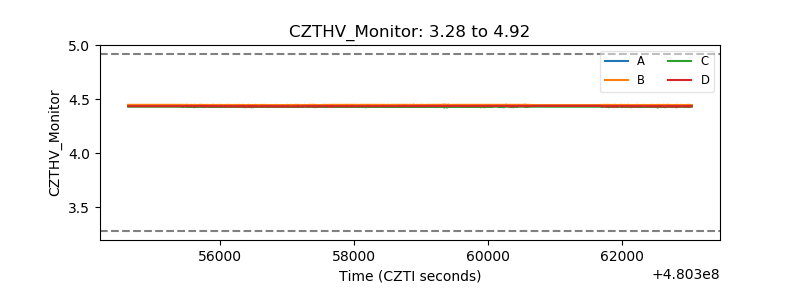 |
| D_VDD | 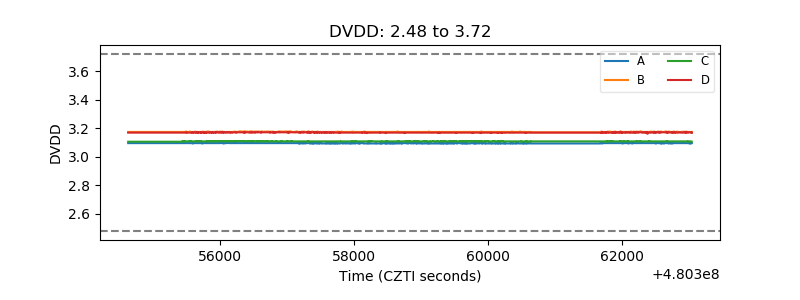 |
| Temperature 1 | 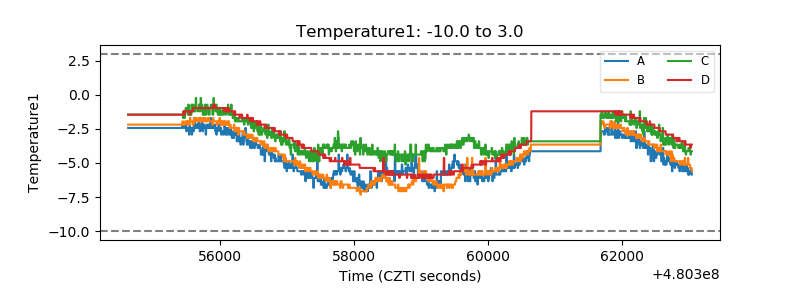 |
| Veto HV Monitor | 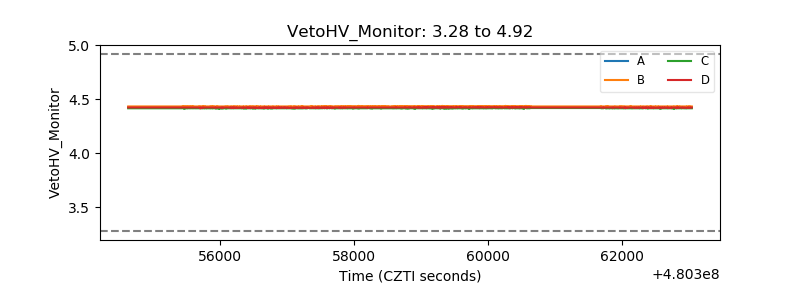 |
| Veto LLD | 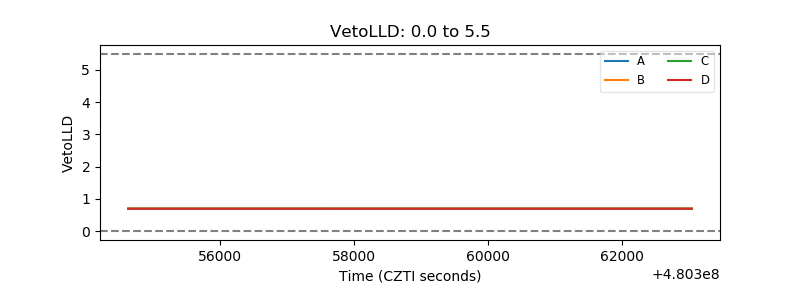 |
| Alpha Counter | 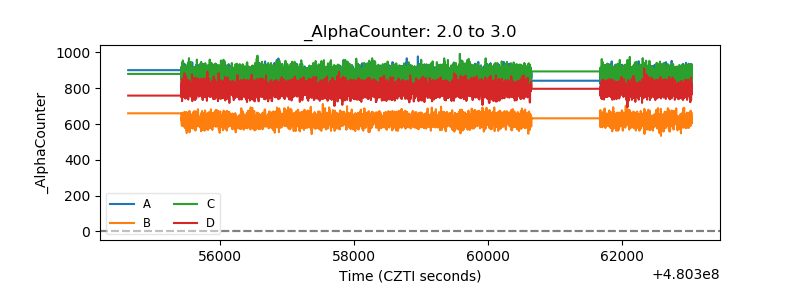 |
| _CPM_Rate | 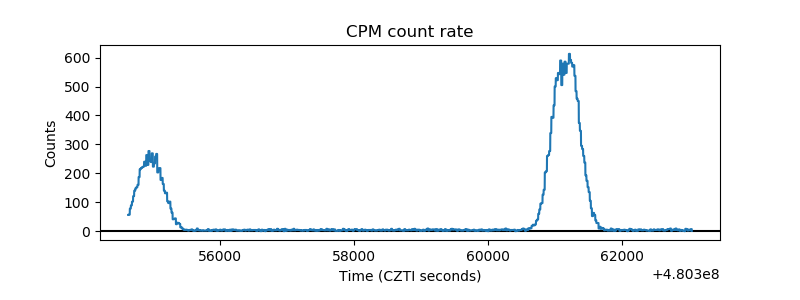 |
| CZT Counter | 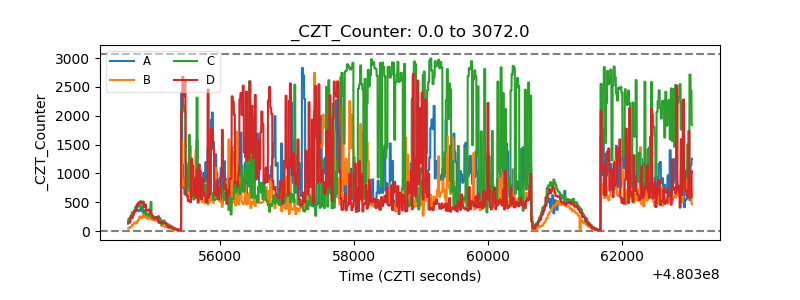 |
| +2.5 Volts monitor | 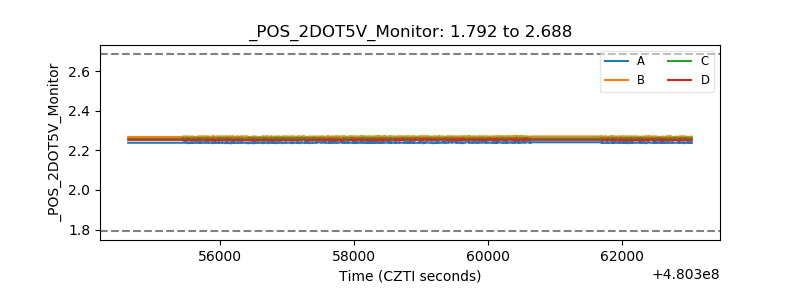 |
| +5 Volts monitor | 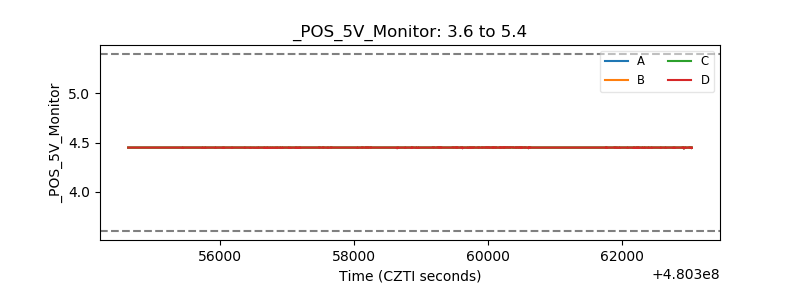 |
| _ROLL_ROT | 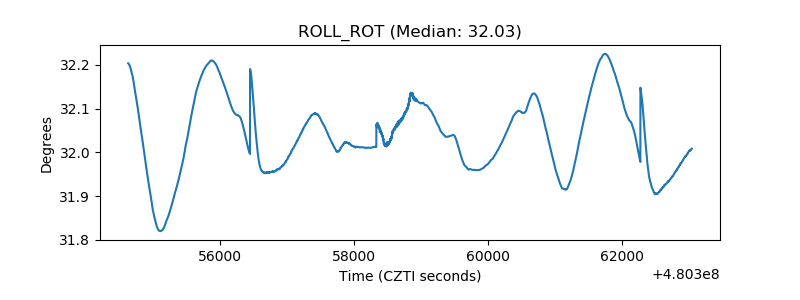 |
| _Roll_DEC | 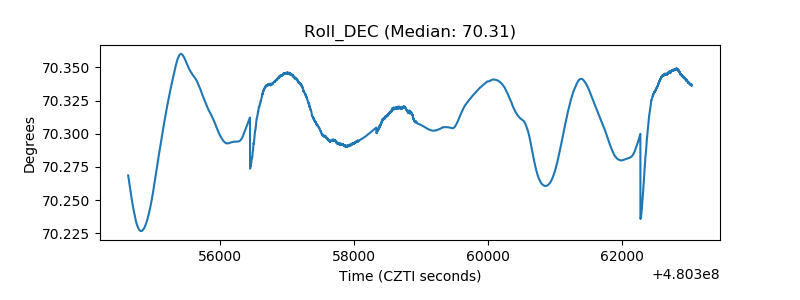 |
| _Roll_RA | 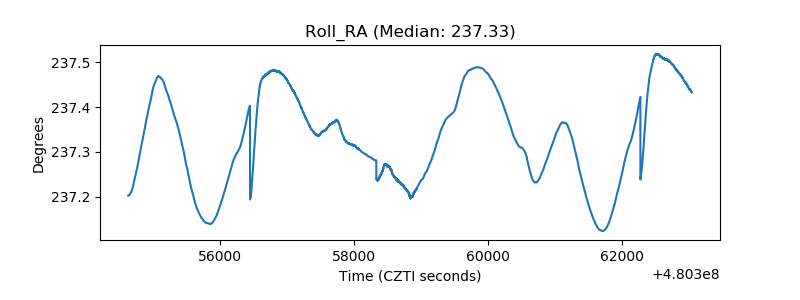 |
| Veto Counter | 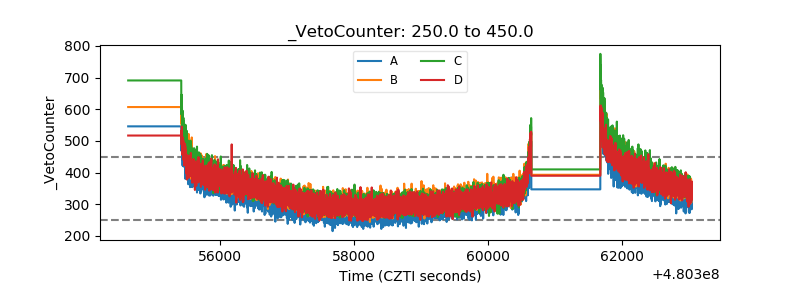 |