| Param | Original file | Final file |
|---|---|---|
| Filename | modeM0/AS1C07_001T01_9000006454_51290cztM0_level2.fits | modeM0/AS1C07_001T01_9000006454_51290cztM0_level2_quad_clean.evt |
| Size (bytes) | 821,027,520 | 84,568,320 |
| Size | 783.0 MB | 80.7 MB |
| Events in quadrant A | 5,595,740 | 617,690 |
| Events in quadrant B | 4,287,103 | 663,576 |
| Events in quadrant C | 12,193,615 | 331,369 |
| Events in quadrant D | 7,818,345 | 498,978 |
| Mode M0 | |||
|---|---|---|---|
| Quadrant | BADHDUFLAG | Total packets | Discarded packets |
| A | 0 | 21172 | 2 |
| B | 0 | 17174 | 2 |
| C | 0 | 40690 | 2 |
| D | 0 | 27766 | 2 |
| Mode SS | |||
|---|---|---|---|
| Quadrant | BADHDUFLAG | Total packets | Discarded packets |
| A | 0 | 130 | 0 |
| B | 0 | 130 | 0 |
| C | 0 | 130 | 0 |
| D | 0 | 130 | 0 |
| Mode M9 | |||
|---|---|---|---|
| Quadrant | BADHDUFLAG | Total packets | Discarded packets |
| A | 0 | 19 | 0 |
| B | 0 | 20 | 0 |
| C | 0 | 20 | 0 |
| D | 0 | 20 | 0 |
| Quadrant | Total seconds | Saturated seconds | Saturation percentage |
|---|---|---|---|
| A | 6435 | 213 | 3.310023% |
| B | 6435 | 335 | 5.205905% |
| C | 6435 | 3395 | 52.758353% |
| D | 6435 | 1072 | 16.658897% |
Noise dominated data is calculated using 1-second bins in cleaned event files. If a bin has >2000 counts, and if more than 50% of those come from <1% of pixels, then it is considered to be noise-dominated and hence unusable.
| Quadrant | # 1 sec bins | Bins with >0 counts | Bins with >2000 counts | High rate bins dominated by noise | Noise dominated (total time) | Noise dominated (detector-on time) | Marked lightcurve |
|---|---|---|---|---|---|---|---|
| A | 7540 | 6436 | 81 | 81 | 1.07% | 1.26% | 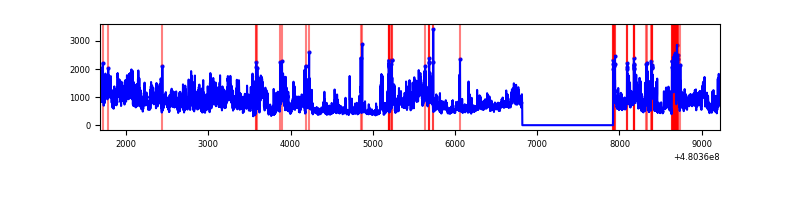 |
| B | 7540 | 6436 | 205 | 205 | 2.72% | 3.19% | 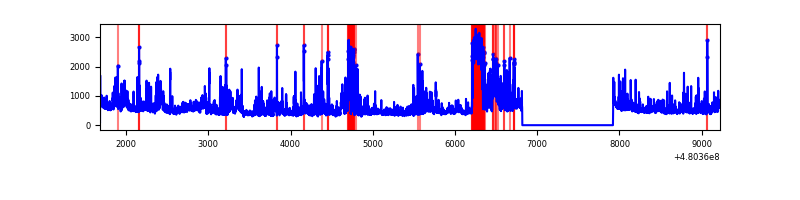 |
| C | 7540 | 6436 | 3194 | 3194 | 42.36% | 49.63% | 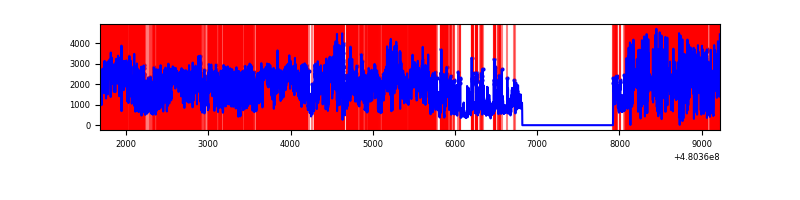 |
| D | 7540 | 6436 | 941 | 941 | 12.48% | 14.62% | 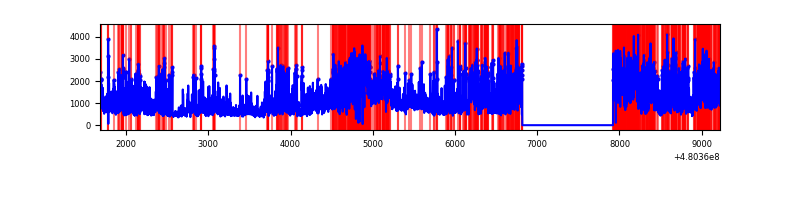 |
Top three noisy pixels from each quadrant. If the there are fewer than three noisy pixels in the level2.evt file, extra rows are filled as -1
| Pixel properties | Quadrant properties | ||||||
|---|---|---|---|---|---|---|---|
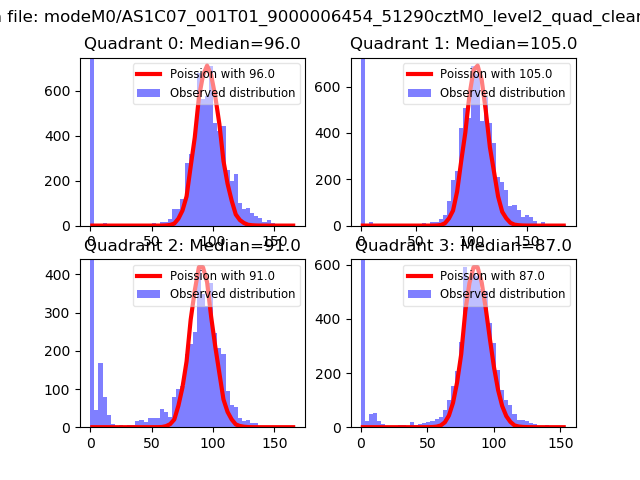
| Quadrant | DetID | PixID | Counts | Sigma | Mean | Median | Sigma |
| A | 12 | 3 | 2010737 | 11685.59 | 690 | 673 | 172.0 |
| A | 12 | 194 | 238327 | 1381.61 | 690 | 673 | 172.0 |
| A | 9 | 191 | 221371 | 1283.04 | 690 | 673 | 172.0 |
| B | 5 | 172 | 671013 | 4627.29 | 686 | 663 | 144.9 |
| B | 4 | 170 | 323767 | 2230.32 | 686 | 663 | 144.9 |
| B | 5 | 185 | 223321 | 1536.96 | 686 | 663 | 144.9 |
| C | 4 | 12 | 6349780 | 44672.43 | 515 | 511 | 142.1 |
| C | 10 | 171 | 3381388 | 23787.3 | 515 | 511 | 142.1 |
| C | 12 | 252 | 125823 | 881.67 | 515 | 511 | 142.1 |
| D | 12 | 2 | 2114330 | 11996.46 | 625 | 602 | 176.2 |
| D | 8 | 176 | 1544989 | 8765.16 | 625 | 602 | 176.2 |
| D | 2 | 216 | 328677 | 1861.99 | 625 | 602 | 176.2 |
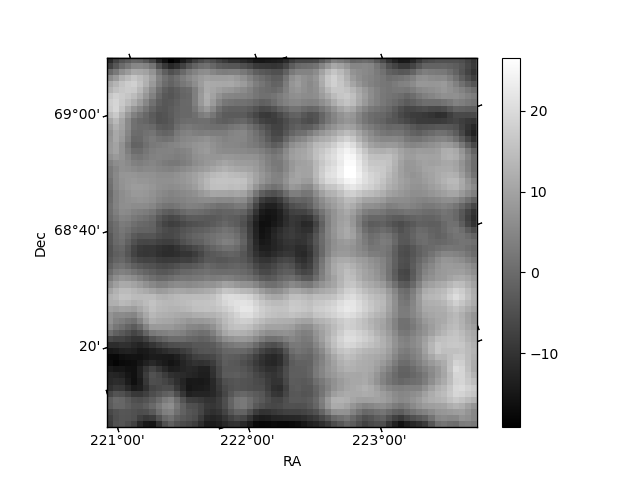
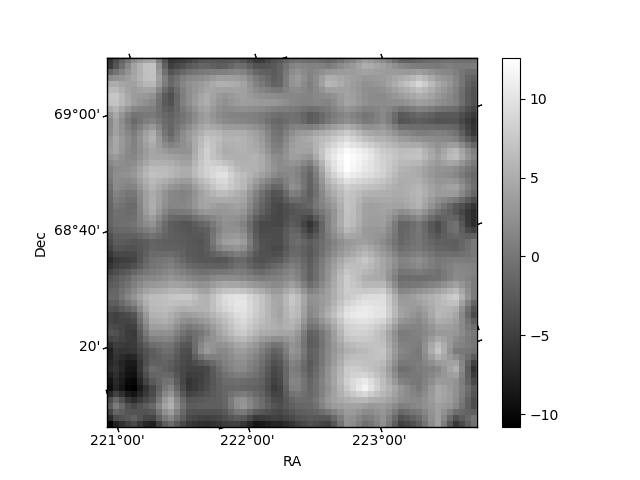
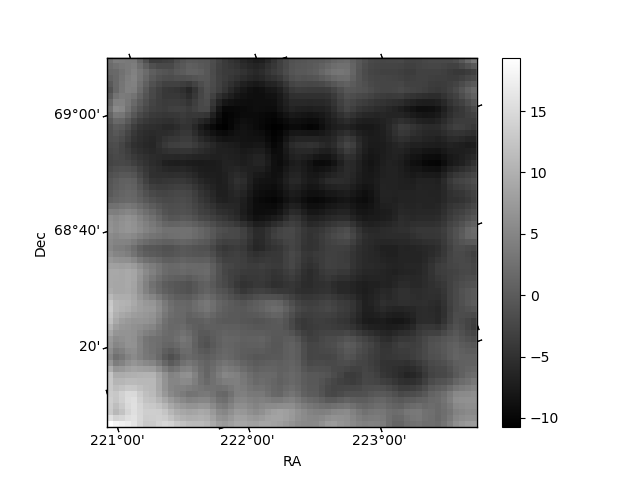
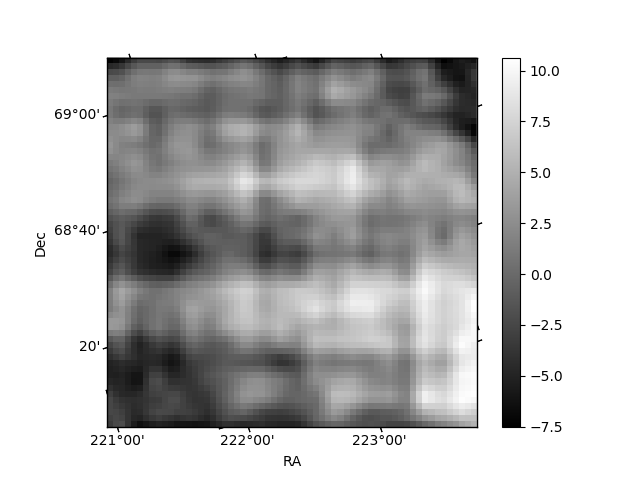
Histogram calculated using DETX and DETY for each event in the final _common_clean file
| Quadrant A | 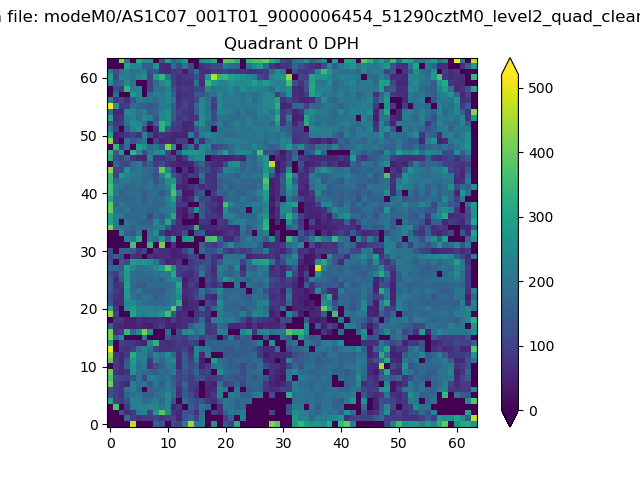 |
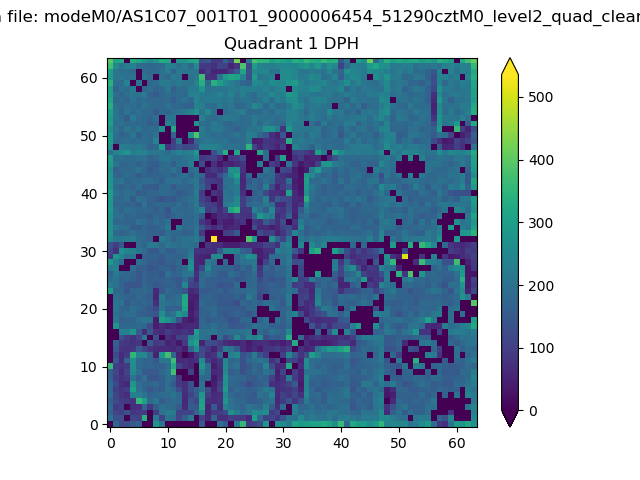 |
Quadrant B |
|---|---|---|---|
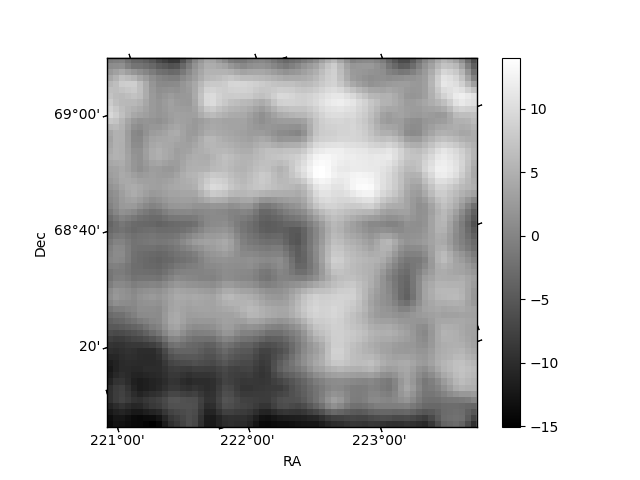
| Quadrant D | 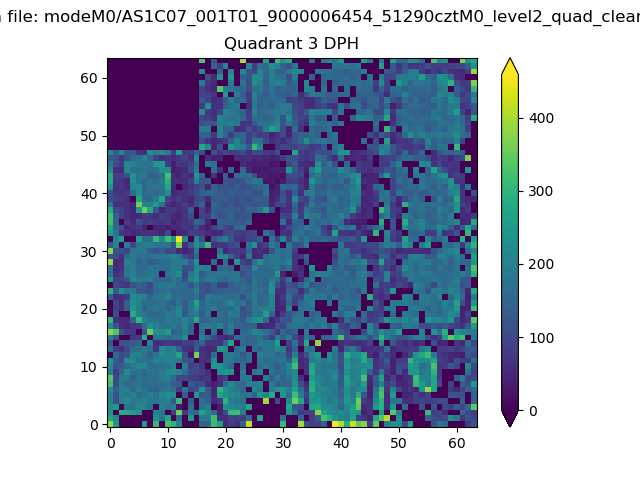 |
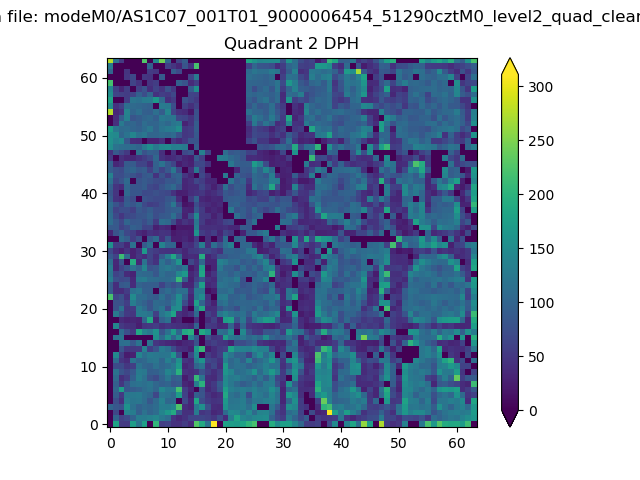 |
Quadrant C |
| Plot type | Count rate plots | Images |
|---|---|---|
| Comparison with Poisson distribution Blue bars denote a histogram of data divided into 1 sec bins. Red curve is a Poisson curve with rate = median count rate of data. |
 |
 |
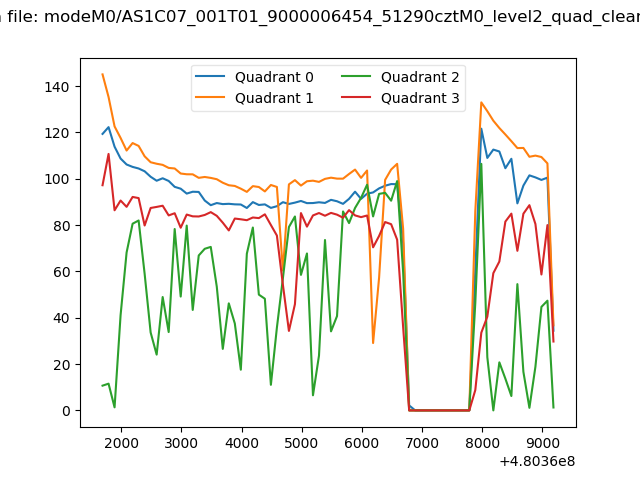
| Quadrant-wise count rates Data is divided into 100 sec bins |
 |
|
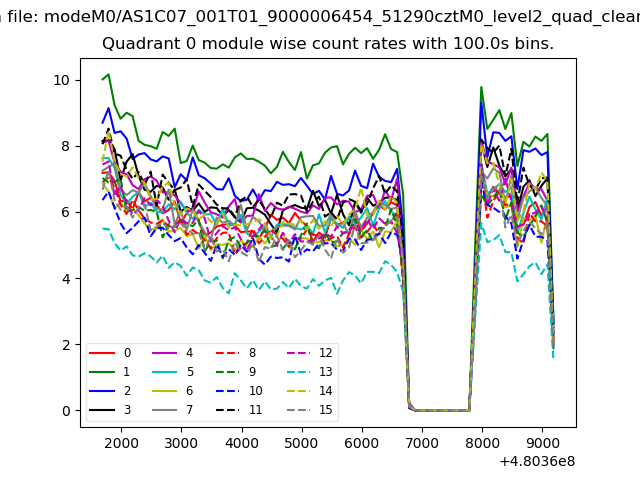
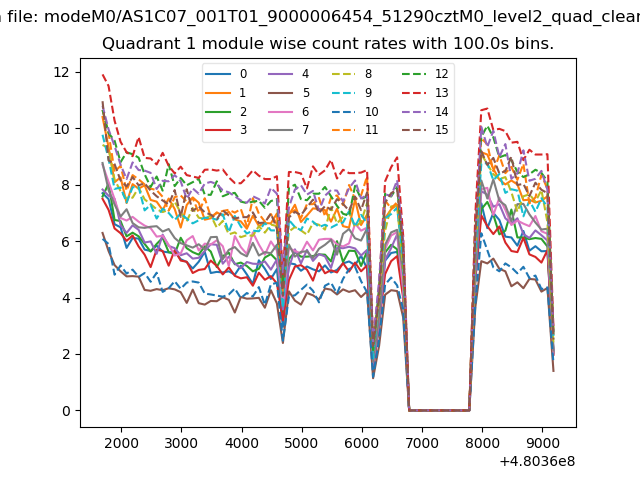
| Module-wise count rates for Quadrant A Data is divided into 100 sec bins |
 |
 |
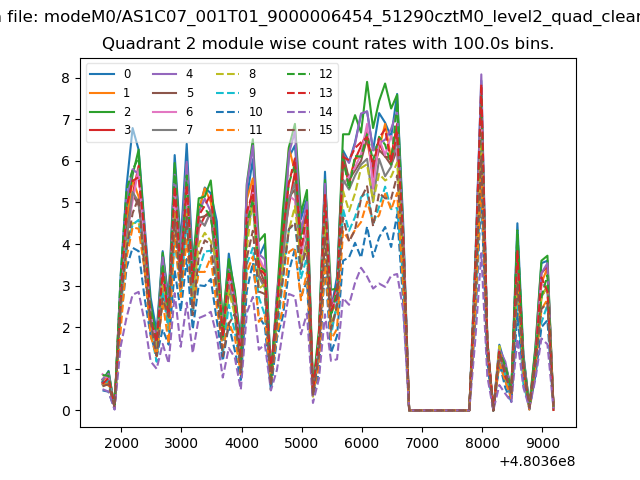
| Module-wise count rates for Quadrant B Data is divided into 100 sec bins |
 |
 |
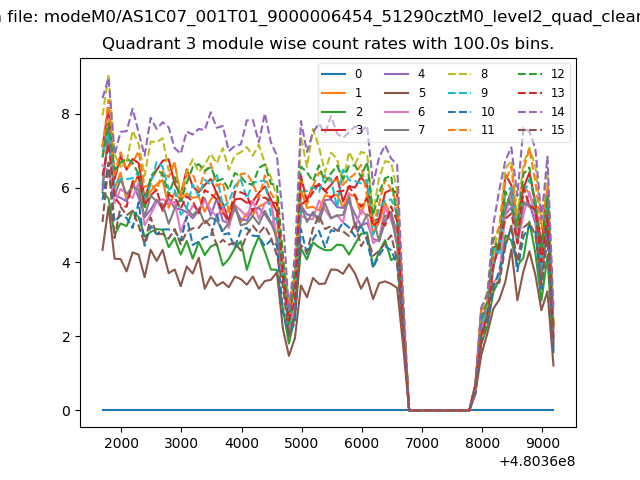
| Module-wise count rates for Quadrant C Data is divided into 100 sec bins |
 |
 |
| Module-wise count rates for Quadrant D Data is divided into 100 sec bins |
 |
 |
| Parameter | Plot |
|---|---|
| CZT HV Monitor | 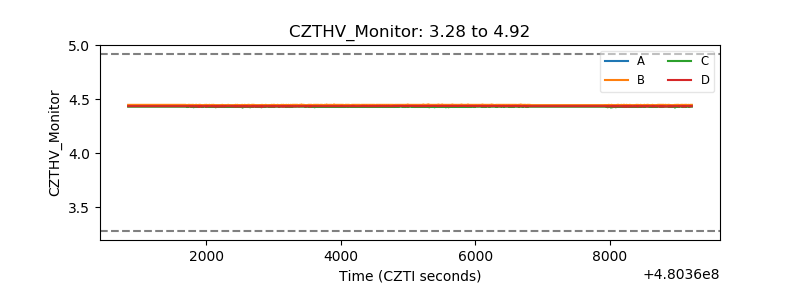 |
| D_VDD | 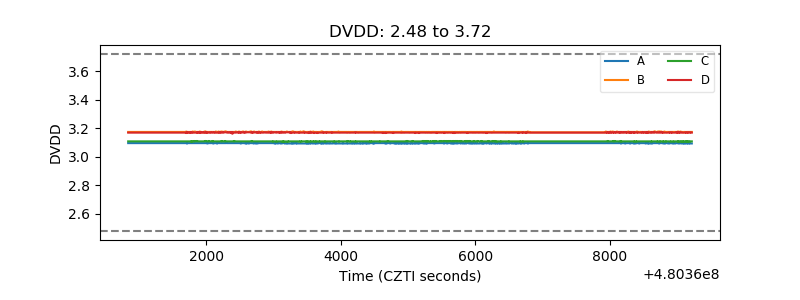 |
| Temperature 1 | 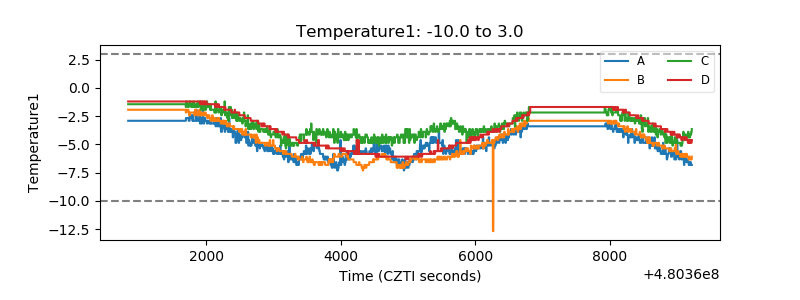 |
| Veto HV Monitor | 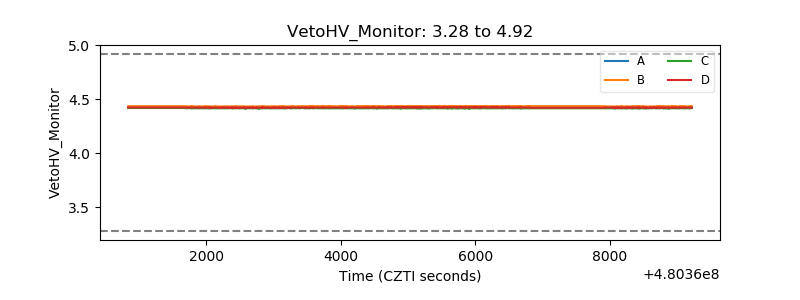 |
| Veto LLD | 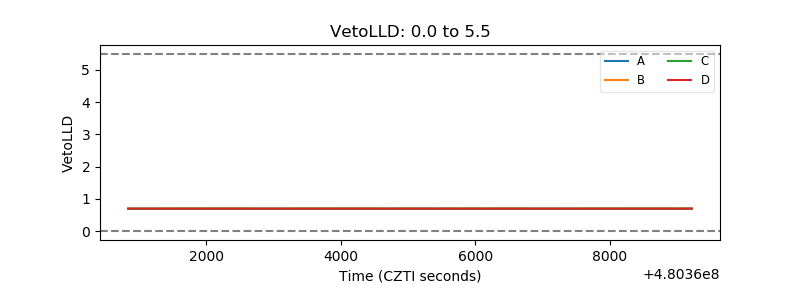 |
| Alpha Counter | 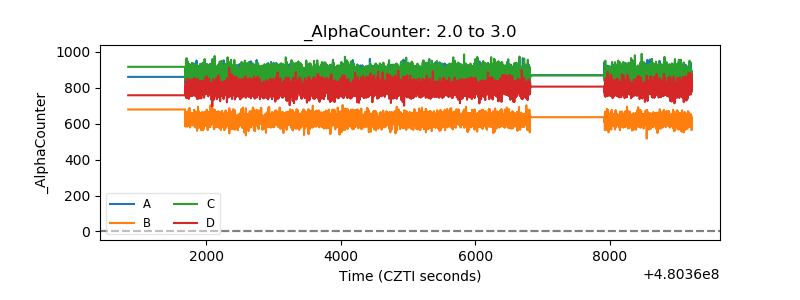 |
| _CPM_Rate | 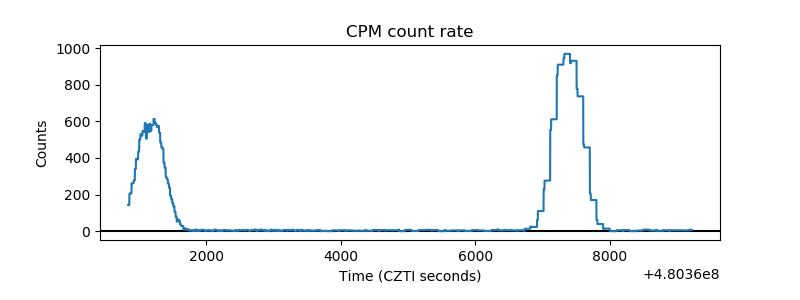 |
| CZT Counter | 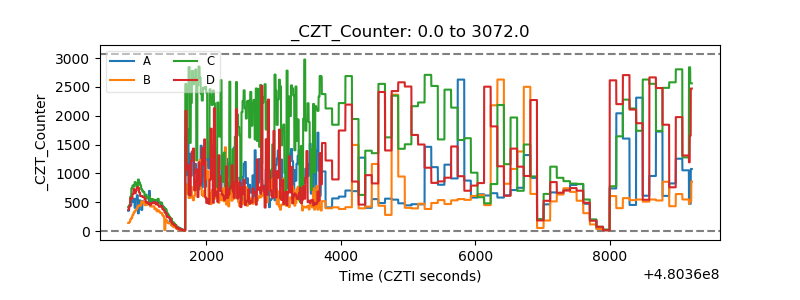 |
| +2.5 Volts monitor | 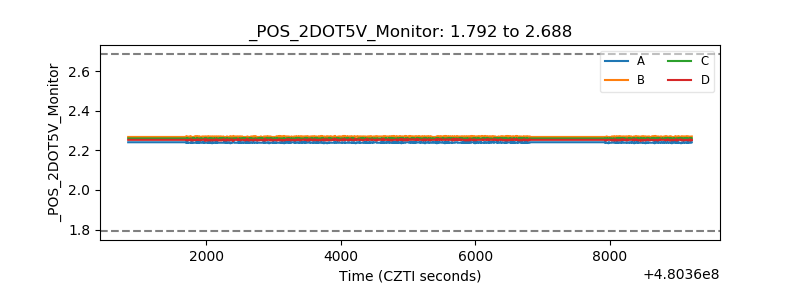 |
| +5 Volts monitor | 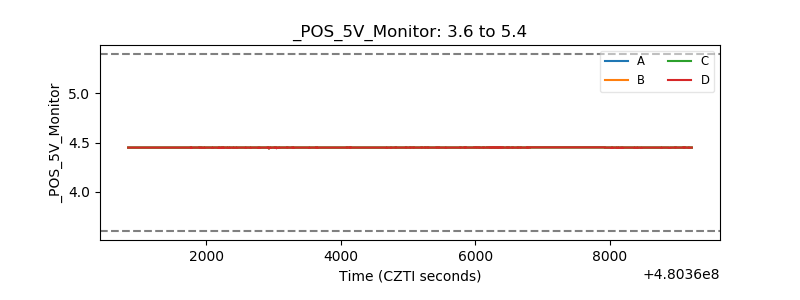 |
| _ROLL_ROT | 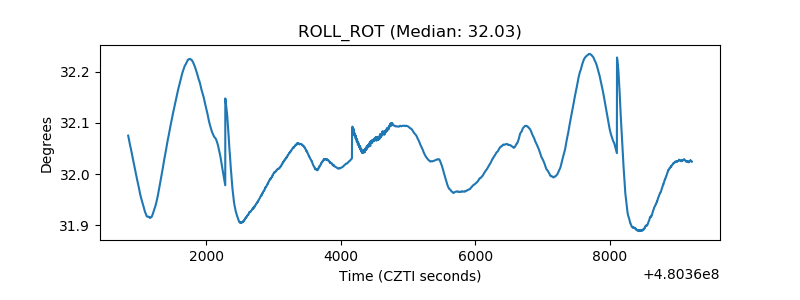 |
| _Roll_DEC | 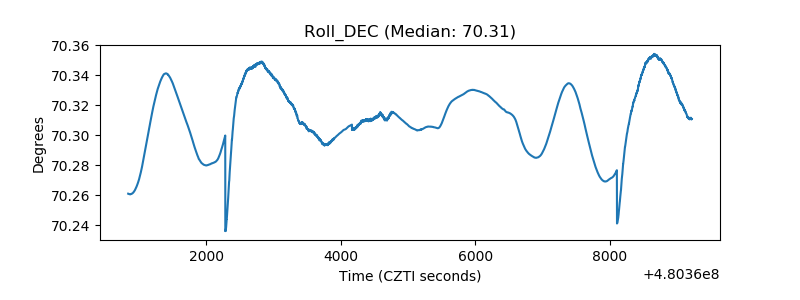 |
| _Roll_RA | 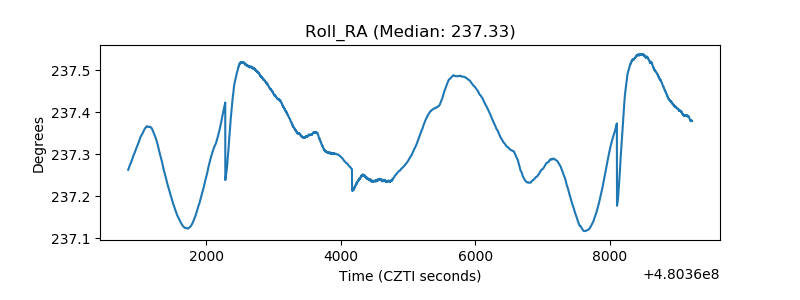 |
| Veto Counter | 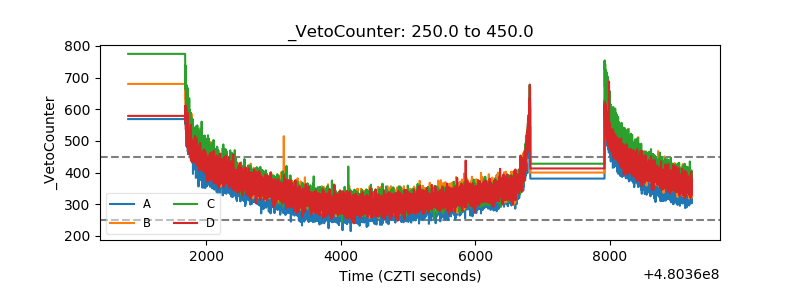 |