| Param | Original file | Final file |
|---|---|---|
| Filename | modeM0/AS1C07_001T01_9000006454_51291cztM0_level2.fits | modeM0/AS1C07_001T01_9000006454_51291cztM0_level2_quad_clean.evt |
| Size (bytes) | 883,854,720 | 83,263,680 |
| Size | 842.9 MB | 79.4 MB |
| Events in quadrant A | 5,157,262 | 633,758 |
| Events in quadrant B | 4,154,540 | 700,247 |
| Events in quadrant C | 10,568,447 | 386,443 |
| Events in quadrant D | 12,338,698 | 350,190 |
| Mode M0 | |||
|---|---|---|---|
| Quadrant | BADHDUFLAG | Total packets | Discarded packets |
| A | 0 | 19847 | 2 |
| B | 0 | 16801 | 2 |
| C | 0 | 35805 | 2 |
| D | 0 | 41158 | 2 |
| Mode SS | |||
|---|---|---|---|
| Quadrant | BADHDUFLAG | Total packets | Discarded packets |
| A | 0 | 132 | 0 |
| B | 0 | 132 | 0 |
| C | 0 | 132 | 0 |
| D | 0 | 132 | 0 |
| Mode M9 | |||
|---|---|---|---|
| Quadrant | BADHDUFLAG | Total packets | Discarded packets |
| A | 0 | 23 | 0 |
| B | 0 | 23 | 0 |
| C | 0 | 23 | 0 |
| D | 0 | 23 | 0 |
| Quadrant | Total seconds | Saturated seconds | Saturation percentage |
|---|---|---|---|
| A | 6456 | 206 | 3.190830% |
| B | 6456 | 213 | 3.299257% |
| C | 6456 | 2866 | 44.392813% |
| D | 6457 | 3063 | 47.436890% |
Noise dominated data is calculated using 1-second bins in cleaned event files. If a bin has >2000 counts, and if more than 50% of those come from <1% of pixels, then it is considered to be noise-dominated and hence unusable.
| Quadrant | # 1 sec bins | Bins with >0 counts | Bins with >2000 counts | High rate bins dominated by noise | Noise dominated (total time) | Noise dominated (detector-on time) | Marked lightcurve |
|---|---|---|---|---|---|---|---|
| A | 8761 | 6458 | 89 | 89 | 1.02% | 1.38% | 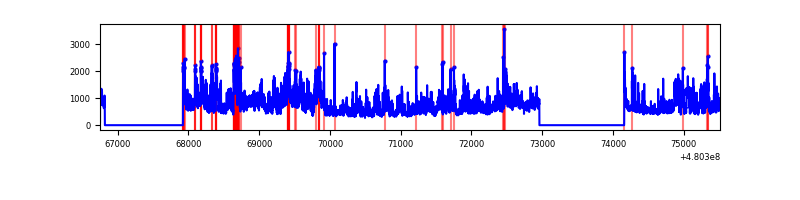 |
| B | 8761 | 6458 | 75 | 75 | 0.86% | 1.16% | 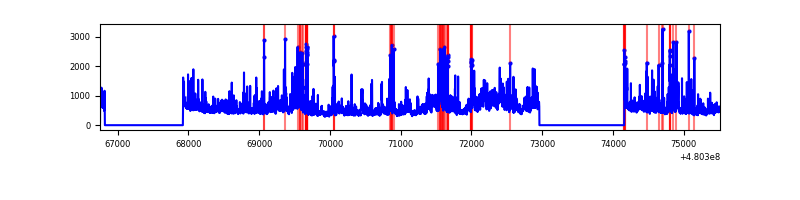 |
| C | 8761 | 6458 | 2395 | 2395 | 27.34% | 37.09% | 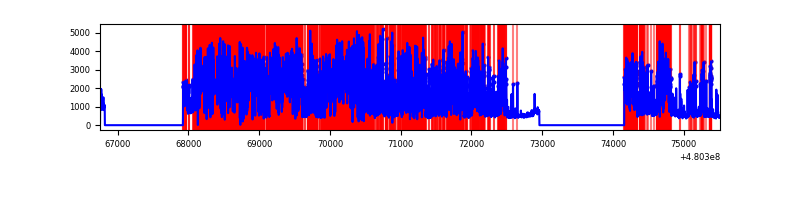 |
| D | 8762 | 6459 | 3243 | 3243 | 37.01% | 50.21% | 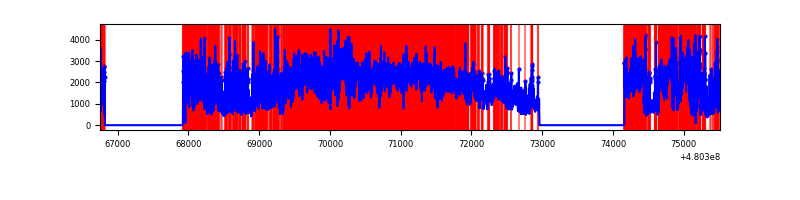 |
Top three noisy pixels from each quadrant. If the there are fewer than three noisy pixels in the level2.evt file, extra rows are filled as -1
| Pixel properties | Quadrant properties | ||||||
|---|---|---|---|---|---|---|---|
| Quadrant | DetID | PixID | Counts | Sigma | Mean | Median | Sigma |
| A | 12 | 3 | 1516430 | 8806.49 | 695 | 678 | 172.1 |
| A | 9 | 191 | 357754 | 2074.6 | 695 | 678 | 172.1 |
| A | 12 | 194 | 186362 | 1078.82 | 695 | 678 | 172.1 |
| B | 10 | 254 | 516954 | 3479.9 | 701 | 678 | 148.4 |
| B | 5 | 185 | 214021 | 1438.01 | 701 | 678 | 148.4 |
| B | 6 | 36 | 141672 | 950.35 | 701 | 678 | 148.4 |
| C | 4 | 12 | 7358366 | 50834.73 | 521 | 517 | 144.7 |
| C | 10 | 171 | 318227 | 2195.03 | 521 | 517 | 144.7 |
| C | 3 | 233 | 231272 | 1594.27 | 521 | 517 | 144.7 |
| D | 8 | 176 | 5113474 | 32154.96 | 564 | 544 | 159.0 |
| D | 12 | 2 | 2616060 | 16448.85 | 564 | 544 | 159.0 |
| D | 3 | 12 | 1658092 | 10424.24 | 564 | 544 | 159.0 |
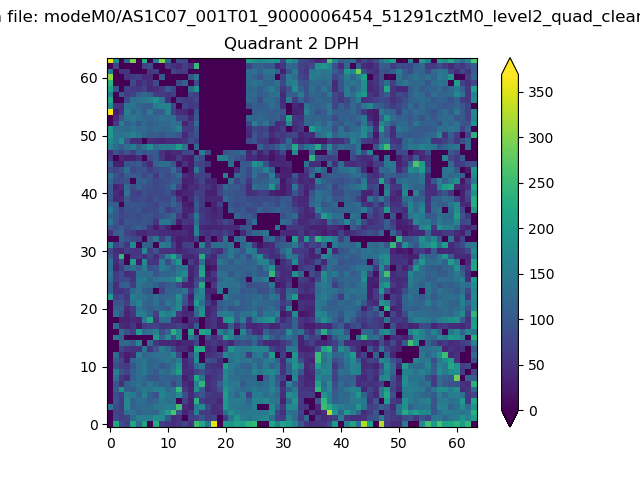
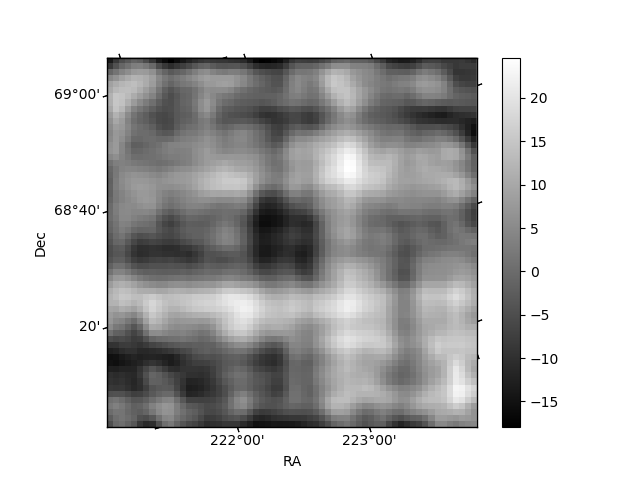
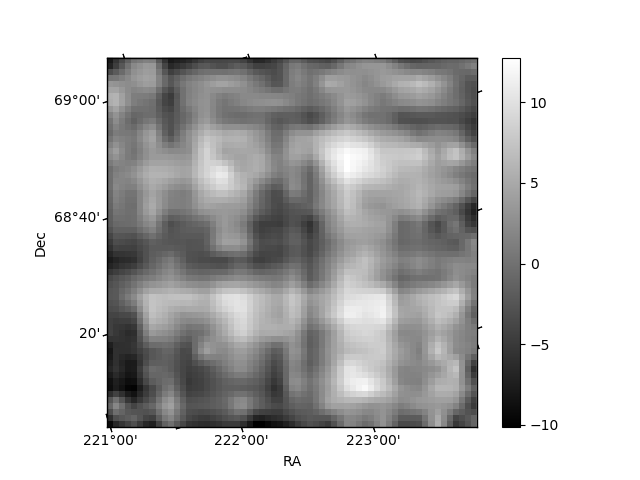
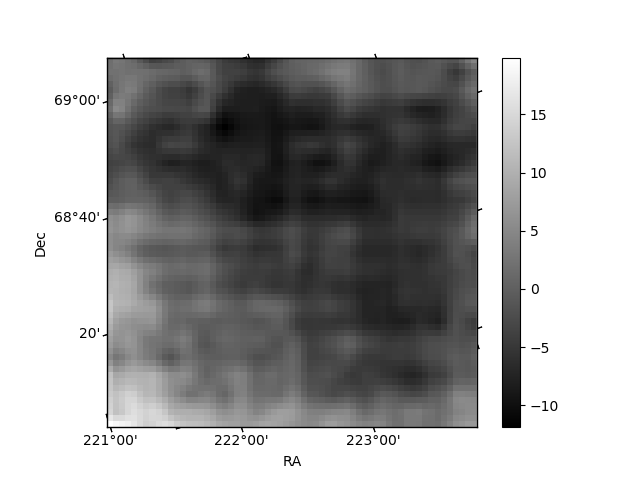
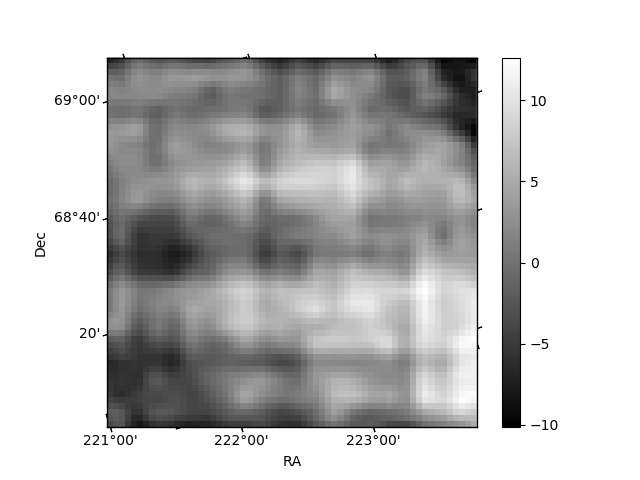
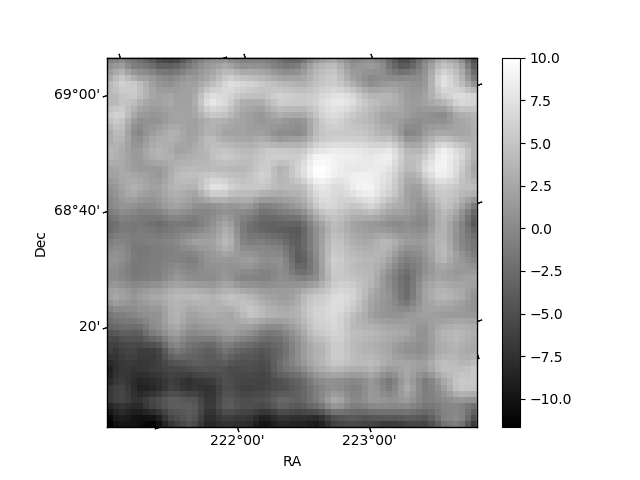
Histogram calculated using DETX and DETY for each event in the final _common_clean file
| Quadrant A | 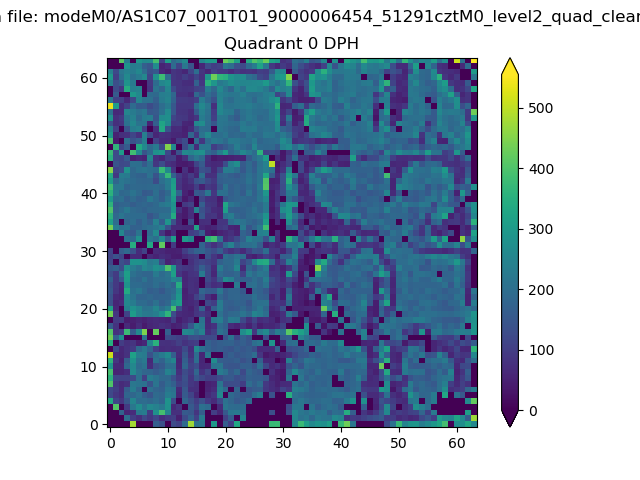 |
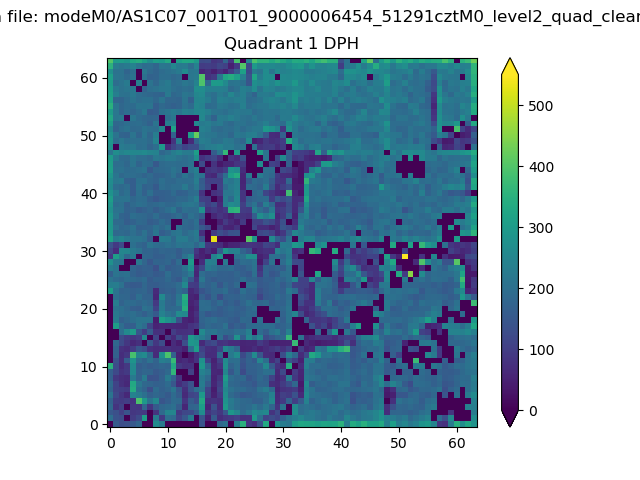 |
Quadrant B |
|---|---|---|---|
| Quadrant D | 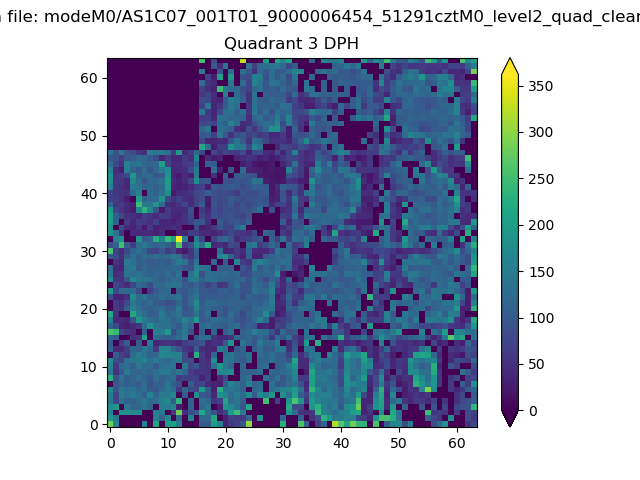 |
 |
Quadrant C |
| Plot type | Count rate plots | Images |
|---|---|---|
| Comparison with Poisson distribution Blue bars denote a histogram of data divided into 1 sec bins. Red curve is a Poisson curve with rate = median count rate of data. |
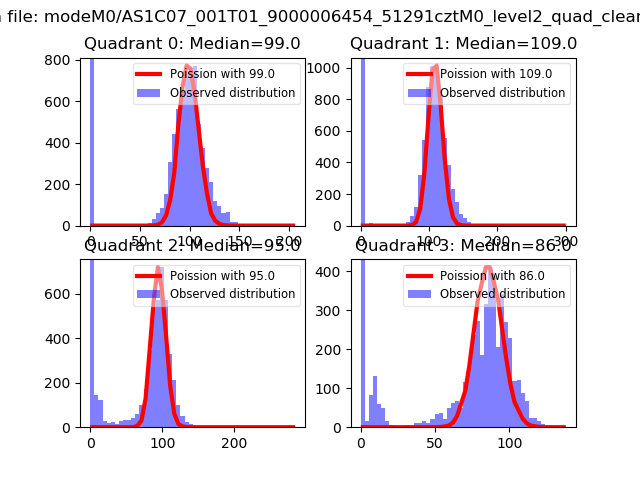 |
 |
| Quadrant-wise count rates Data is divided into 100 sec bins |
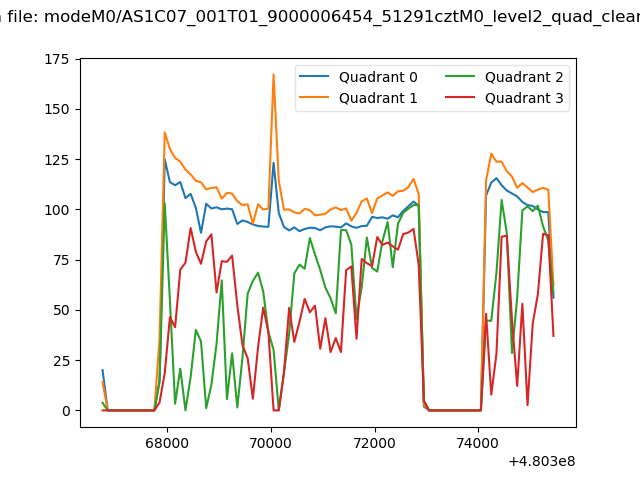 |
|
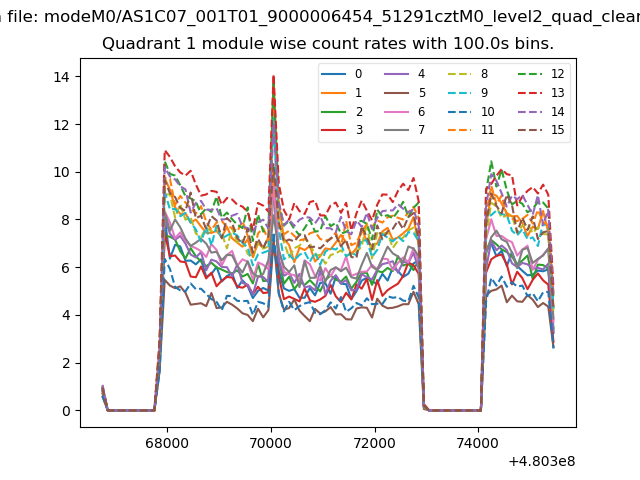
| Module-wise count rates for Quadrant A Data is divided into 100 sec bins |
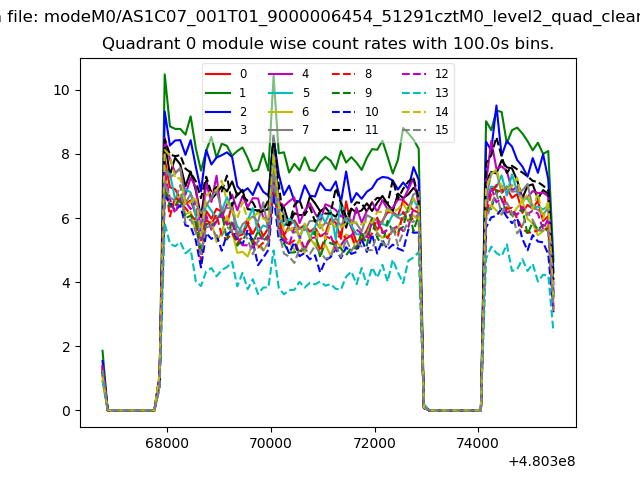 |
 |
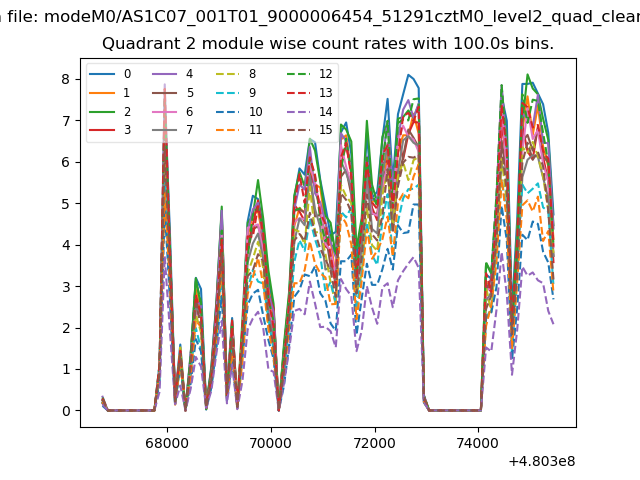
| Module-wise count rates for Quadrant B Data is divided into 100 sec bins |
 |
 |
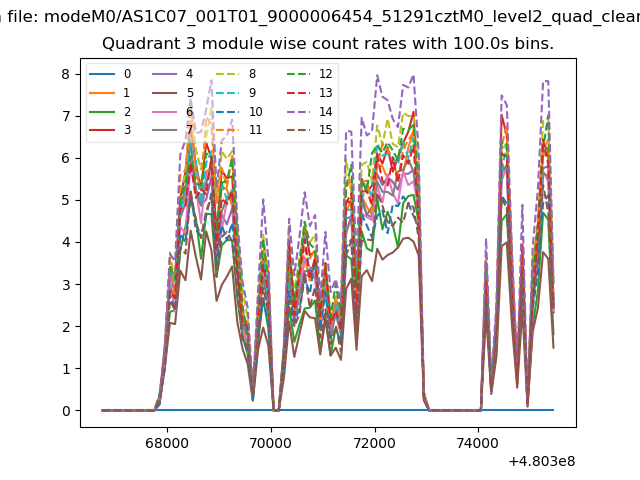
| Module-wise count rates for Quadrant C Data is divided into 100 sec bins |
 |
 |
| Module-wise count rates for Quadrant D Data is divided into 100 sec bins |
 |
 |
| Parameter | Plot |
|---|---|
| CZT HV Monitor | 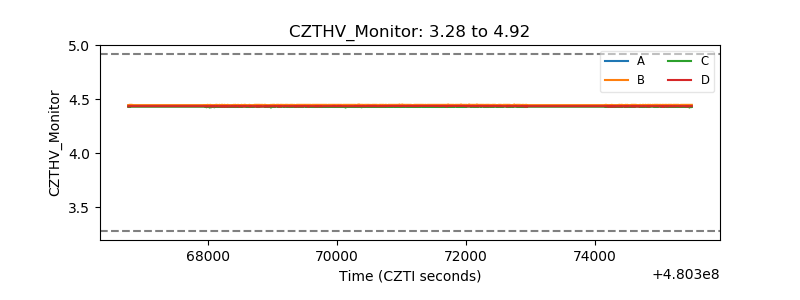 |
| D_VDD | 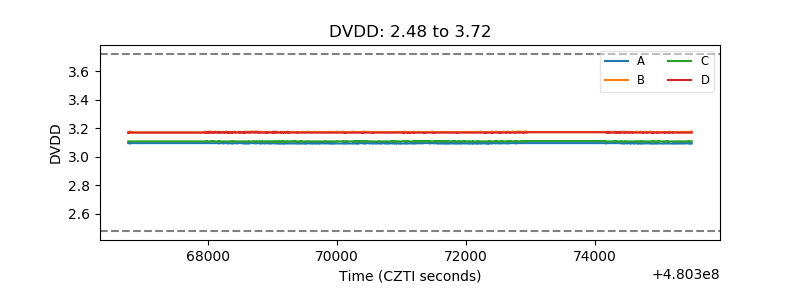 |
| Temperature 1 | 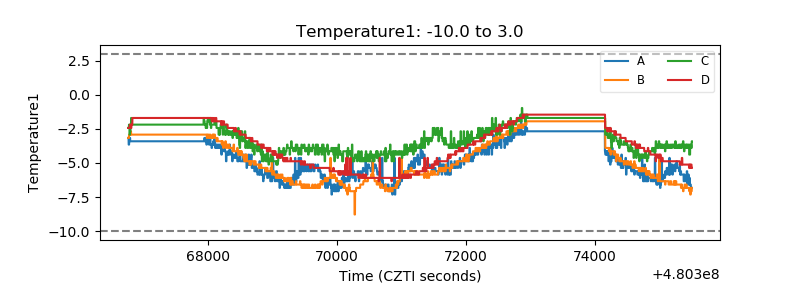 |
| Veto HV Monitor | 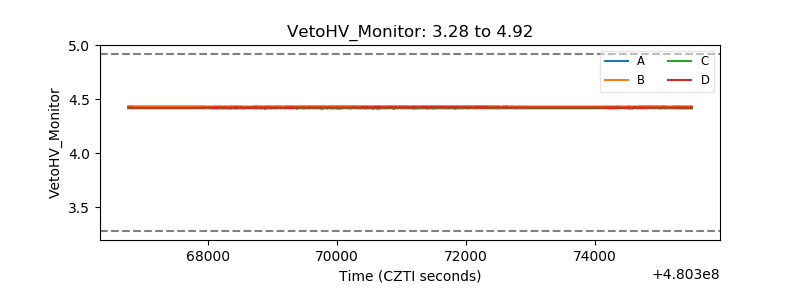 |
| Veto LLD | 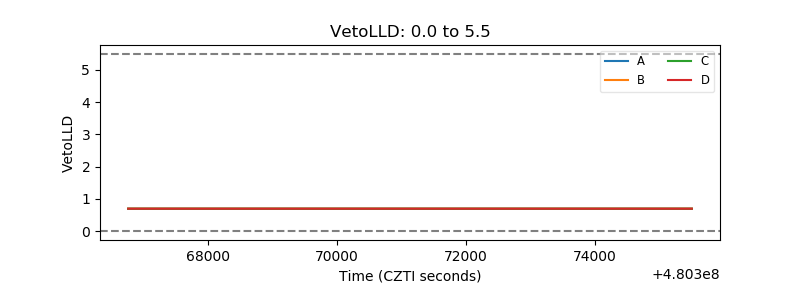 |
| Alpha Counter | 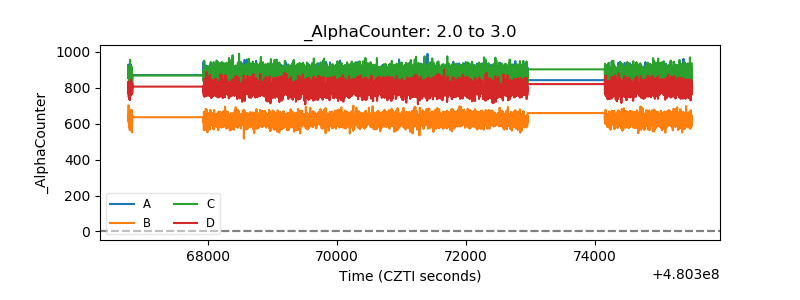 |
| _CPM_Rate | 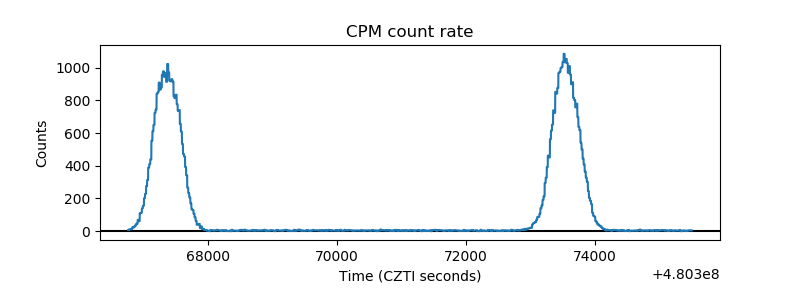 |
| CZT Counter | 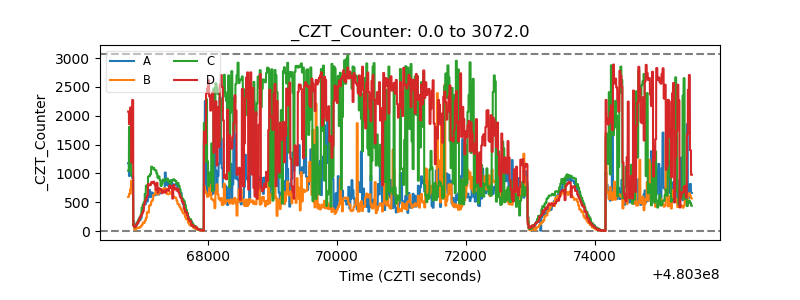 |
| +2.5 Volts monitor | 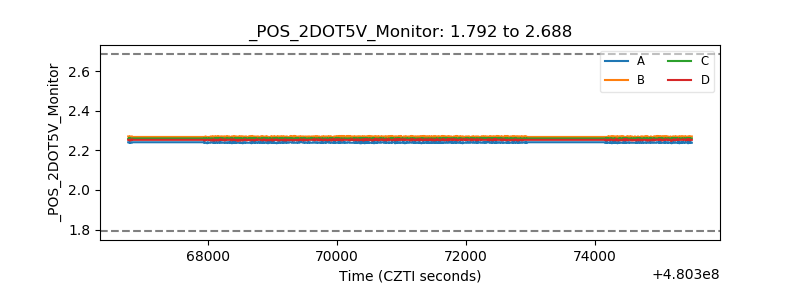 |
| +5 Volts monitor | 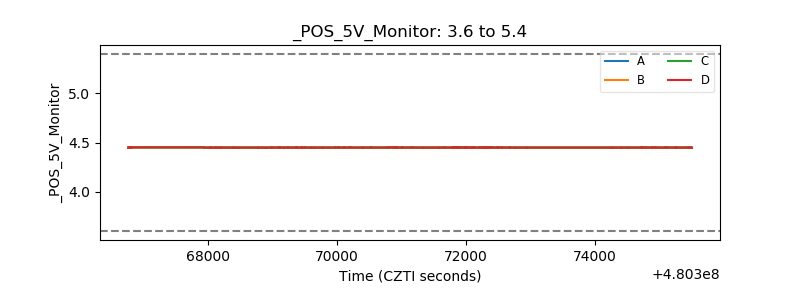 |
| _ROLL_ROT | 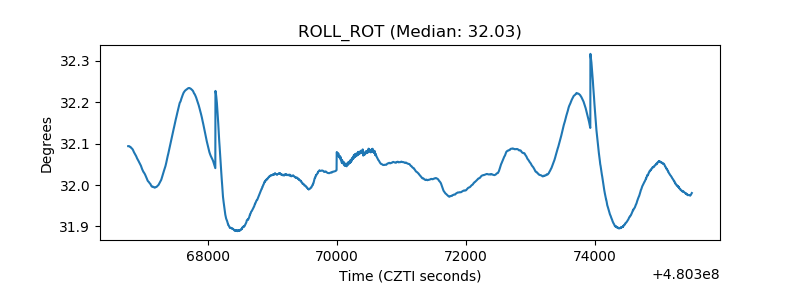 |
| _Roll_DEC | 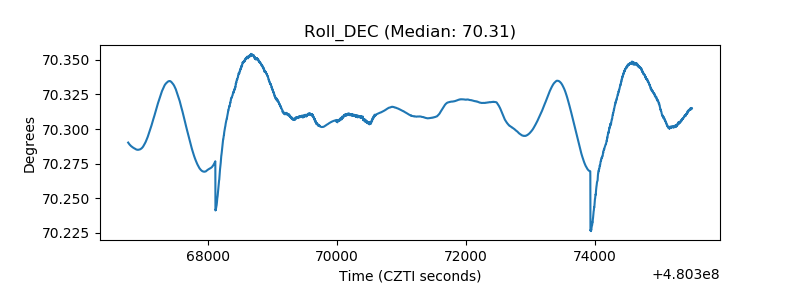 |
| _Roll_RA | 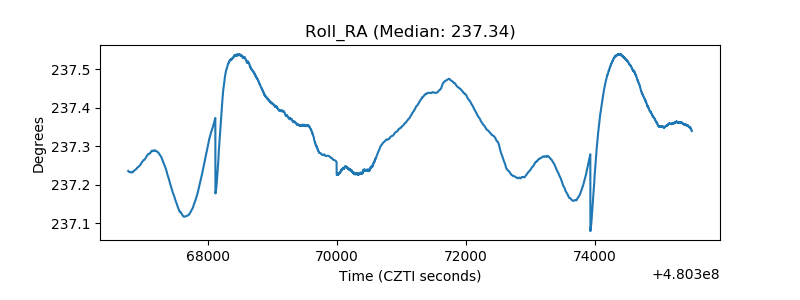 |
| Veto Counter | 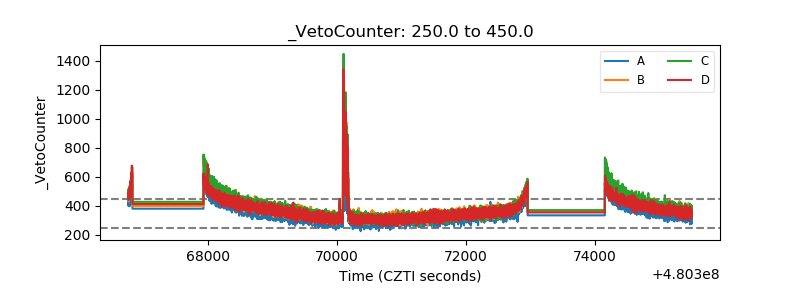 |