| Param | Original file | Final file |
|---|---|---|
| Filename | modeM0/AS1C07_001T01_9000006454_51293cztM0_level2.fits | modeM0/AS1C07_001T01_9000006454_51293cztM0_level2_quad_clean.evt |
| Size (bytes) | 818,193,600 | 88,715,520 |
| Size | 780.3 MB | 84.6 MB |
| Events in quadrant A | 6,440,694 | 579,402 |
| Events in quadrant B | 5,409,662 | 673,144 |
| Events in quadrant C | 8,528,592 | 467,635 |
| Events in quadrant D | 9,400,336 | 506,860 |
| Mode M0 | |||
|---|---|---|---|
| Quadrant | BADHDUFLAG | Total packets | Discarded packets |
| A | 0 | 23793 | 2 |
| B | 0 | 20639 | 2 |
| C | 0 | 30028 | 2 |
| D | 0 | 32501 | 2 |
| Mode SS | |||
|---|---|---|---|
| Quadrant | BADHDUFLAG | Total packets | Discarded packets |
| A | 0 | 136 | 0 |
| B | 0 | 136 | 0 |
| C | 0 | 136 | 0 |
| D | 0 | 134 | 0 |
| Mode M9 | |||
|---|---|---|---|
| Quadrant | BADHDUFLAG | Total packets | Discarded packets |
| A | 0 | 23 | 0 |
| B | 0 | 23 | 0 |
| C | 0 | 23 | 0 |
| D | 0 | 23 | 0 |
| Quadrant | Total seconds | Saturated seconds | Saturation percentage |
|---|---|---|---|
| A | 6582 | 640 | 9.723488% |
| B | 6583 | 389 | 5.909160% |
| C | 6583 | 1944 | 29.530609% |
| D | 6583 | 1172 | 17.803433% |
Noise dominated data is calculated using 1-second bins in cleaned event files. If a bin has >2000 counts, and if more than 50% of those come from <1% of pixels, then it is considered to be noise-dominated and hence unusable.
| Quadrant | # 1 sec bins | Bins with >0 counts | Bins with >2000 counts | High rate bins dominated by noise | Noise dominated (total time) | Noise dominated (detector-on time) | Marked lightcurve |
|---|---|---|---|---|---|---|---|
| A | 8827 | 6584 | 366 | 366 | 4.15% | 5.56% | 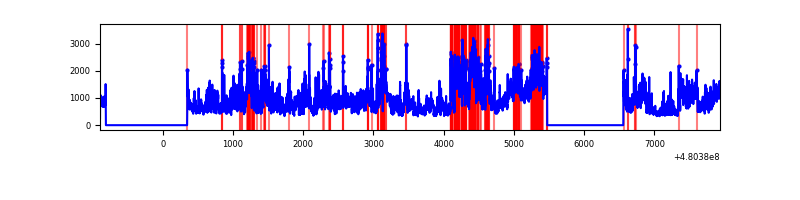 |
| B | 8828 | 6585 | 205 | 205 | 2.32% | 3.11% | 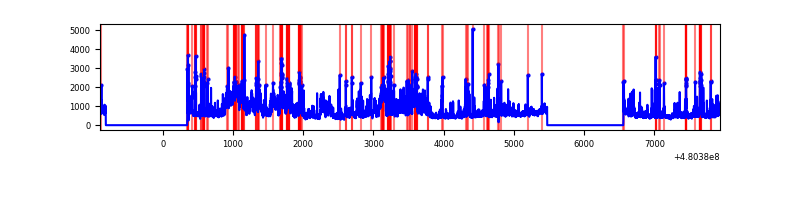 |
| C | 8828 | 6585 | 1704 | 1704 | 19.30% | 25.88% | 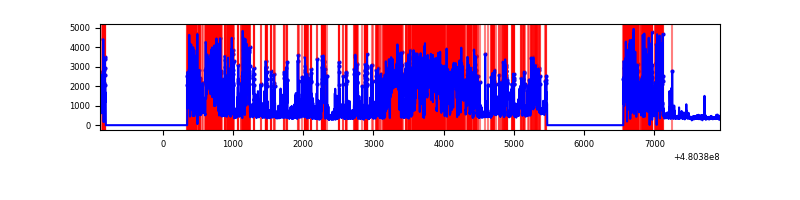 |
| D | 8828 | 6585 | 1574 | 1574 | 17.83% | 23.90% | 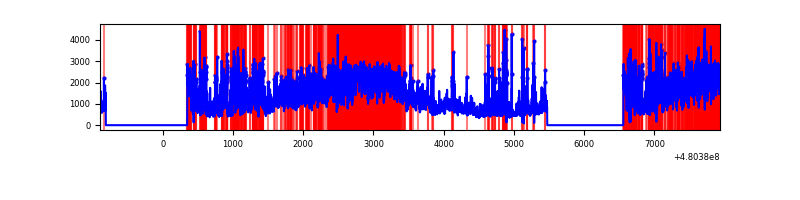 |
Top three noisy pixels from each quadrant. If the there are fewer than three noisy pixels in the level2.evt file, extra rows are filled as -1
| Pixel properties | Quadrant properties | ||||||
|---|---|---|---|---|---|---|---|
| Quadrant | DetID | PixID | Counts | Sigma | Mean | Median | Sigma |
| A | 12 | 3 | 1601390 | 9569.26 | 668 | 652 | 167.3 |
| A | 12 | 250 | 538833 | 3217.26 | 668 | 652 | 167.3 |
| A | 13 | 248 | 523810 | 3127.45 | 668 | 652 | 167.3 |
| B | 10 | 254 | 1174561 | 8160.08 | 684 | 661 | 143.9 |
| B | 5 | 172 | 573724 | 3983.51 | 684 | 661 | 143.9 |
| B | 7 | 252 | 208670 | 1445.92 | 684 | 661 | 143.9 |
| C | 4 | 12 | 5620234 | 35224.25 | 577 | 572 | 159.5 |
| C | 4 | 5 | 208491 | 1303.24 | 577 | 572 | 159.5 |
| C | 13 | 3 | 78281 | 487.08 | 577 | 572 | 159.5 |
| D | 8 | 176 | 5038120 | 27758.36 | 633 | 610 | 181.5 |
| D | 2 | 216 | 517972 | 2850.84 | 633 | 610 | 181.5 |
| D | 2 | 249 | 295826 | 1626.74 | 633 | 610 | 181.5 |
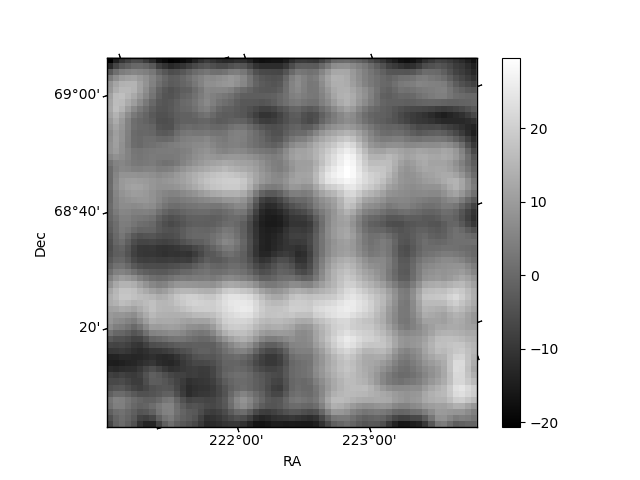
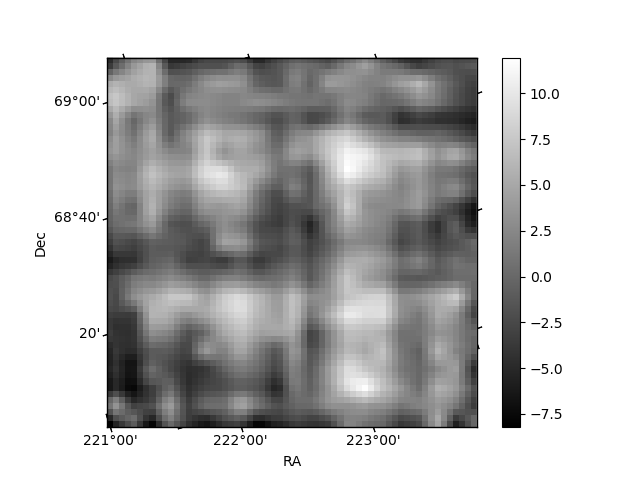
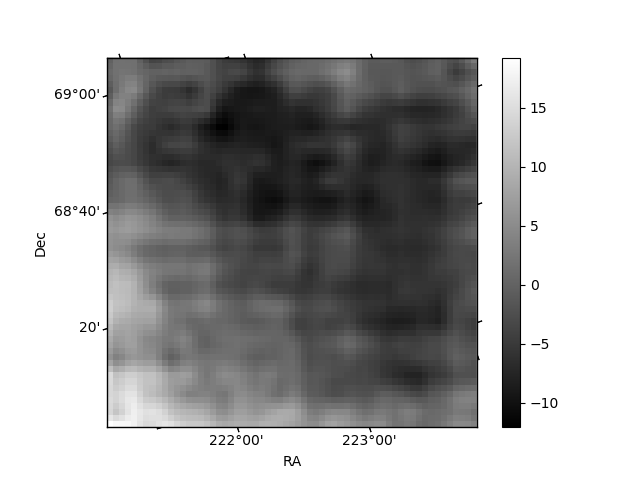
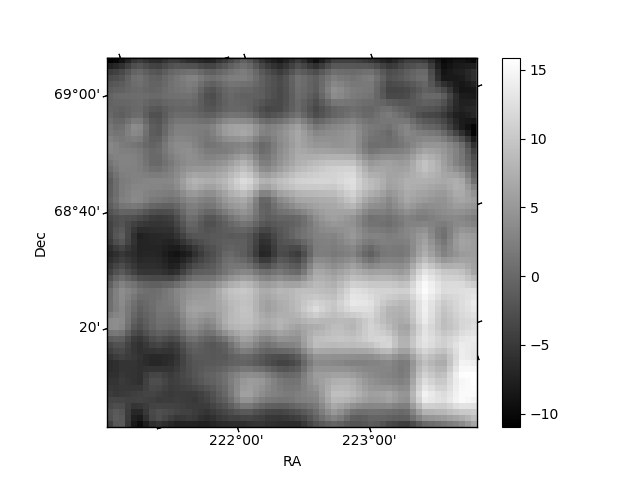
Histogram calculated using DETX and DETY for each event in the final _common_clean file
| Quadrant A | 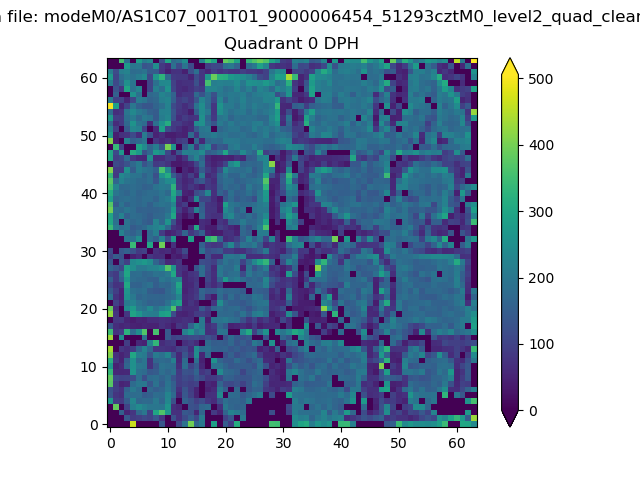 |
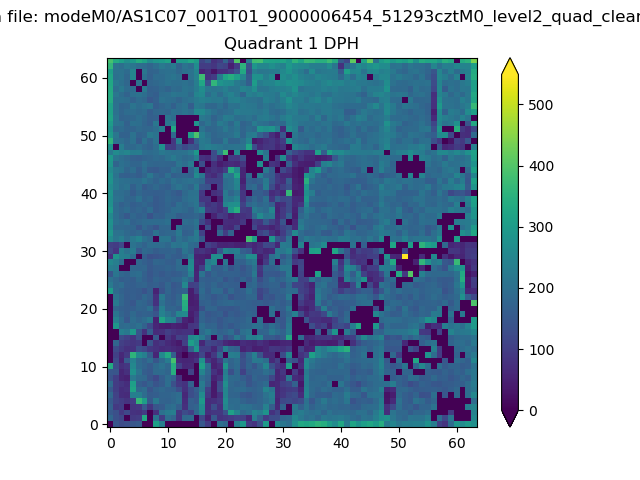 |
Quadrant B |
|---|---|---|---|
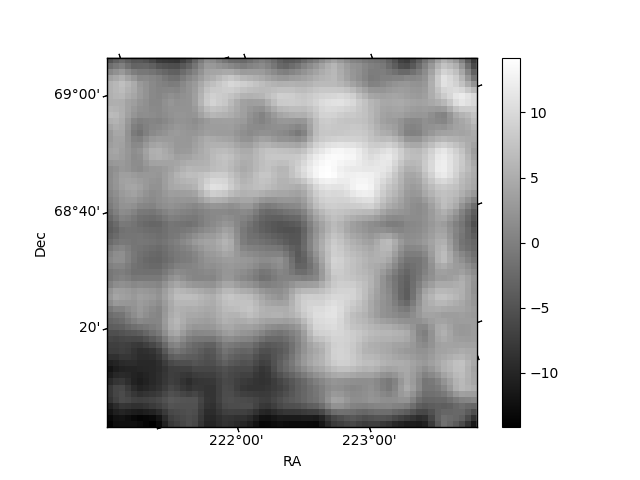
| Quadrant D | 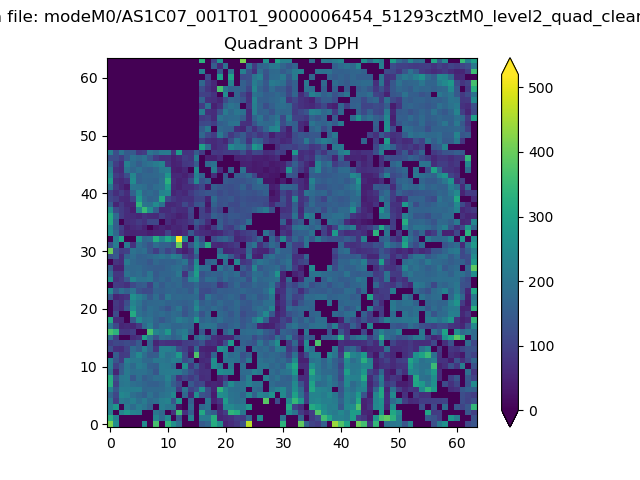 |
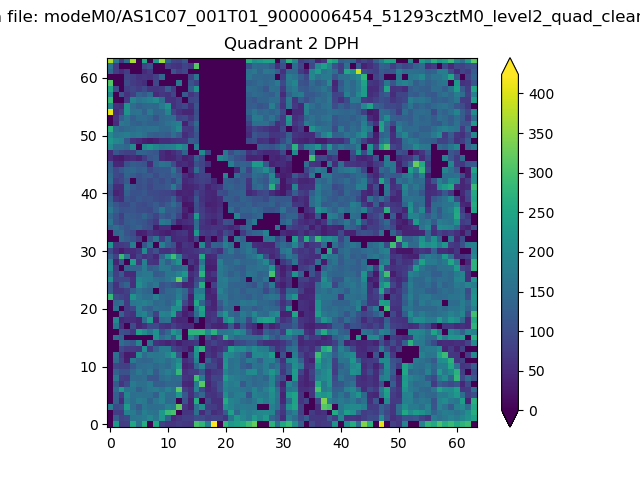 |
Quadrant C |
| Plot type | Count rate plots | Images |
|---|---|---|
| Comparison with Poisson distribution Blue bars denote a histogram of data divided into 1 sec bins. Red curve is a Poisson curve with rate = median count rate of data. |
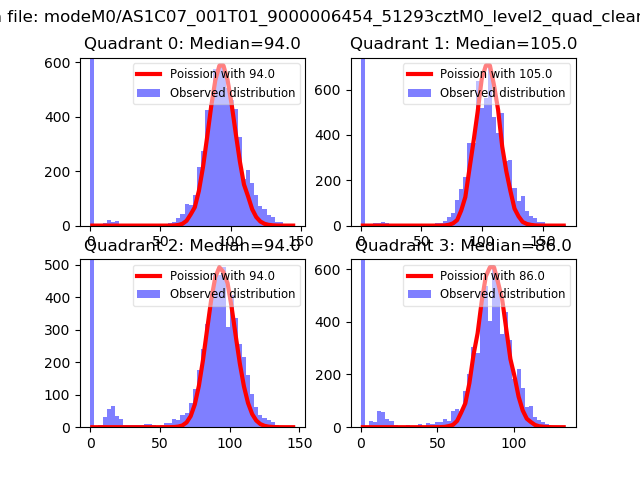 |
 |
| Quadrant-wise count rates Data is divided into 100 sec bins |
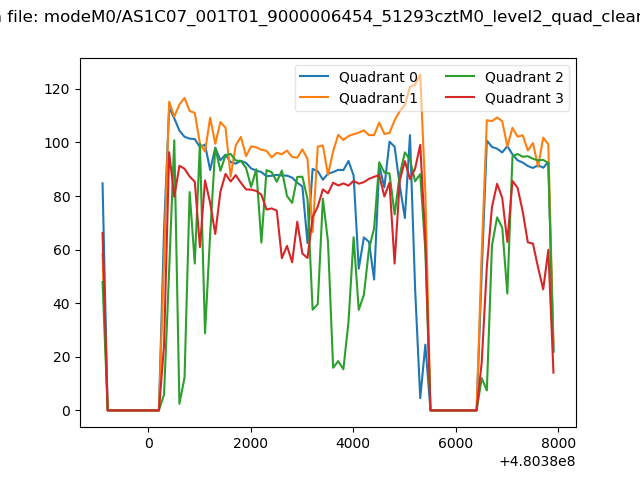 |
|
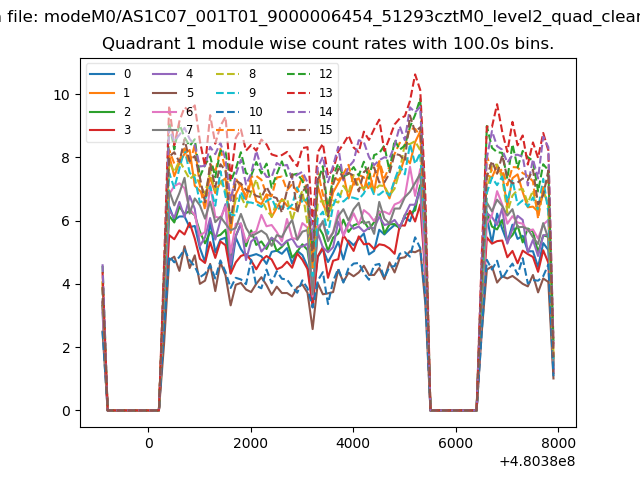
| Module-wise count rates for Quadrant A Data is divided into 100 sec bins |
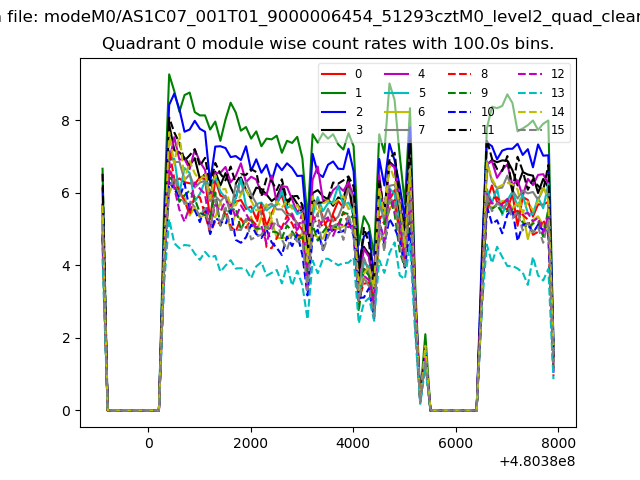 |
 |
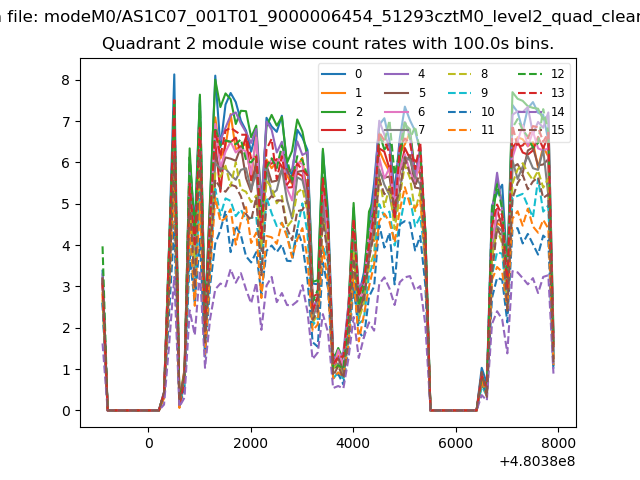
| Module-wise count rates for Quadrant B Data is divided into 100 sec bins |
 |
 |
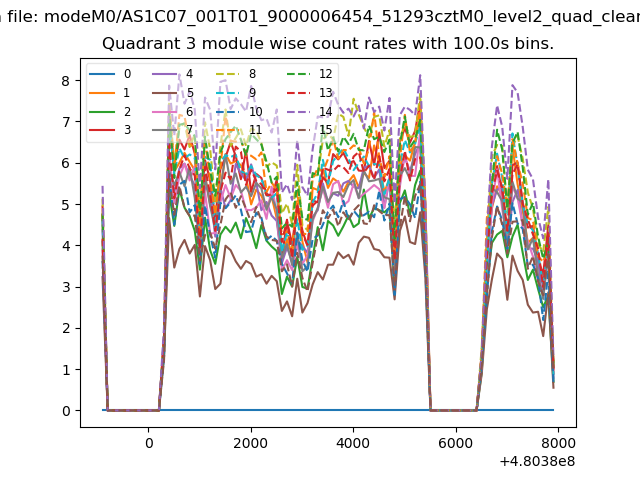
| Module-wise count rates for Quadrant C Data is divided into 100 sec bins |
 |
 |
| Module-wise count rates for Quadrant D Data is divided into 100 sec bins |
 |
 |
| Parameter | Plot |
|---|---|
| CZT HV Monitor | 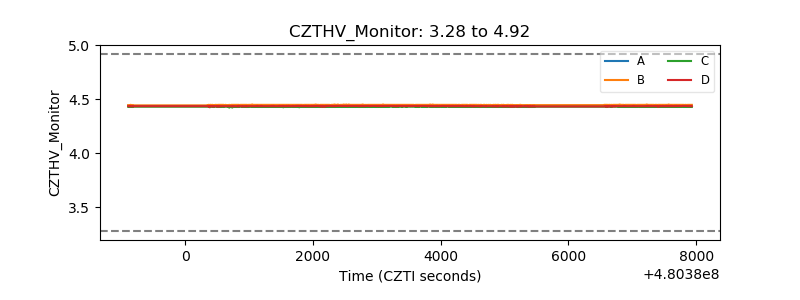 |
| D_VDD | 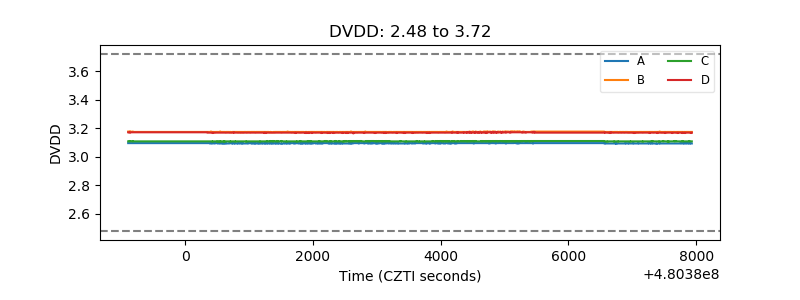 |
| Temperature 1 | 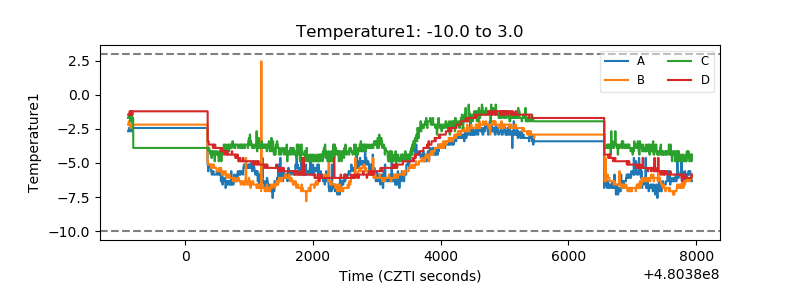 |
| Veto HV Monitor | 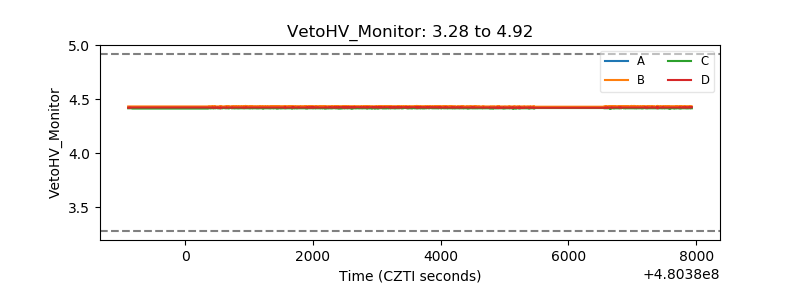 |
| Veto LLD | 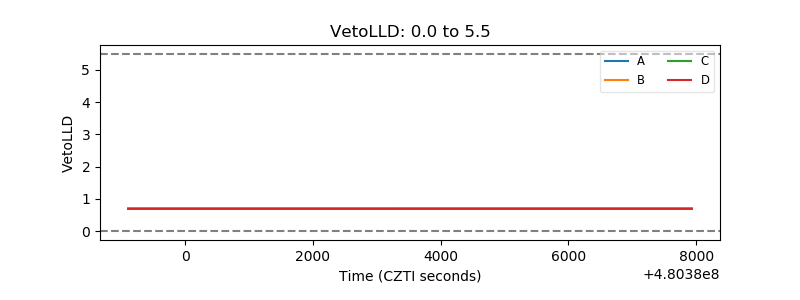 |
| Alpha Counter | 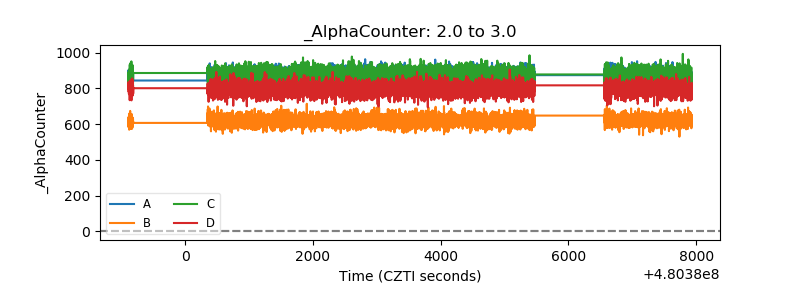 |
| _CPM_Rate | 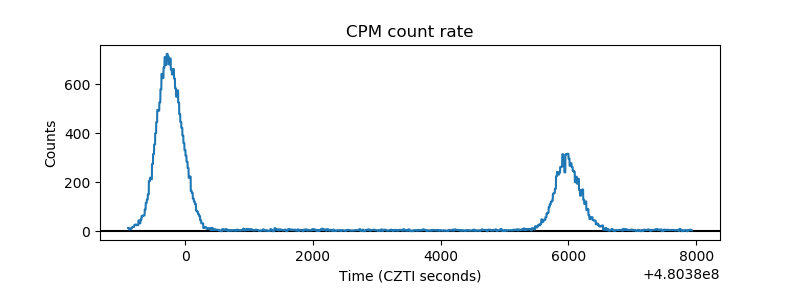 |
| CZT Counter | 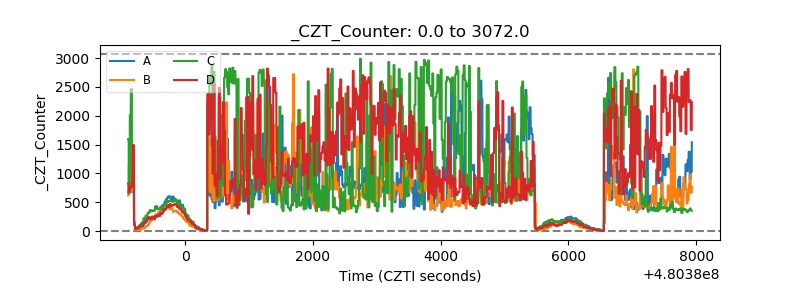 |
| +2.5 Volts monitor | 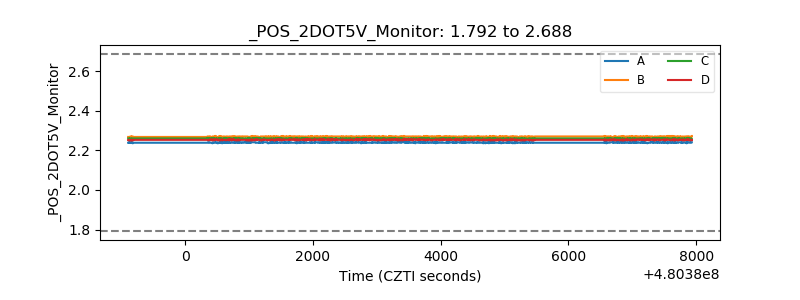 |
| +5 Volts monitor | 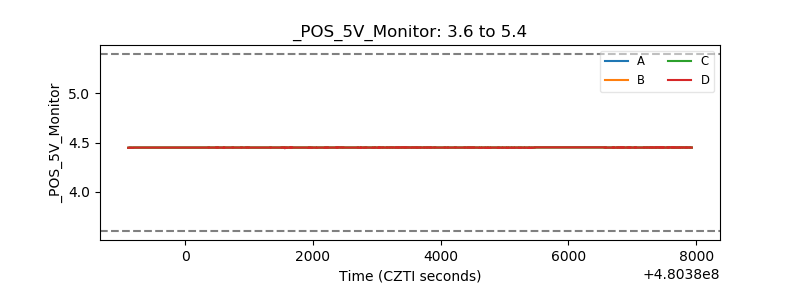 |
| _ROLL_ROT | 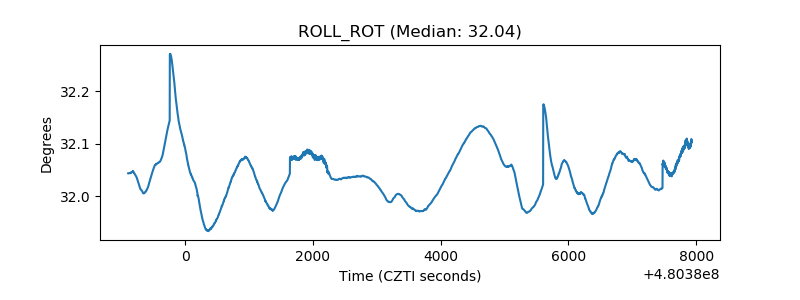 |
| _Roll_DEC | 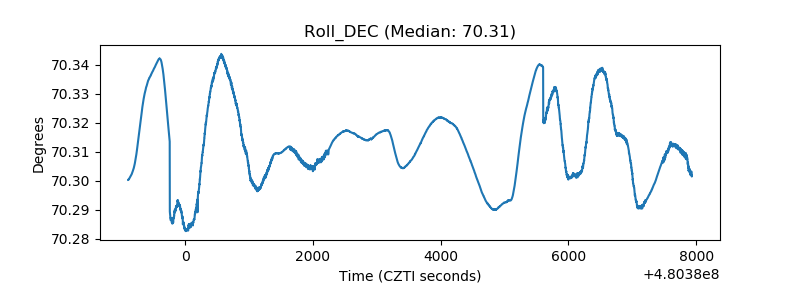 |
| _Roll_RA |  |
| Veto Counter | 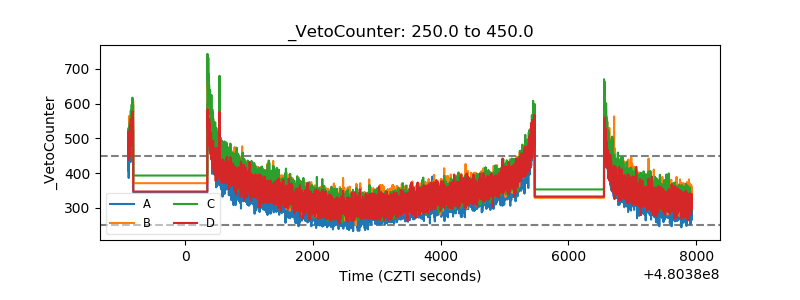 |