| Param | Original file | Final file |
|---|---|---|
| Filename | modeM0/AS1C07_001T01_9000006454_51295cztM0_level2.fits | modeM0/AS1C07_001T01_9000006454_51295cztM0_level2_quad_clean.evt |
| Size (bytes) | 2,058,192,000 | 226,264,320 |
| Size | 1.9 GB | 215.8 MB |
| Events in quadrant A | 15,617,474 | 1,541,896 |
| Events in quadrant B | 13,098,555 | 1,740,234 |
| Events in quadrant C | 19,446,291 | 1,237,103 |
| Events in quadrant D | 26,705,869 | 1,146,744 |
| Mode M0 | |||
|---|---|---|---|
| Quadrant | BADHDUFLAG | Total packets | Discarded packets |
| A | 0 | 58495 | 3 |
| B | 0 | 50775 | 3 |
| C | 0 | 70082 | 3 |
| D | 0 | 91257 | 3 |
| Mode SS | |||
|---|---|---|---|
| Quadrant | BADHDUFLAG | Total packets | Discarded packets |
| A | 0 | 348 | 0 |
| B | 0 | 348 | 0 |
| C | 0 | 348 | 0 |
| D | 0 | 348 | 0 |
| Mode M9 | |||
|---|---|---|---|
| Quadrant | BADHDUFLAG | Total packets | Discarded packets |
| A | 0 | 31 | 0 |
| B | 0 | 31 | 0 |
| C | 0 | 31 | 0 |
| D | 0 | 31 | 0 |
| Quadrant | Total seconds | Saturated seconds | Saturation percentage |
|---|---|---|---|
| A | 17179 | 888 | 5.169102% |
| B | 17179 | 662 | 3.853542% |
| C | 17179 | 4111 | 23.930380% |
| D | 17180 | 4386 | 25.529686% |
Noise dominated data is calculated using 1-second bins in cleaned event files. If a bin has >2000 counts, and if more than 50% of those come from <1% of pixels, then it is considered to be noise-dominated and hence unusable.
| Quadrant | # 1 sec bins | Bins with >0 counts | Bins with >2000 counts | High rate bins dominated by noise | Noise dominated (total time) | Noise dominated (detector-on time) | Marked lightcurve |
|---|---|---|---|---|---|---|---|
| A | 20259 | 17182 | 487 | 487 | 2.40% | 2.83% | 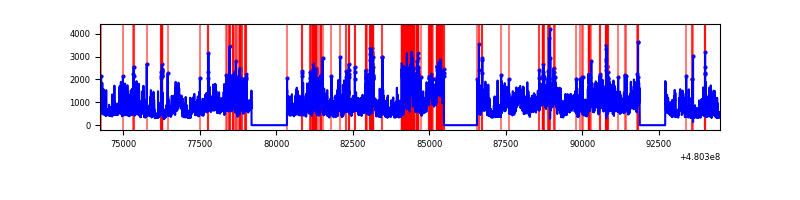 |
| B | 20259 | 17182 | 347 | 347 | 1.71% | 2.02% | 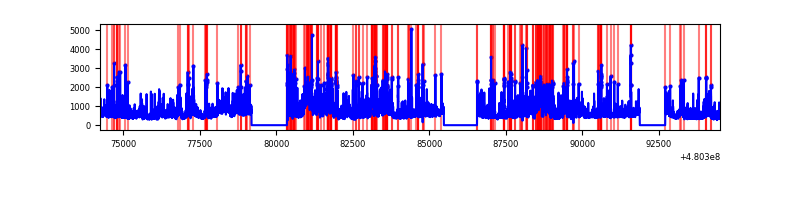 |
| C | 20259 | 17182 | 3546 | 3546 | 17.50% | 20.64% | 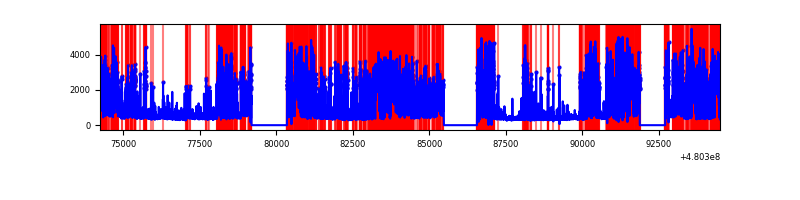 |
| D | 20260 | 17183 | 5555 | 5555 | 27.42% | 32.33% | 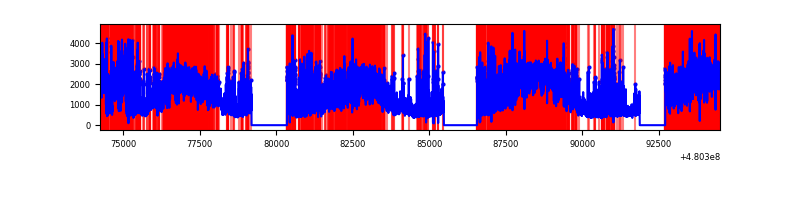 |
Top three noisy pixels from each quadrant. If the there are fewer than three noisy pixels in the level2.evt file, extra rows are filled as -1
| Pixel properties | Quadrant properties | ||||||
|---|---|---|---|---|---|---|---|
| Quadrant | DetID | PixID | Counts | Sigma | Mean | Median | Sigma |
| A | 12 | 3 | 4497401 | 10369.6 | 1753 | 1712 | 433.5 |
| A | 9 | 160 | 826322 | 1902.02 | 1753 | 1712 | 433.5 |
| A | 12 | 250 | 733244 | 1687.33 | 1753 | 1712 | 433.5 |
| B | 10 | 254 | 3249516 | 8745.75 | 1772 | 1711 | 371.4 |
| B | 5 | 172 | 675106 | 1813.33 | 1772 | 1711 | 371.4 |
| B | 7 | 252 | 355962 | 953.93 | 1772 | 1711 | 371.4 |
| C | 4 | 12 | 11505587 | 27070.53 | 1533 | 1521 | 425.0 |
| C | 13 | 3 | 279541 | 654.22 | 1533 | 1521 | 425.0 |
| C | 3 | 233 | 219052 | 511.88 | 1533 | 1521 | 425.0 |
| D | 8 | 176 | 14981247 | 33603.17 | 1589 | 1532 | 445.8 |
| D | 3 | 12 | 1760159 | 3945.03 | 1589 | 1532 | 445.8 |
| D | 12 | 2 | 897596 | 2010.09 | 1589 | 1532 | 445.8 |
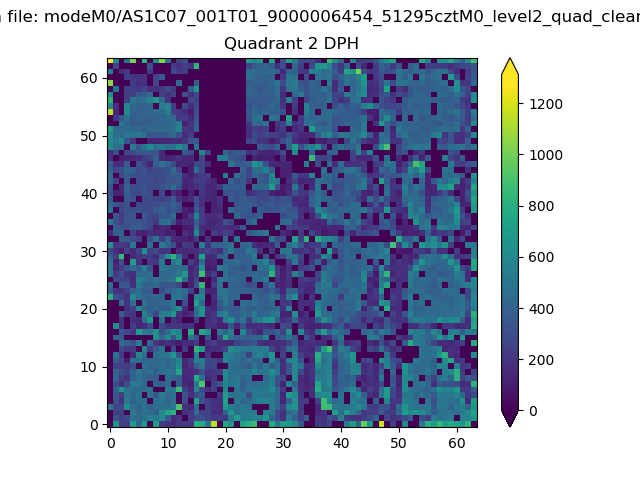
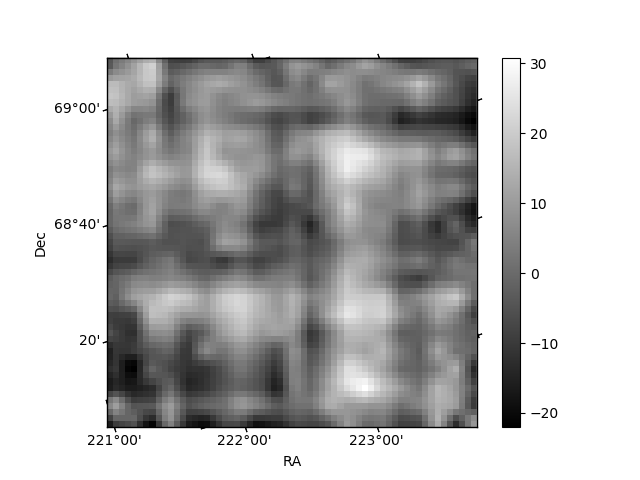
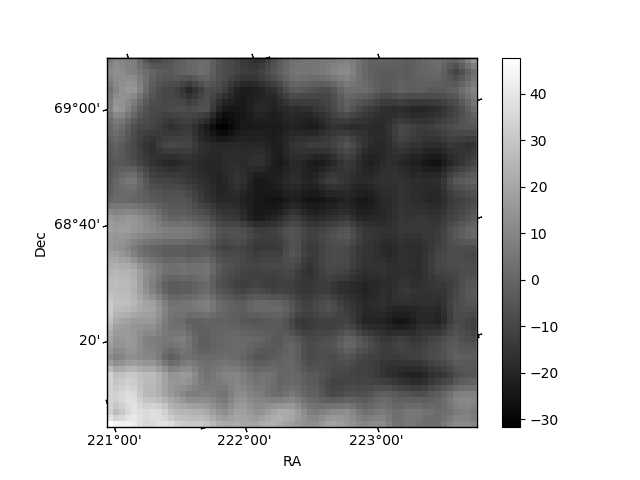
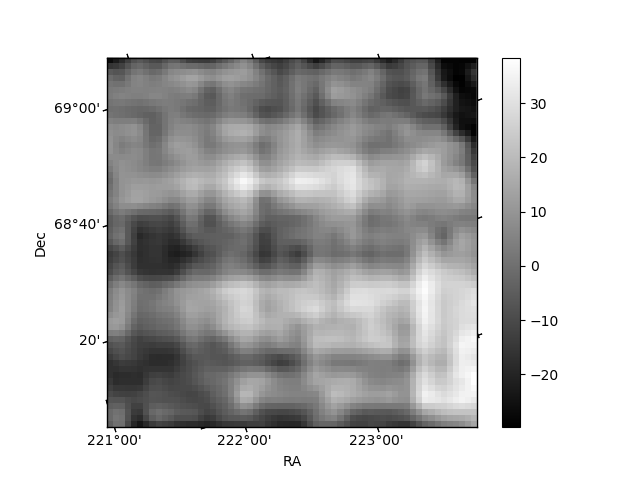
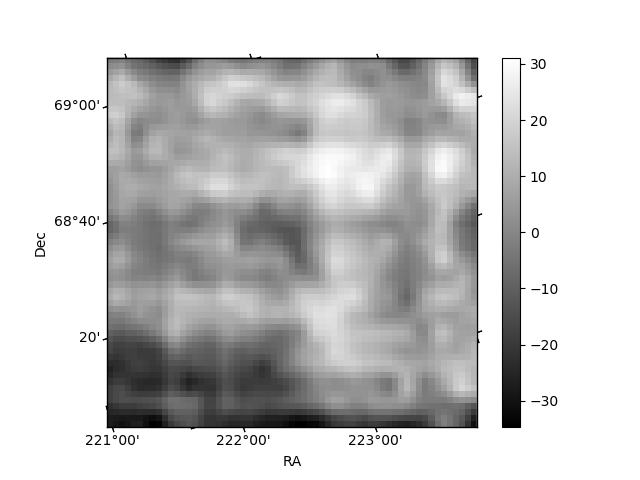
Histogram calculated using DETX and DETY for each event in the final _common_clean file
| Quadrant A | 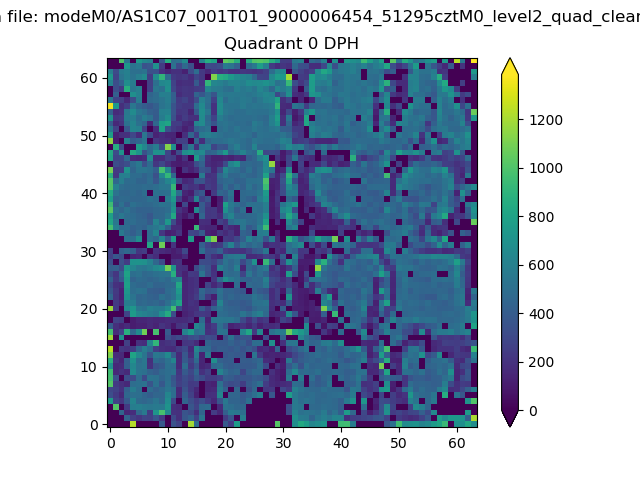 |
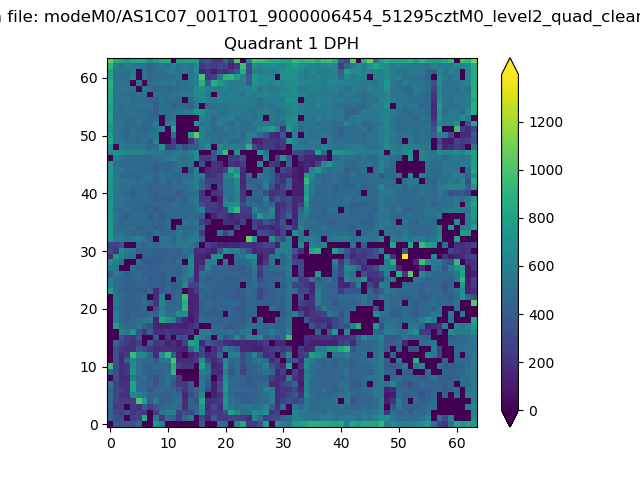 |
Quadrant B |
|---|---|---|---|
| Quadrant D | 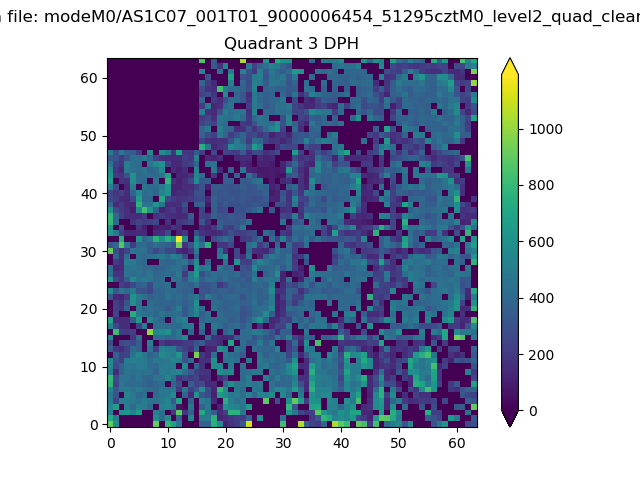 |
 |
Quadrant C |
| Plot type | Count rate plots | Images |
|---|---|---|
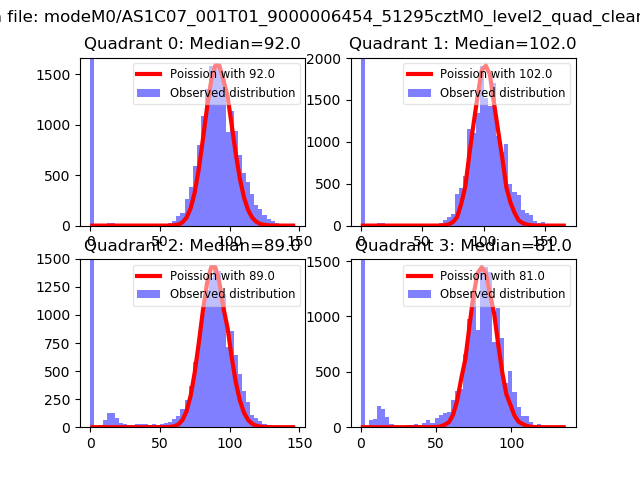
| Comparison with Poisson distribution Blue bars denote a histogram of data divided into 1 sec bins. Red curve is a Poisson curve with rate = median count rate of data. |
 |
 |
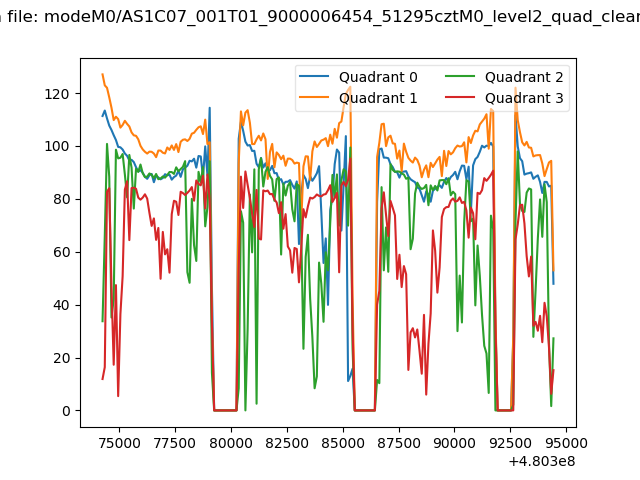
| Quadrant-wise count rates Data is divided into 100 sec bins |
 |
|
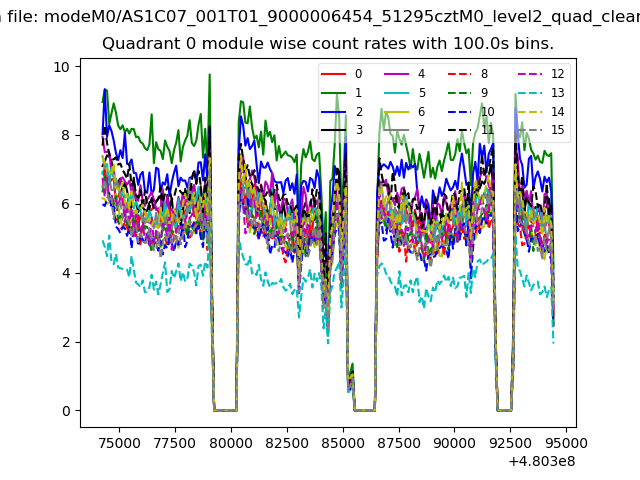
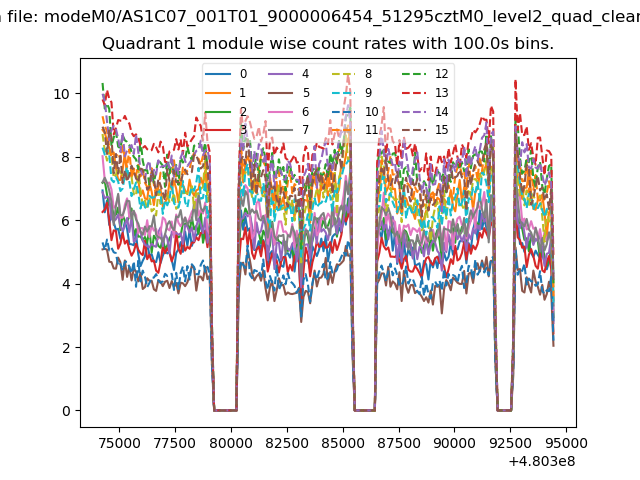
| Module-wise count rates for Quadrant A Data is divided into 100 sec bins |
 |
 |
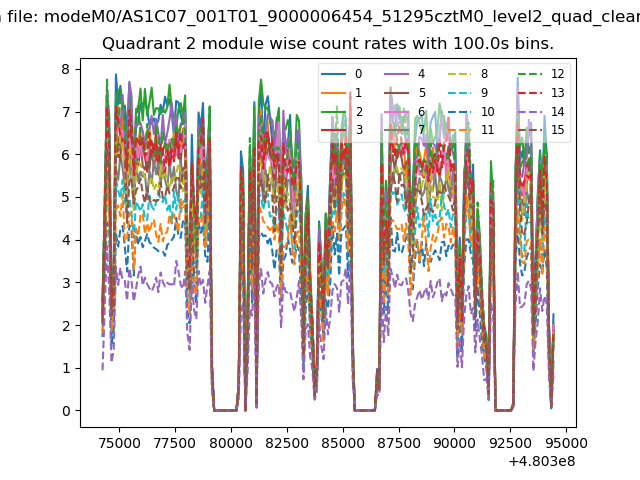
| Module-wise count rates for Quadrant B Data is divided into 100 sec bins |
 |
 |
| Module-wise count rates for Quadrant C Data is divided into 100 sec bins |
 |
 |
| Module-wise count rates for Quadrant D Data is divided into 100 sec bins |
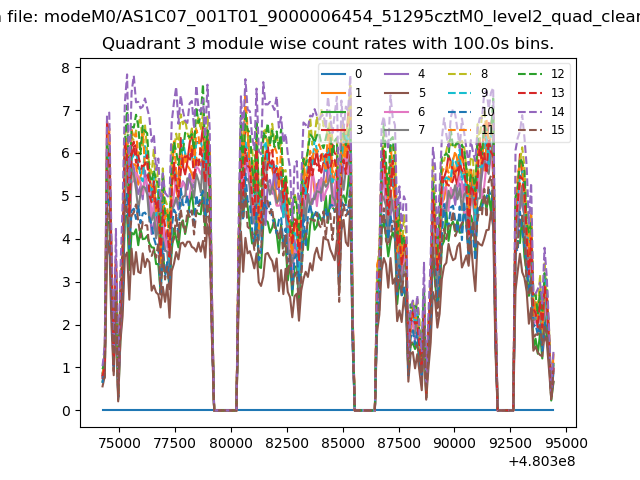 |
 |
| Parameter | Plot |
|---|---|
| CZT HV Monitor | 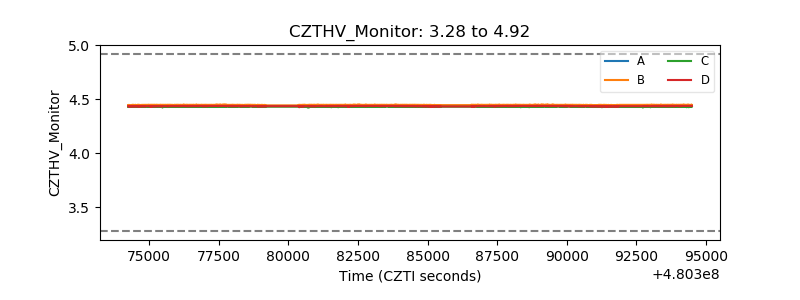 |
| D_VDD | 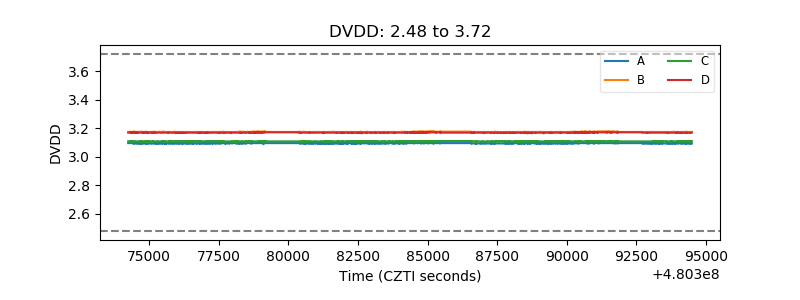 |
| Temperature 1 | 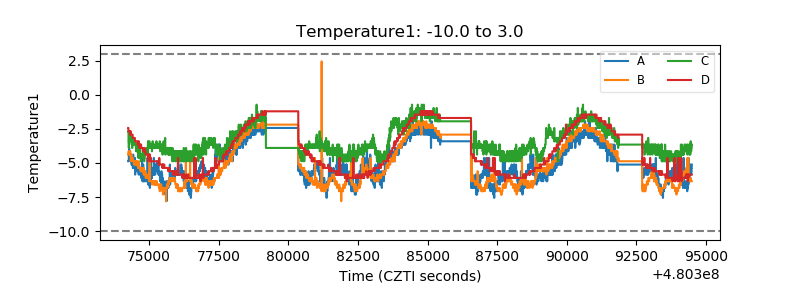 |
| Veto HV Monitor | 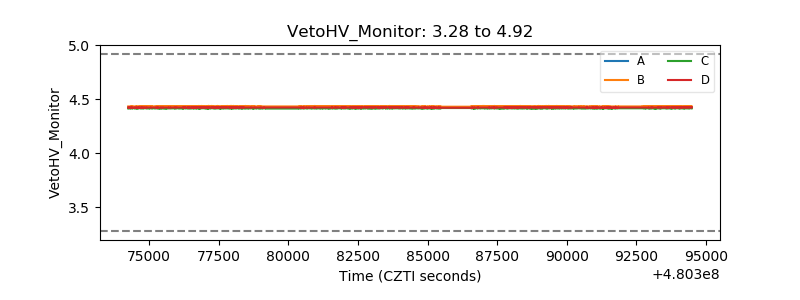 |
| Veto LLD | 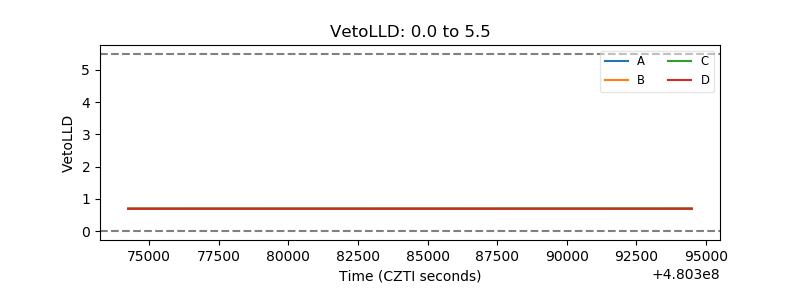 |
| Alpha Counter | 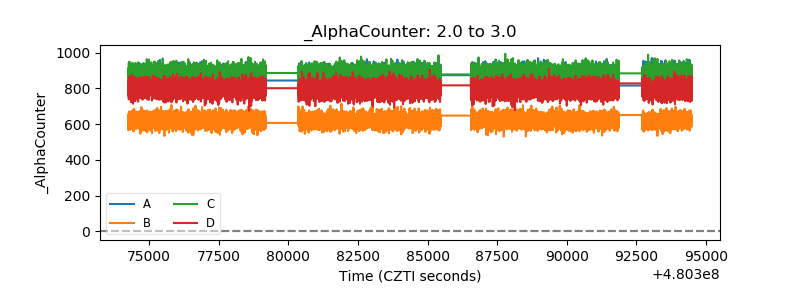 |
| _CPM_Rate | 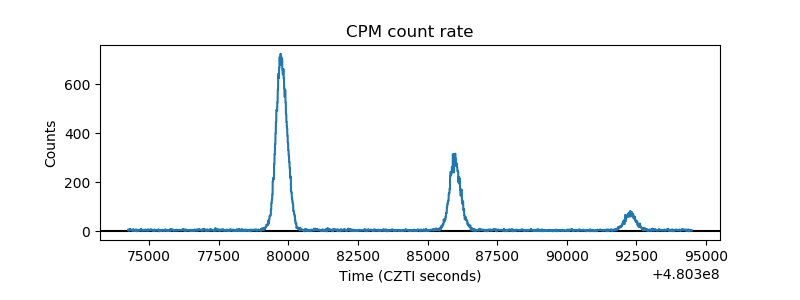 |
| CZT Counter | 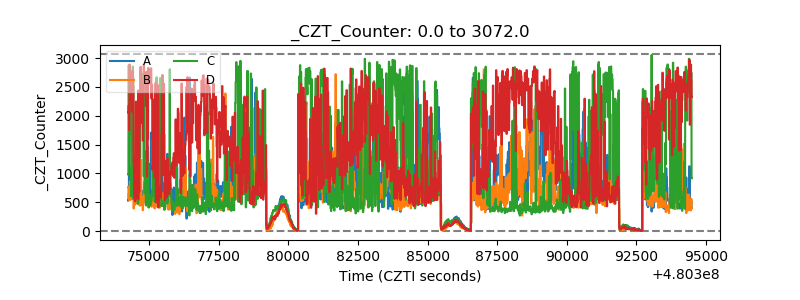 |
| +2.5 Volts monitor | 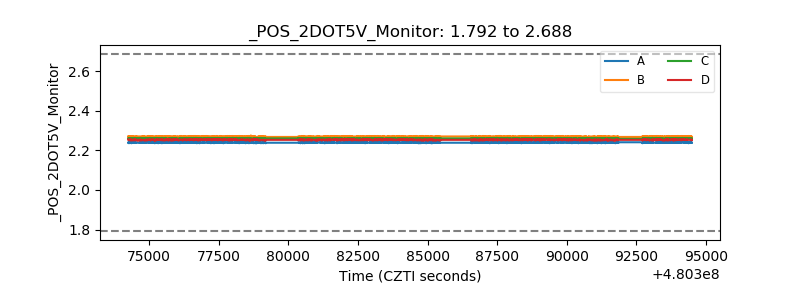 |
| +5 Volts monitor | 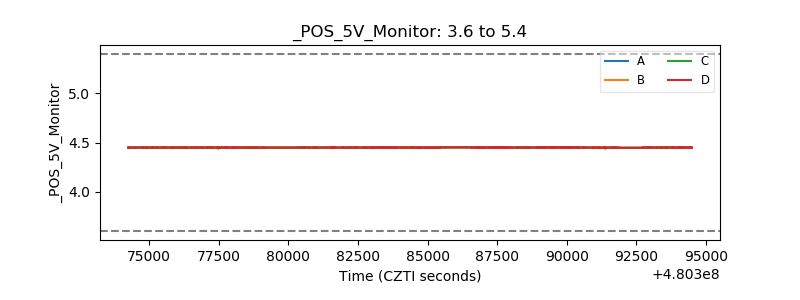 |
| _ROLL_ROT | 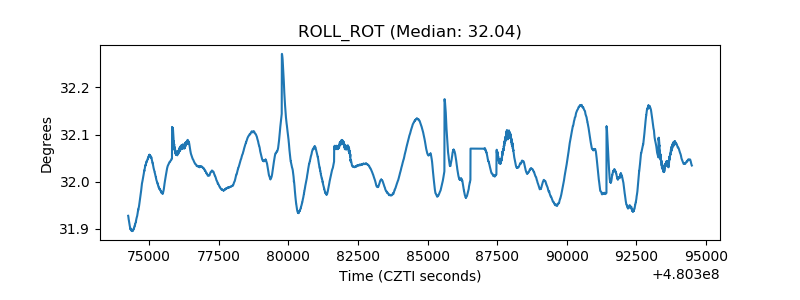 |
| _Roll_DEC | 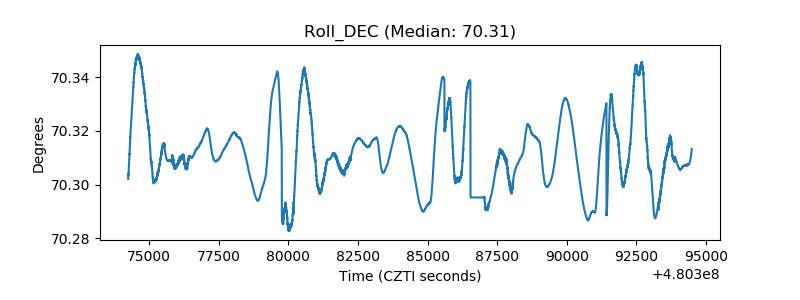 |
| _Roll_RA | 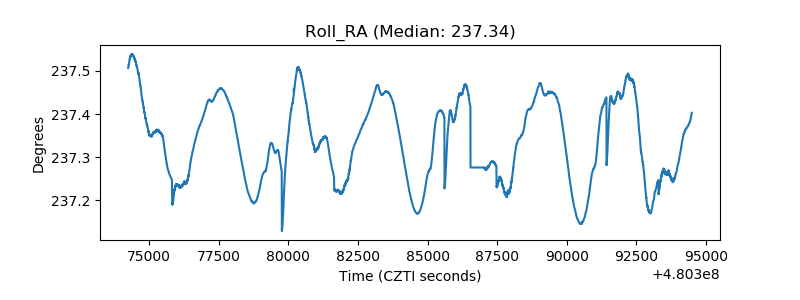 |
| Veto Counter | 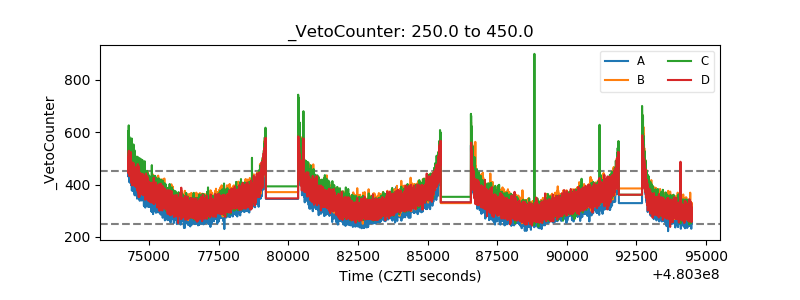 |