| Param | Original file | Final file |
|---|---|---|
| Filename | modeM0/AS1C07_001T03_9000006456cztM0_level2.fits | modeM0/AS1C07_001T03_9000006456cztM0_level2_quad_clean.evt |
| Size (bytes) | 2,803,129,920 | 3,890,620,800 |
| Size | 2.6 GB | 3.6 GB |
| Events in quadrant A | 17,022,385 | 25,991,567 |
| Events in quadrant B | 17,056,892 | 30,107,316 |
| Events in quadrant C | 10,514,262 | 12,724,841 |
| Events in quadrant D | 14,564,344 | 23,418,916 |
| Mode SS | |||
|---|---|---|---|
| Quadrant | BADHDUFLAG | Total packets | Discarded packets |
| A | 0 | 7589 | 0 |
| B | 0 | 7585 | 0 |
| C | 0 | 7525 | 0 |
| D | 0 | 7586 | 0 |
| Mode M0 | |||
|---|---|---|---|
| Quadrant | BADHDUFLAG | Total packets | Discarded packets |
| A | 0 | 1411477 | 0 |
| B | 0 | 1010500 | 0 |
| C | 0 | 2136730 | 0 |
| D | 0 | 1294907 | 0 |
| Mode M9 | |||
|---|---|---|---|
| Quadrant | BADHDUFLAG | Total packets | Discarded packets |
| A | 0 | 425 | 0 |
| B | 0 | 415 | 0 |
| C | 0 | 425 | 0 |
| D | 0 | 425 | 0 |
| Quadrant | Total seconds | Saturated seconds | Saturation percentage |
|---|---|---|---|
| A | 373486 | 39864 | 10.673492% |
| B | 373878 | 20009 | 5.351746% |
| C | 373134 | 212222 | 56.875546% |
| D | 373608 | 42017 | 11.246280% |
Noise dominated data is calculated using 1-second bins in cleaned event files. If a bin has >2000 counts, and if more than 50% of those come from <1% of pixels, then it is considered to be noise-dominated and hence unusable.
| Quadrant | # 1 sec bins | Bins with >0 counts | Bins with >2000 counts | High rate bins dominated by noise | Noise dominated (total time) | Noise dominated (detector-on time) | Marked lightcurve |
|---|---|---|---|---|---|---|---|
| A | 697512 | 373069 | 0 | 0 | 0.00% | 0.00% | 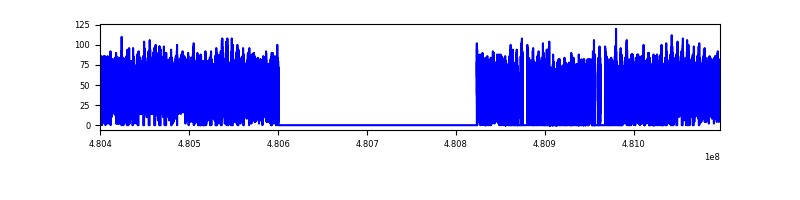 |
| B | 697513 | 374151 | 0 | 0 | 0.00% | 0.00% | 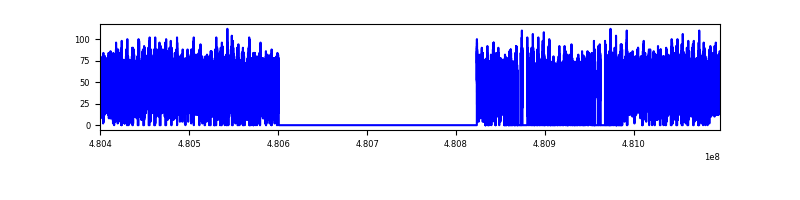 |
| C | 697475 | 343355 | 0 | 0 | 0.00% | 0.00% | 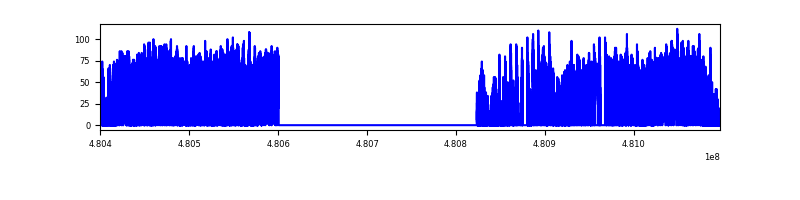 |
| D | 697513 | 373380 | 0 | 0 | 0.00% | 0.00% | 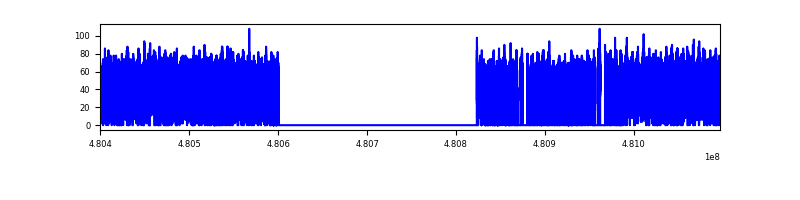 |
Top three noisy pixels from each quadrant. If the there are fewer than three noisy pixels in the level2.evt file, extra rows are filled as -1
| Pixel properties | Quadrant properties | ||||||
|---|---|---|---|---|---|---|---|
| Quadrant | DetID | PixID | Counts | Sigma | Mean | Median | Sigma |
| A | 14 | 188 | 17869 | 9.28 | 4498 | 4164 | 1477.2 |
| A | 9 | 255 | 17457 | 9.0 | 4498 | 4164 | 1477.2 |
| A | 14 | 95 | 14474 | 6.98 | 4498 | 4164 | 1477.2 |
| B | 2 | 245 | 13731 | 8.92 | 4540 | 4297 | 1057.9 |
| B | 3 | 25 | 13638 | 8.83 | 4540 | 4297 | 1057.9 |
| B | 9 | 173 | 13558 | 8.75 | 4540 | 4297 | 1057.9 |
| C | 15 | 255 | 8903 | 6.6 | 2833 | 2584 | 957.0 |
| C | 2 | 31 | 8409 | 6.09 | 2833 | 2584 | 957.0 |
| C | 7 | 221 | 8281 | 5.95 | 2833 | 2584 | 957.0 |
| D | 6 | 218 | 18760 | 10.74 | 4188 | 3718 | 1400.8 |
| D | 3 | 30 | 14449 | 7.66 | 4188 | 3718 | 1400.8 |
| D | 15 | 11 | 13250 | 6.8 | 4188 | 3718 | 1400.8 |
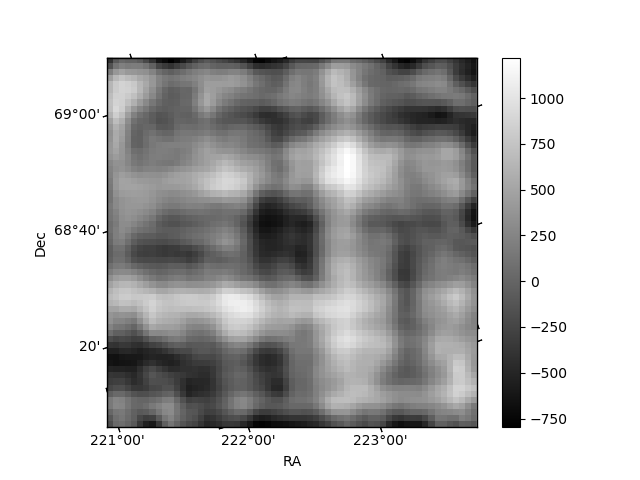
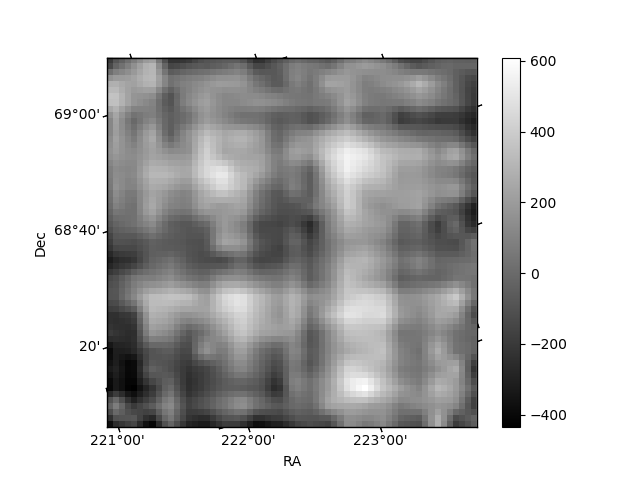
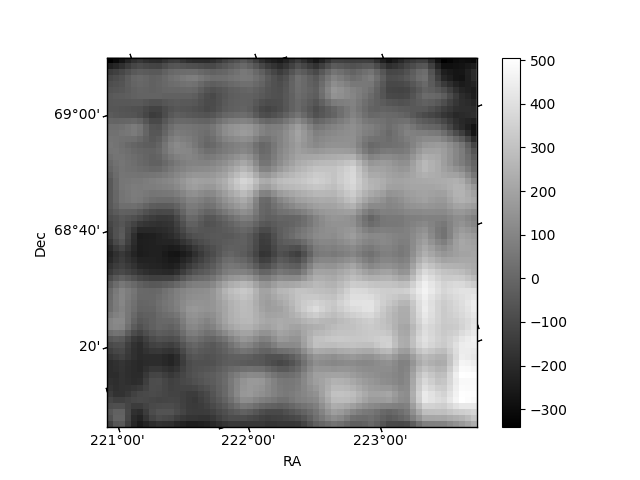
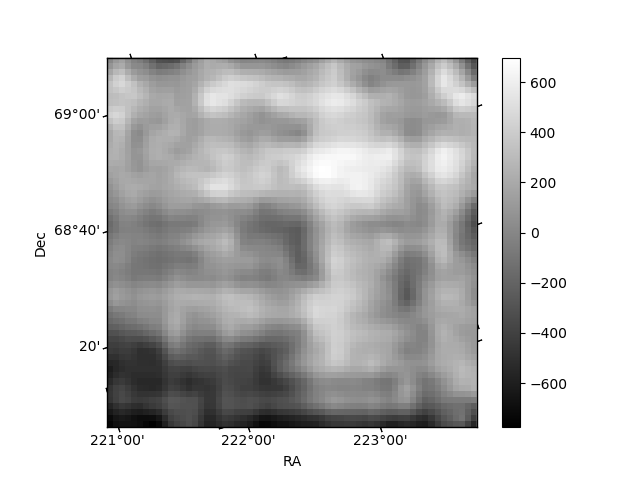
Histogram calculated using DETX and DETY for each event in the final _common_clean file
| Quadrant A | 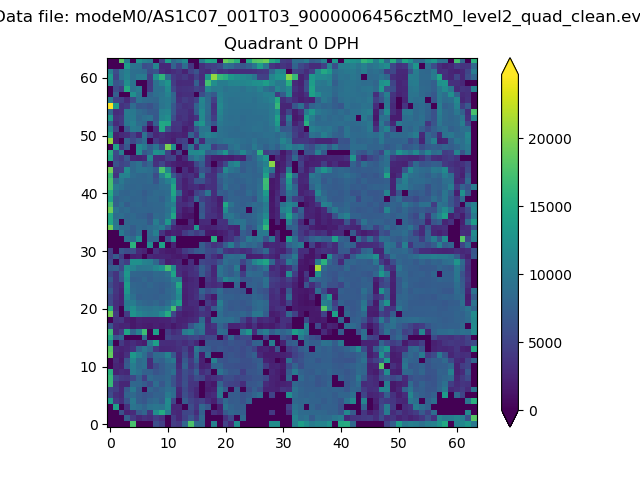 |
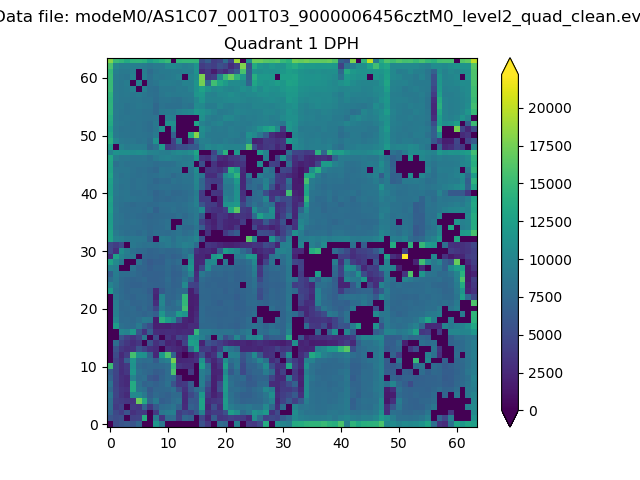 |
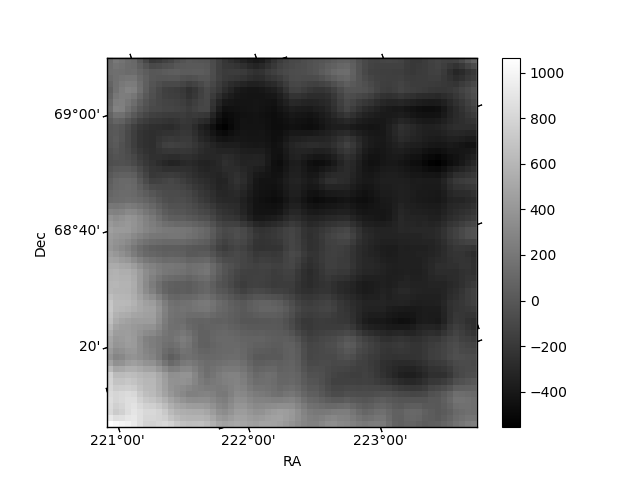
Quadrant B |
|---|---|---|---|
| Quadrant D | 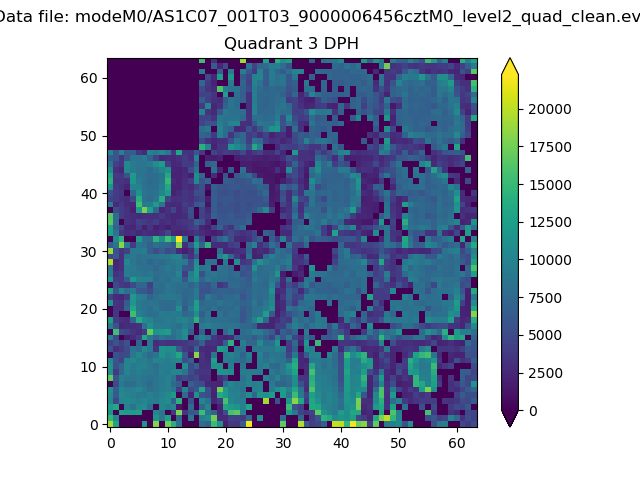 |
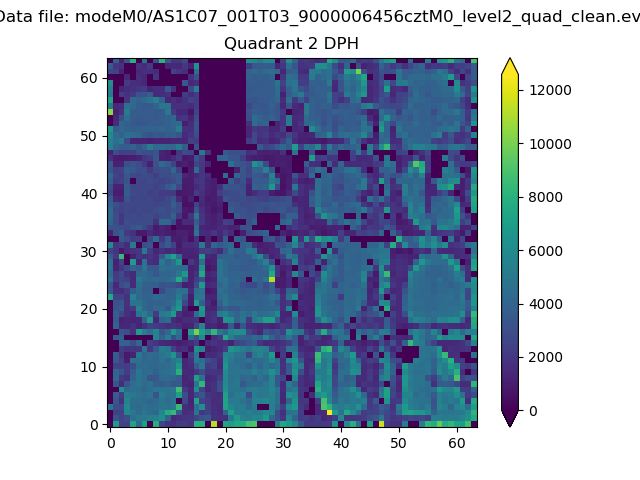 |
Quadrant C |
| Plot type | Count rate plots | Images |
|---|---|---|
| Comparison with Poisson distribution Blue bars denote a histogram of data divided into 1 sec bins. Red curve is a Poisson curve with rate = median count rate of data. |
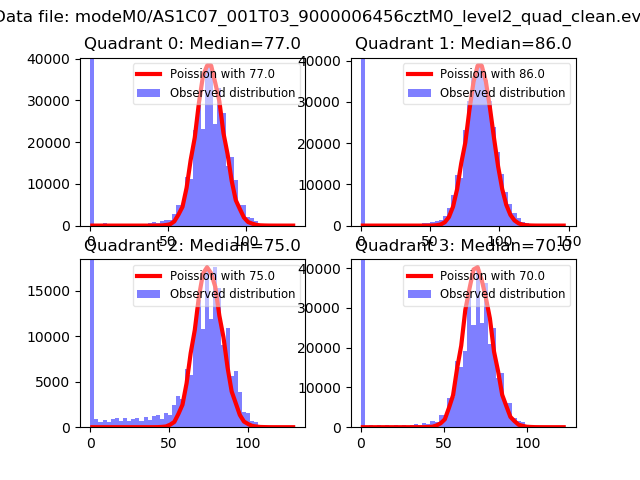 |
 |
| Quadrant-wise count rates Data is divided into 100 sec bins |
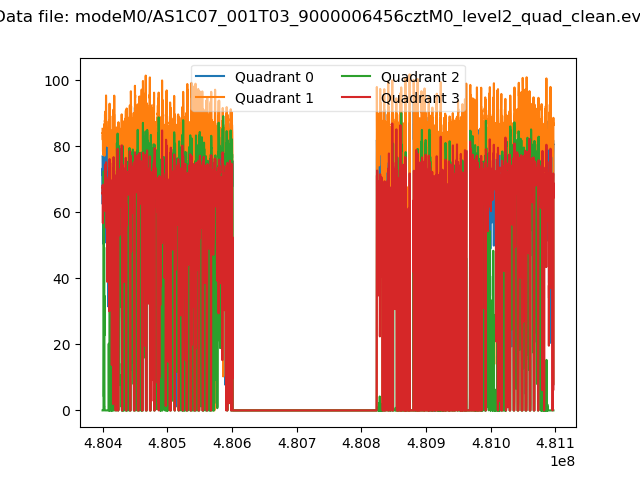 |
|
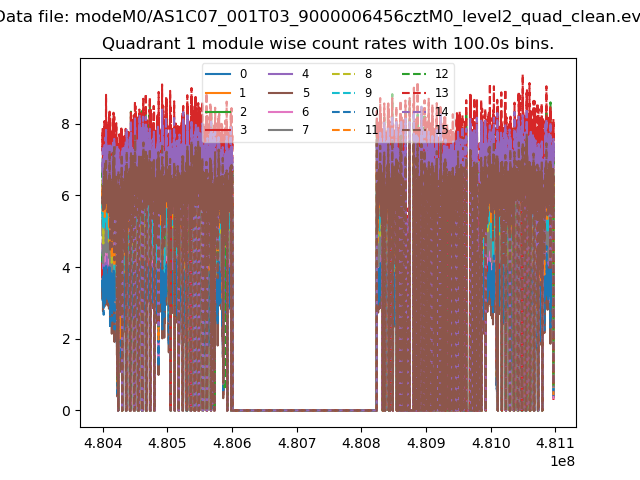
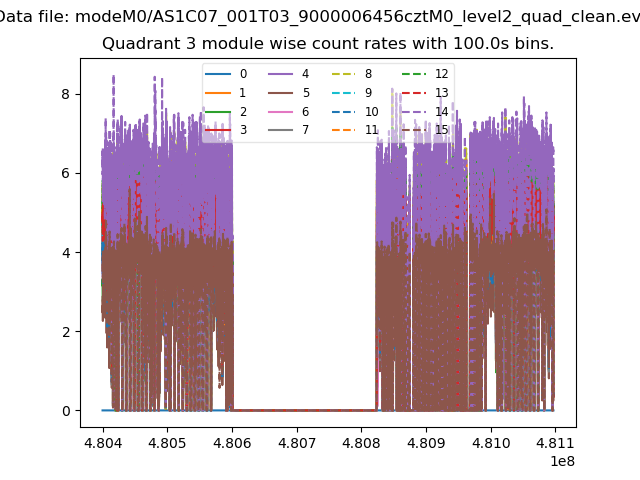
| Module-wise count rates for Quadrant A Data is divided into 100 sec bins |
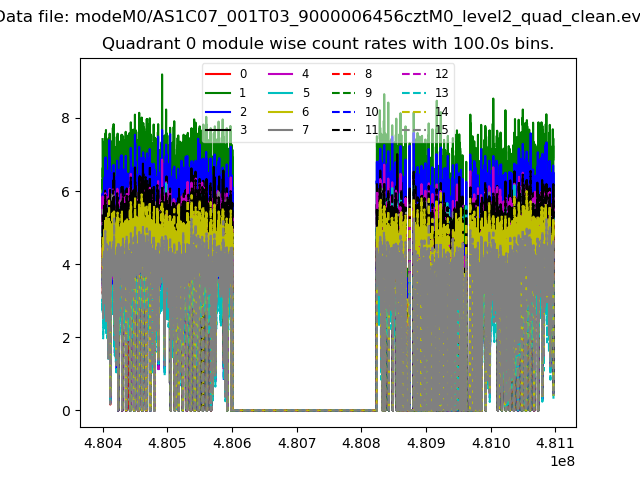 |
 |
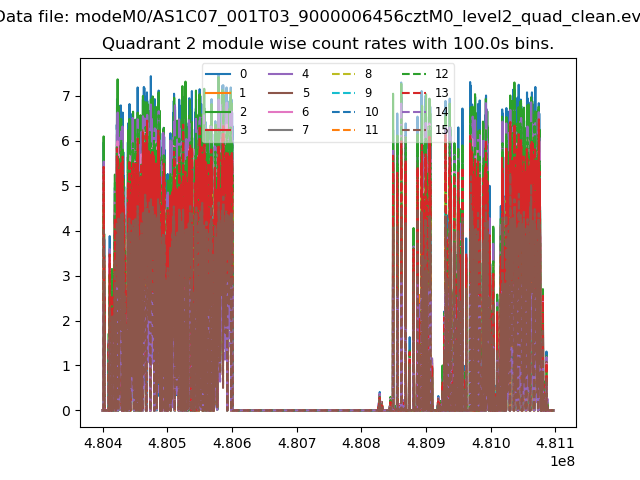
| Module-wise count rates for Quadrant B Data is divided into 100 sec bins |
 |
 |
| Module-wise count rates for Quadrant C Data is divided into 100 sec bins |
 |
 |
| Module-wise count rates for Quadrant D Data is divided into 100 sec bins |
 |
 |
| Parameter | Plot |
|---|---|
| CZT HV Monitor | 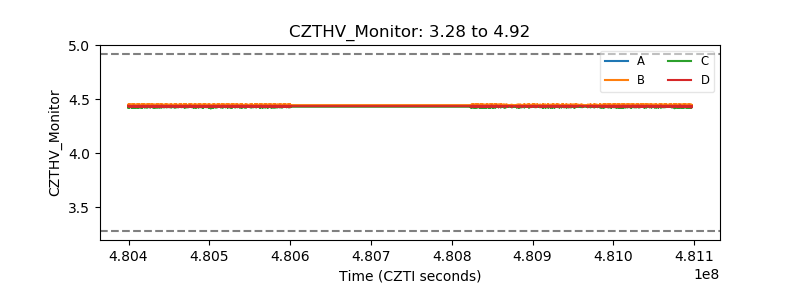 |
| D_VDD | 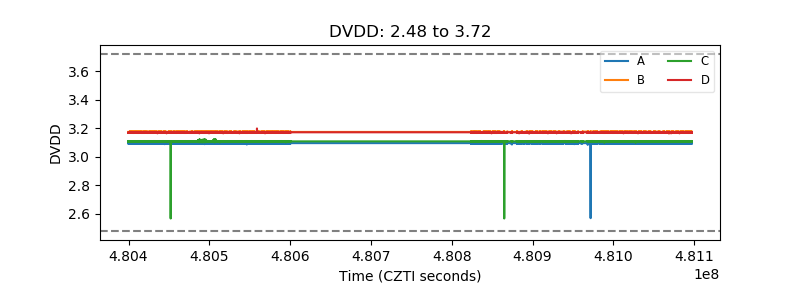 |
| Temperature 1 | 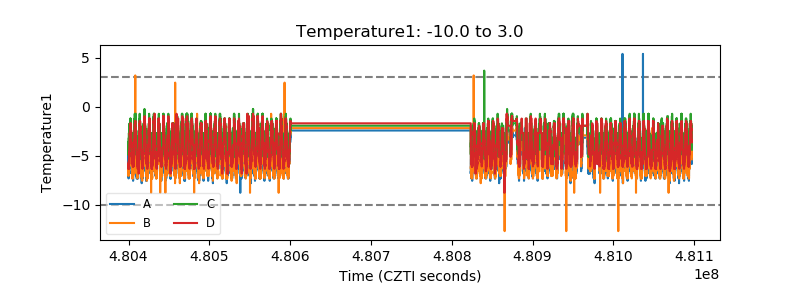 |
| Veto HV Monitor | 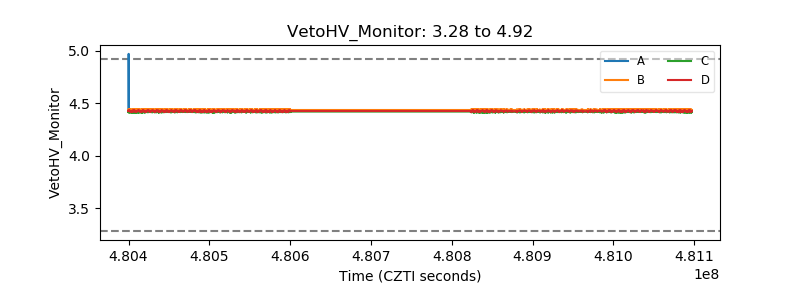 |
| Veto LLD | 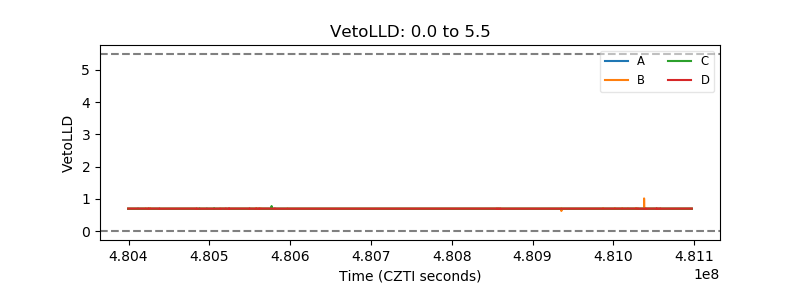 |
| Alpha Counter | 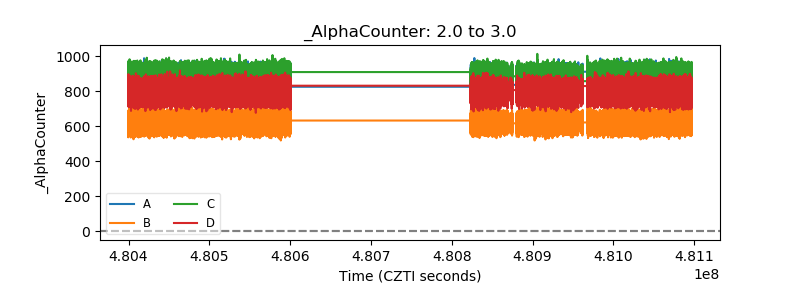 |
| _CPM_Rate | 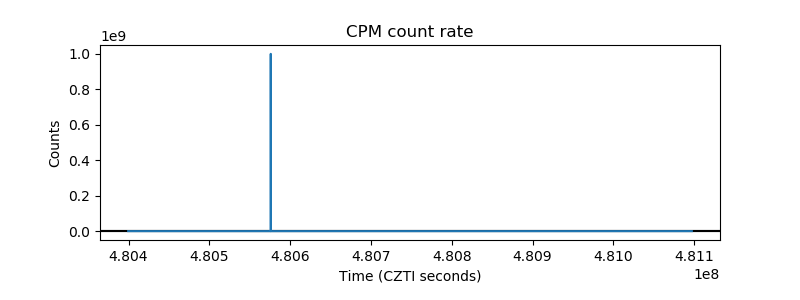 |
| CZT Counter | 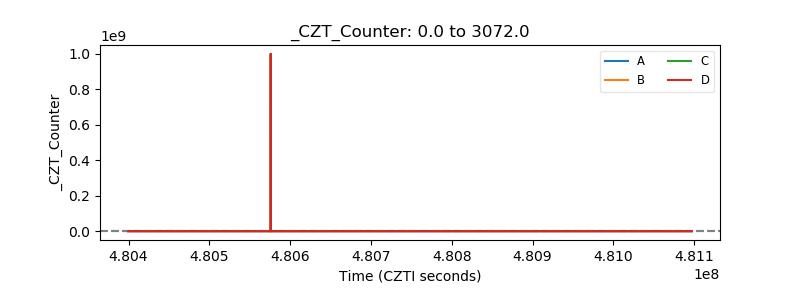 |
| +2.5 Volts monitor | 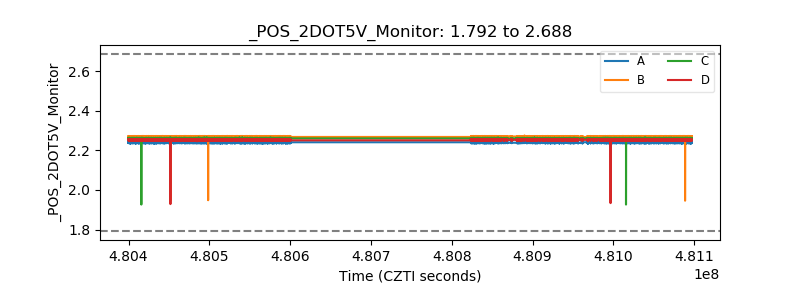 |
| +5 Volts monitor | 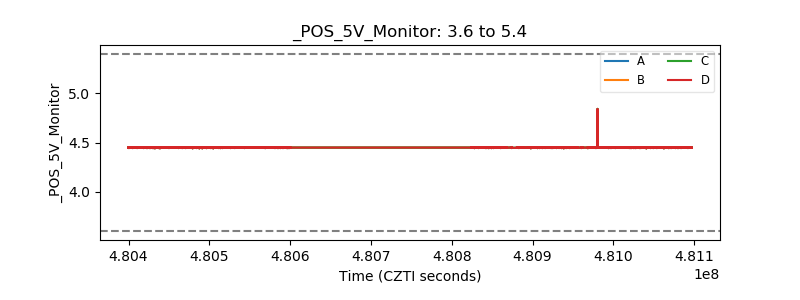 |
| _ROLL_ROT | 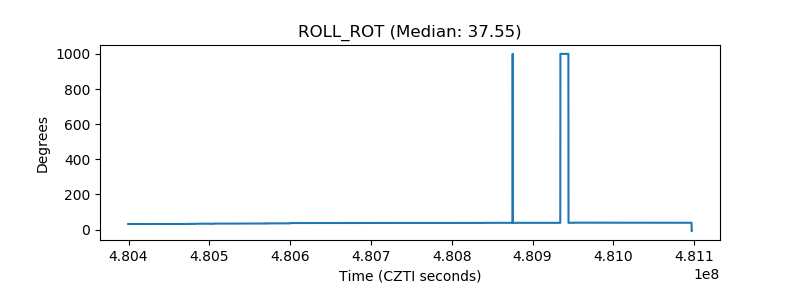 |
| _Roll_DEC | 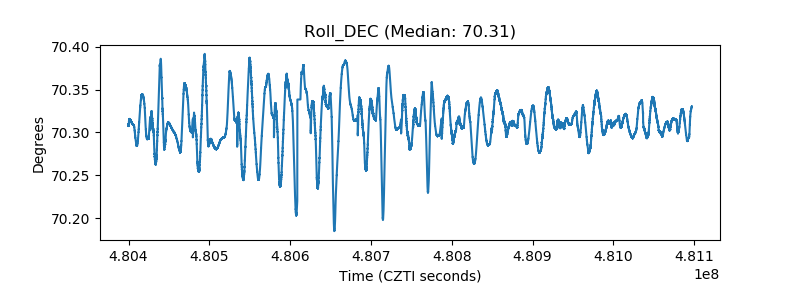 |
| _Roll_RA | 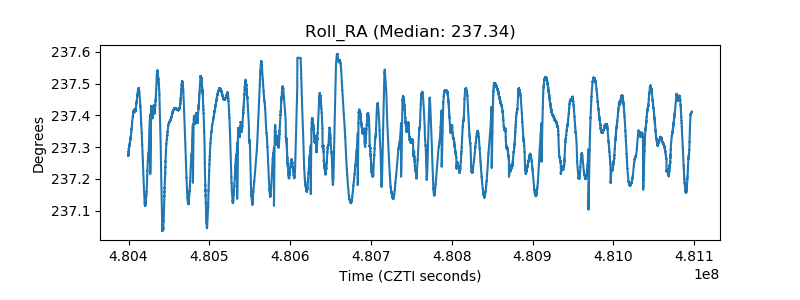 |
| Veto Counter | 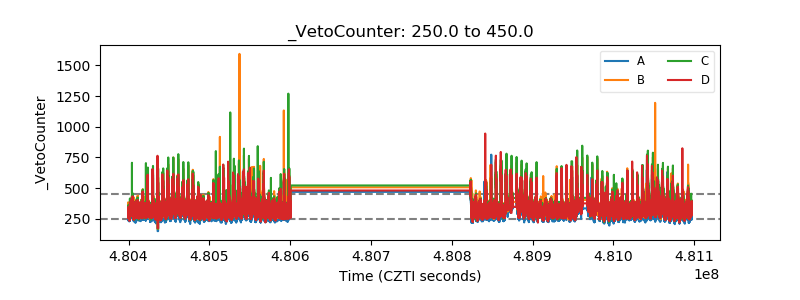 |