| Param | Original file | Final file |
|---|---|---|
| Filename | modeM0/AS1C07_001T03_9000006456_51296cztM0_level2.fits | modeM0/AS1C07_001T03_9000006456_51296cztM0_level2_quad_clean.evt |
| Size (bytes) | 931,420,800 | 81,970,560 |
| Size | 888.3 MB | 78.2 MB |
| Events in quadrant A | 7,465,881 | 623,511 |
| Events in quadrant B | 4,042,077 | 715,353 |
| Events in quadrant C | 14,439,723 | 55,015 |
| Events in quadrant D | 7,968,986 | 583,401 |
| Mode SS | |||
|---|---|---|---|
| Quadrant | BADHDUFLAG | Total packets | Discarded packets |
| A | 0 | 146 | 0 |
| B | 0 | 146 | 0 |
| C | 0 | 144 | 0 |
| D | 0 | 144 | 0 |
| Mode M0 | |||
|---|---|---|---|
| Quadrant | BADHDUFLAG | Total packets | Discarded packets |
| A | 0 | 27308 | 0 |
| B | 0 | 17086 | 0 |
| C | 0 | 47889 | 1 |
| D | 0 | 28735 | 0 |
| Quadrant | Total seconds | Saturated seconds | Saturation percentage |
|---|---|---|---|
| A | 7247 | 552 | 7.616945% |
| B | 7248 | 118 | 1.628035% |
| C | 7247 | 6688 | 92.286463% |
| D | 7247 | 413 | 5.698910% |
Noise dominated data is calculated using 1-second bins in cleaned event files. If a bin has >2000 counts, and if more than 50% of those come from <1% of pixels, then it is considered to be noise-dominated and hence unusable.
| Quadrant | # 1 sec bins | Bins with >0 counts | Bins with >2000 counts | High rate bins dominated by noise | Noise dominated (total time) | Noise dominated (detector-on time) | Marked lightcurve |
|---|---|---|---|---|---|---|---|
| A | 7247 | 7247 | 397 | 397 | 5.48% | 5.48% | 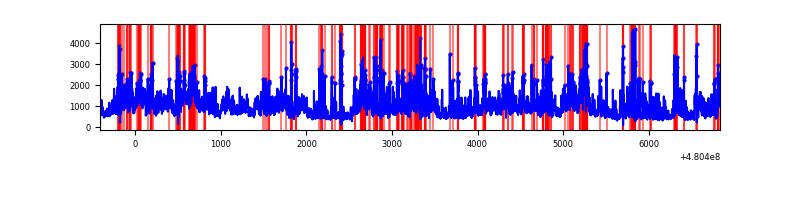 |
| B | 7248 | 7248 | 69 | 69 | 0.95% | 0.95% | 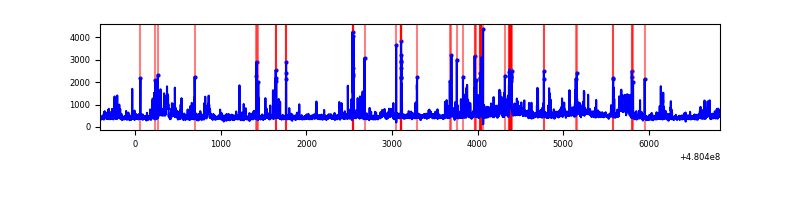 |
| C | 7246 | 7246 | 3698 | 3698 | 51.04% | 51.04% | 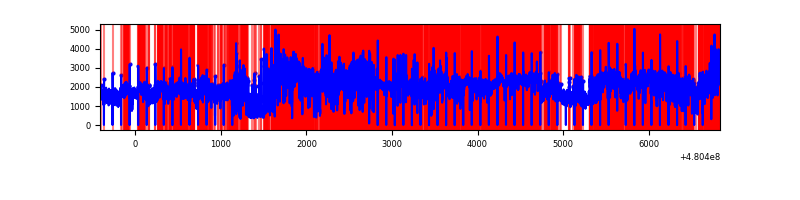 |
| D | 7247 | 7247 | 527 | 527 | 7.27% | 7.27% | 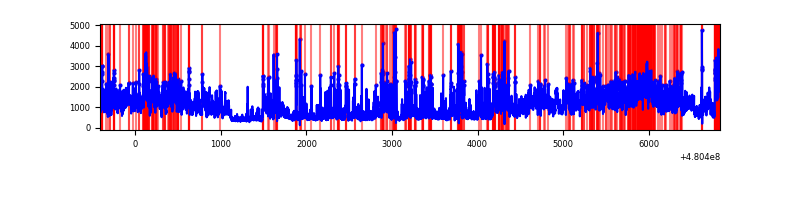 |
Top three noisy pixels from each quadrant. If the there are fewer than three noisy pixels in the level2.evt file, extra rows are filled as -1
| Pixel properties | Quadrant properties | ||||||
|---|---|---|---|---|---|---|---|
| Quadrant | DetID | PixID | Counts | Sigma | Mean | Median | Sigma |
| A | 12 | 3 | 1924210 | 10844.49 | 714 | 697 | 177.4 |
| A | 12 | 250 | 698058 | 3931.62 | 714 | 697 | 177.4 |
| A | 14 | 254 | 493911 | 2780.67 | 714 | 697 | 177.4 |
| B | 5 | 185 | 259249 | 1631.66 | 735 | 708 | 158.5 |
| B | 10 | 247 | 189414 | 1190.93 | 735 | 708 | 158.5 |
| B | 10 | 254 | 136335 | 855.95 | 735 | 708 | 158.5 |
| C | 15 | 198 | 10383484 | 262750.82 | 138 | 137 | 39.5 |
| C | 4 | 12 | 3231368 | 81766.37 | 138 | 137 | 39.5 |
| C | 10 | 252 | 40374 | 1018.2 | 138 | 137 | 39.5 |
| D | 8 | 176 | 3578929 | 18370.99 | 695 | 668 | 194.8 |
| D | 3 | 12 | 372581 | 1909.42 | 695 | 668 | 194.8 |
| D | 6 | 42 | 306252 | 1568.89 | 695 | 668 | 194.8 |
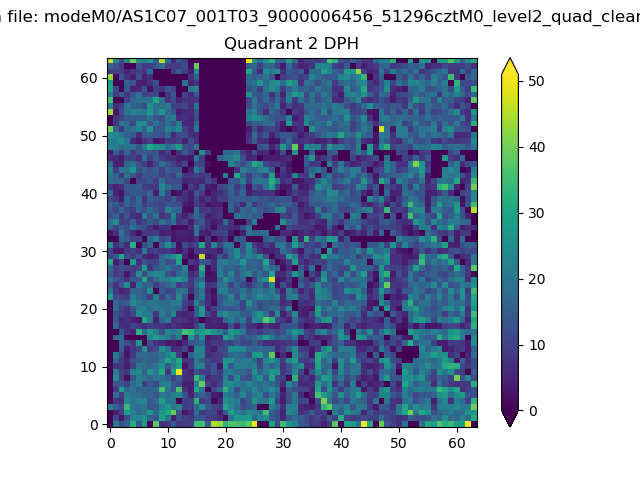
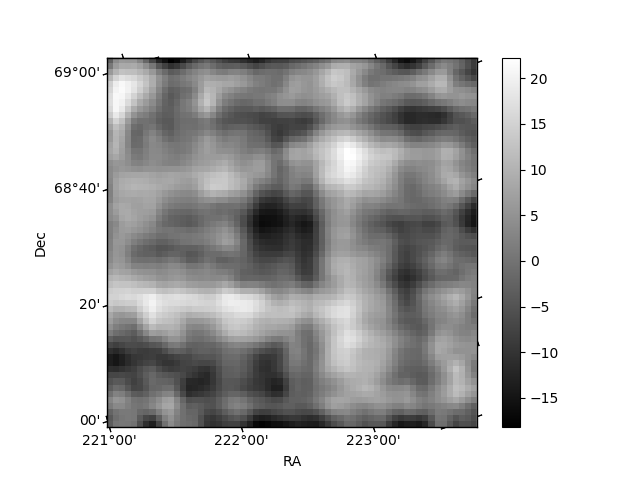
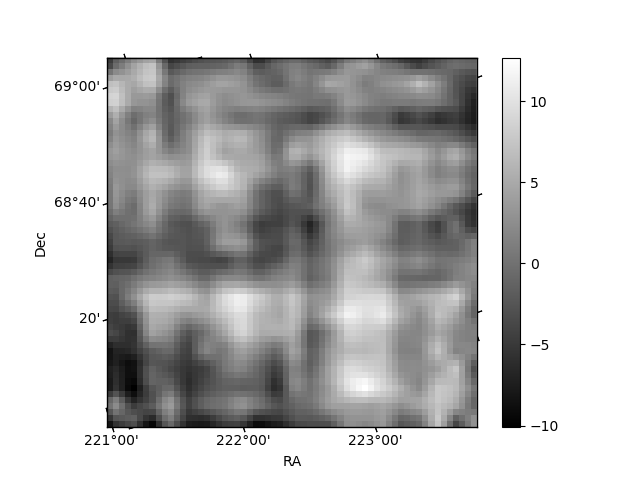
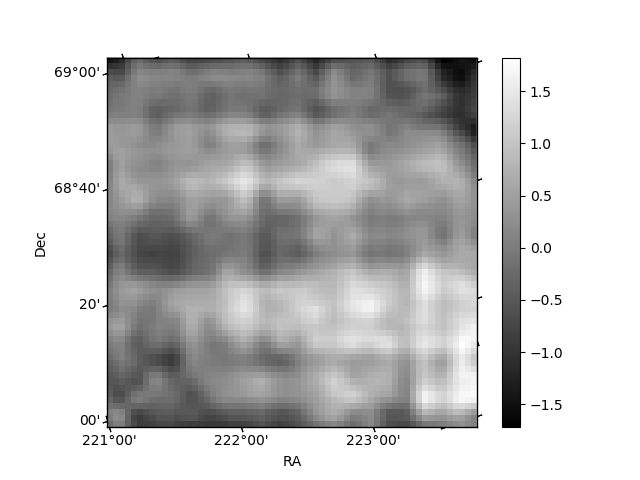
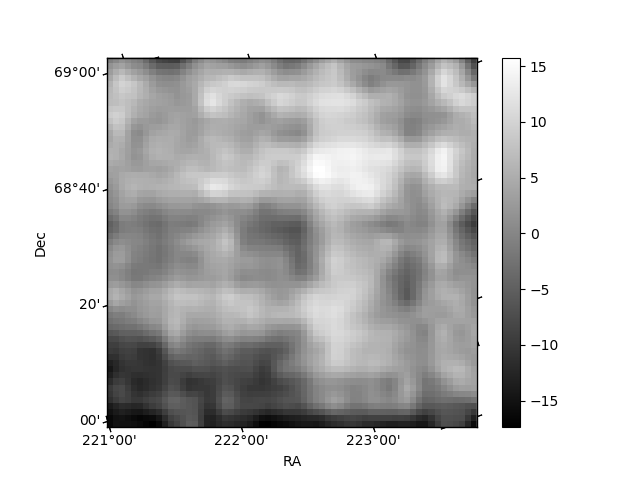
Histogram calculated using DETX and DETY for each event in the final _common_clean file
| Quadrant A | 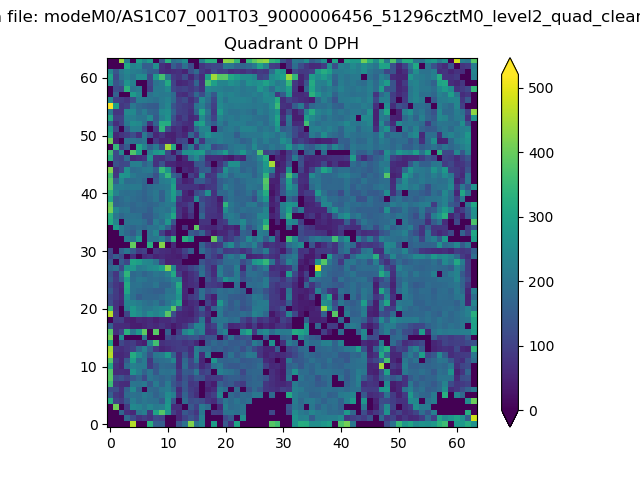 |
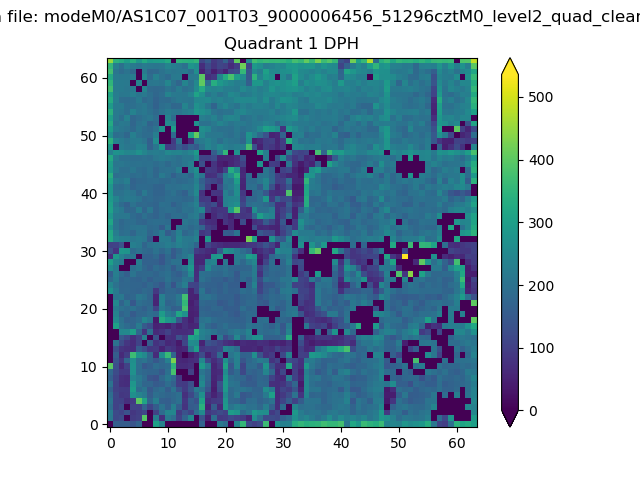 |
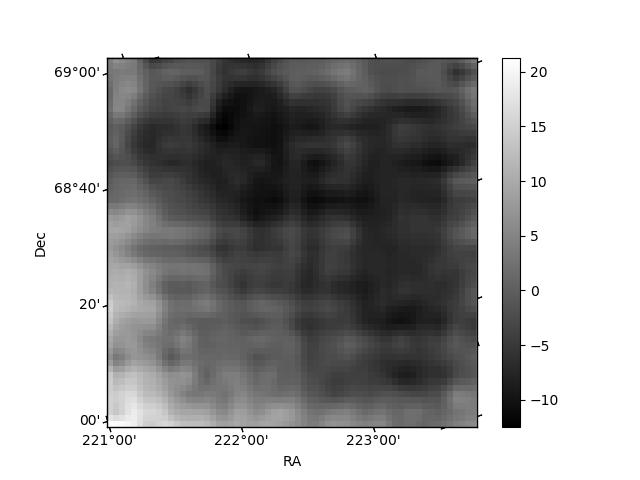
Quadrant B |
|---|---|---|---|
| Quadrant D | 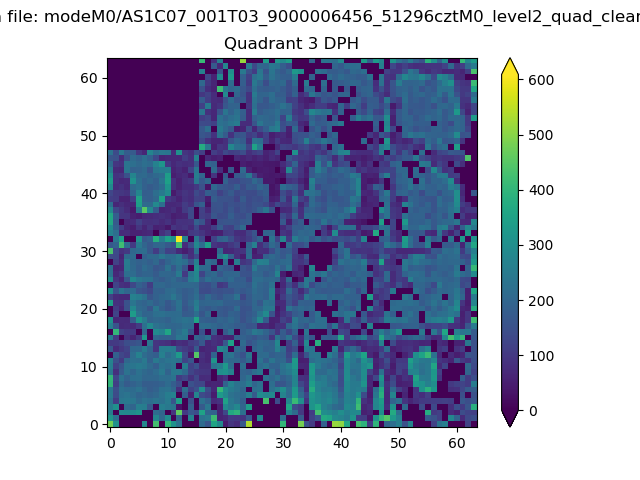 |
 |
Quadrant C |
| Plot type | Count rate plots | Images |
|---|---|---|
| Comparison with Poisson distribution Blue bars denote a histogram of data divided into 1 sec bins. Red curve is a Poisson curve with rate = median count rate of data. |
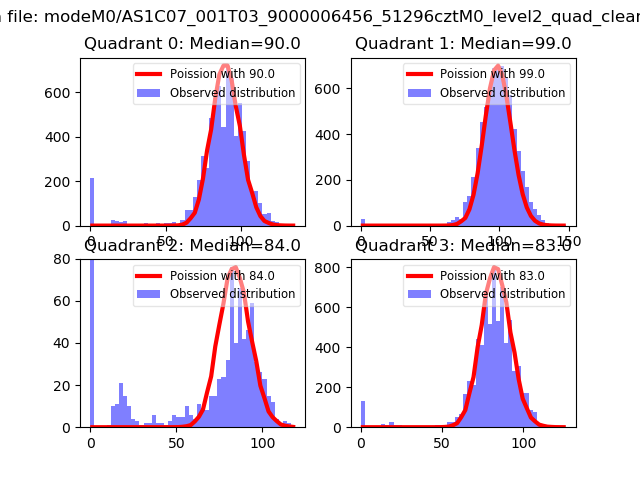 |
 |
| Quadrant-wise count rates Data is divided into 100 sec bins |
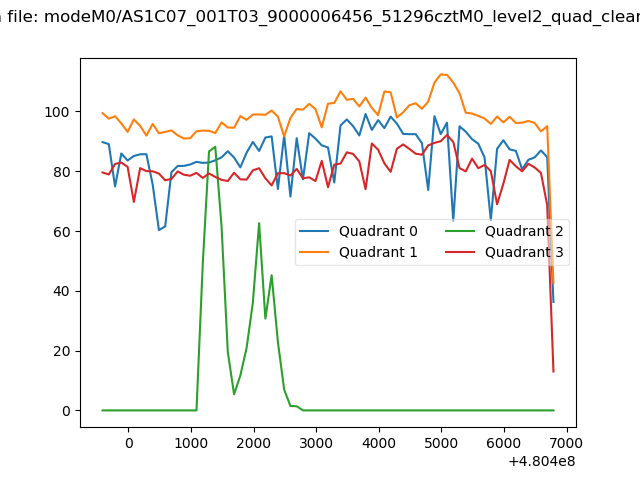 |
|
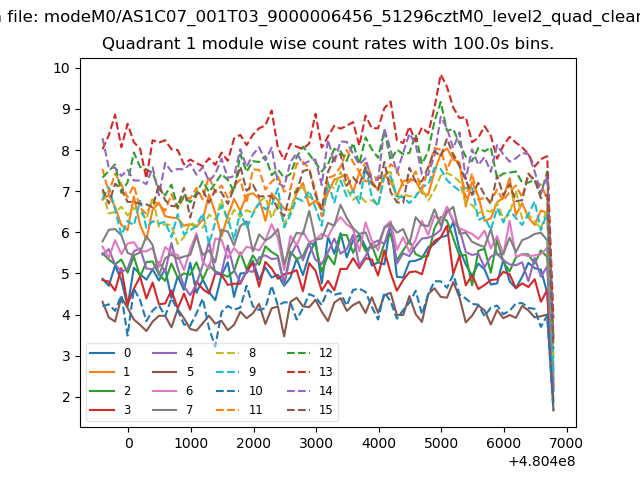
| Module-wise count rates for Quadrant A Data is divided into 100 sec bins |
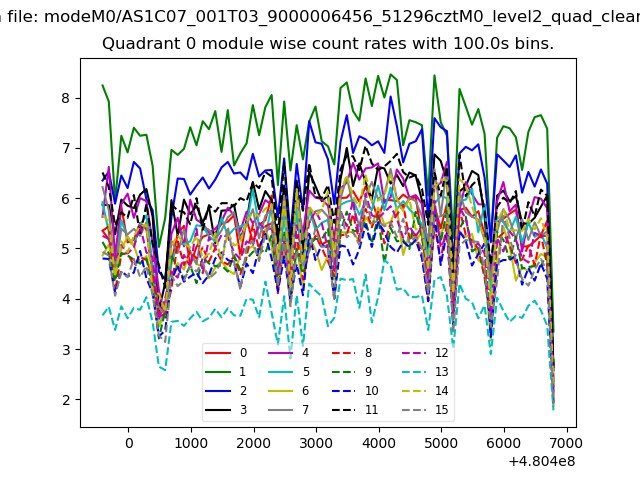 |
 |
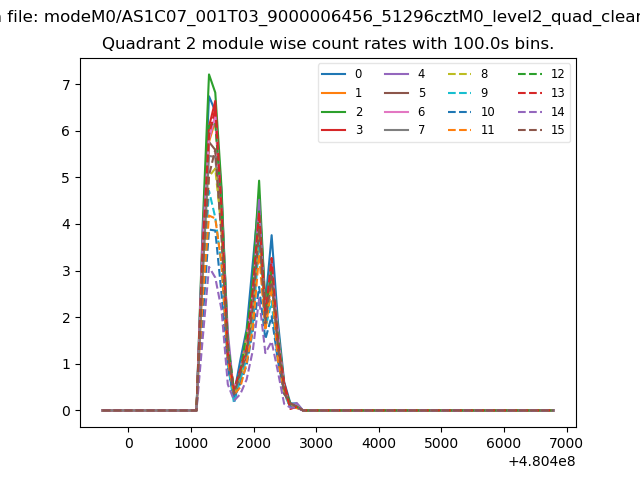
| Module-wise count rates for Quadrant B Data is divided into 100 sec bins |
 |
 |
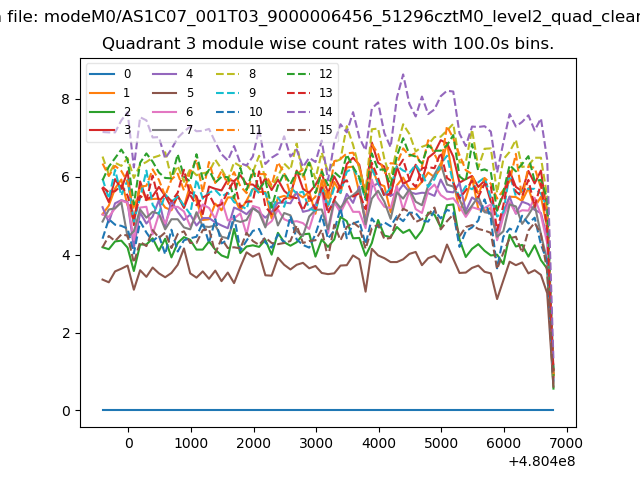
| Module-wise count rates for Quadrant C Data is divided into 100 sec bins |
 |
 |
| Module-wise count rates for Quadrant D Data is divided into 100 sec bins |
 |
 |
| Parameter | Plot |
|---|---|
| CZT HV Monitor | 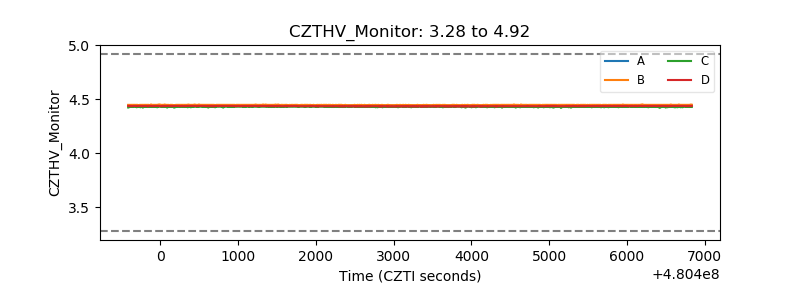 |
| D_VDD | 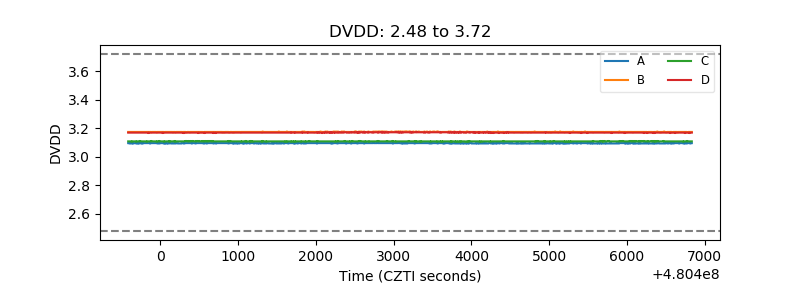 |
| Temperature 1 | 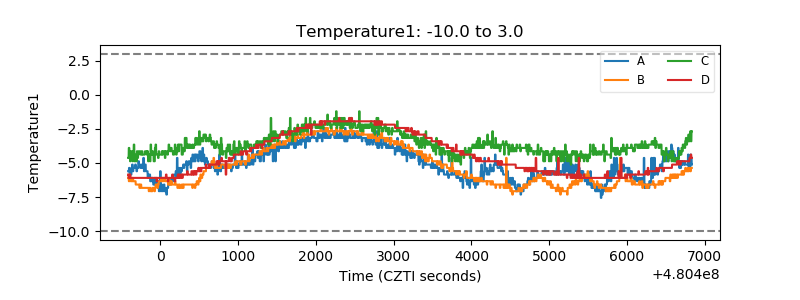 |
| Veto HV Monitor | 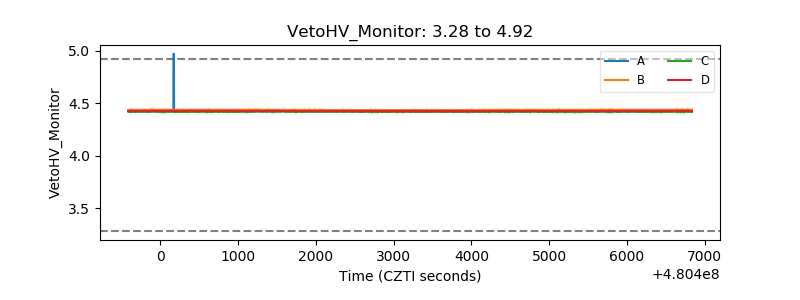 |
| Veto LLD | 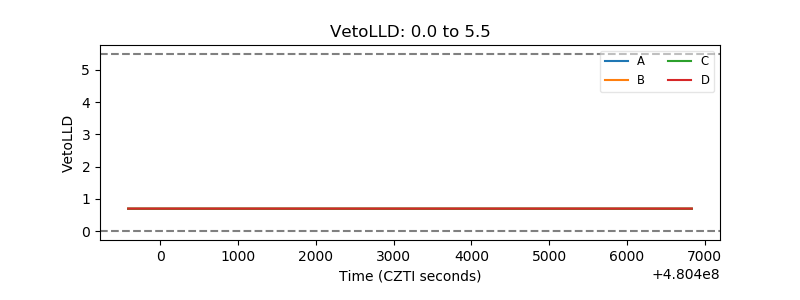 |
| Alpha Counter | 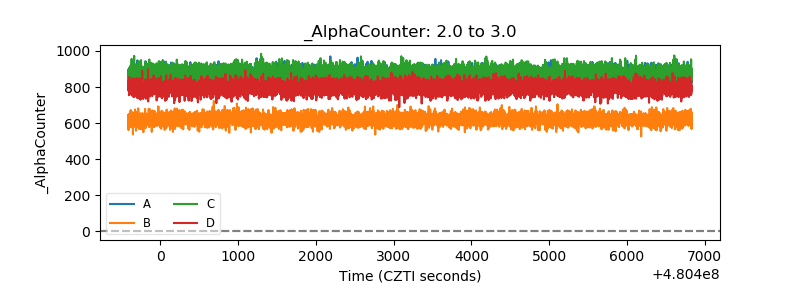 |
| _CPM_Rate | 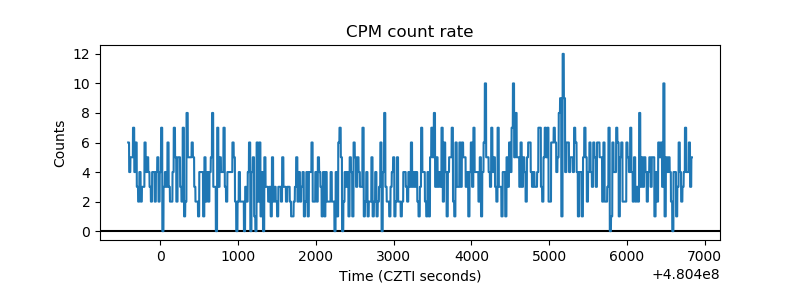 |
| CZT Counter | 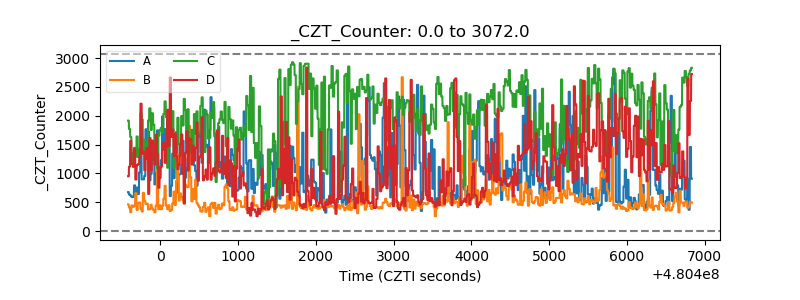 |
| +2.5 Volts monitor | 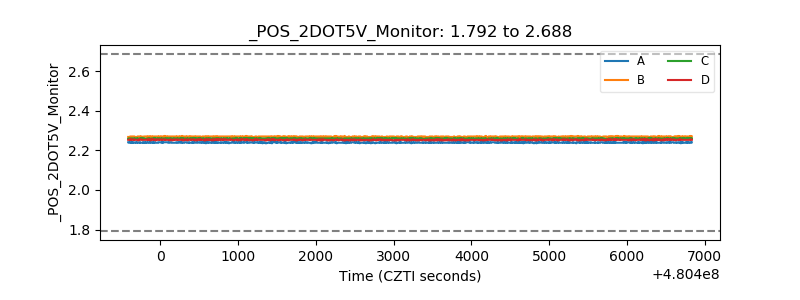 |
| +5 Volts monitor | 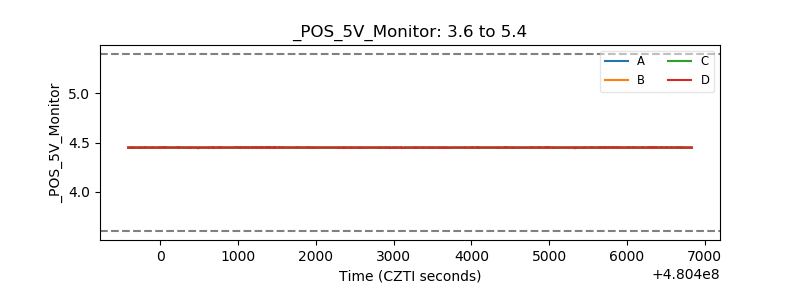 |
| _ROLL_ROT | 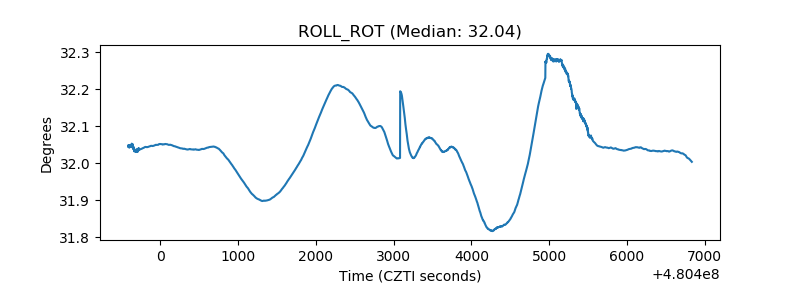 |
| _Roll_DEC | 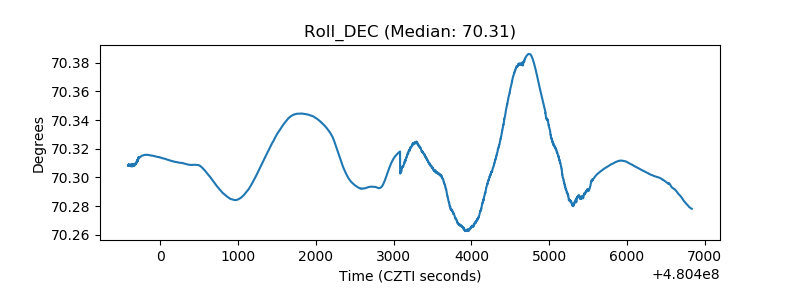 |
| _Roll_RA | 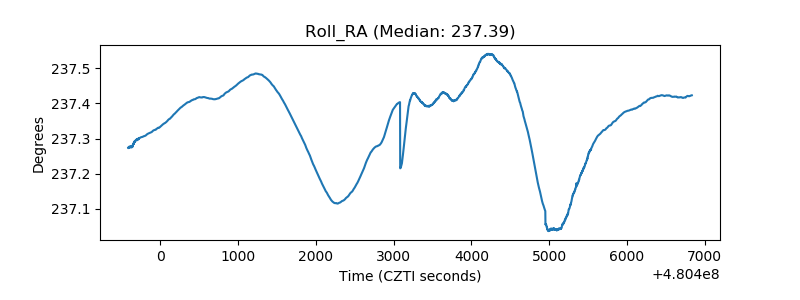 |
| Veto Counter | 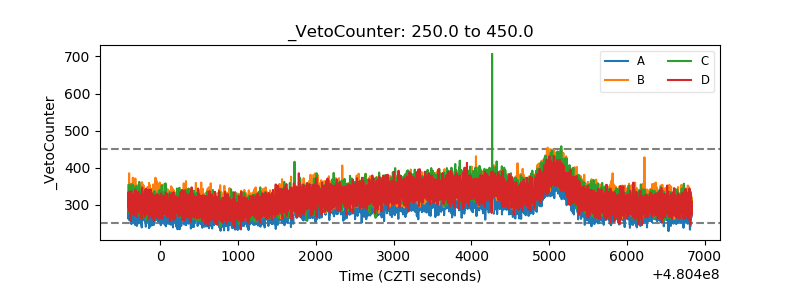 |