| Param | Original file | Final file |
|---|---|---|
| Filename | modeM0/AS1C07_001T03_9000006456_51297cztM0_level2.fits | modeM0/AS1C07_001T03_9000006456_51297cztM0_level2_quad_clean.evt |
| Size (bytes) | 1,054,365,120 | 78,652,800 |
| Size | 1005.5 MB | 75.0 MB |
| Events in quadrant A | 7,310,106 | 587,980 |
| Events in quadrant B | 5,532,318 | 705,908 |
| Events in quadrant C | 17,594,017 | 16,694 |
| Events in quadrant D | 8,033,795 | 566,416 |
| Mode SS | |||
|---|---|---|---|
| Quadrant | BADHDUFLAG | Total packets | Discarded packets |
| A | 0 | 146 | 0 |
| B | 0 | 146 | 0 |
| C | 0 | 146 | 0 |
| D | 0 | 146 | 0 |
| Mode M0 | |||
|---|---|---|---|
| Quadrant | BADHDUFLAG | Total packets | Discarded packets |
| A | 0 | 26835 | 0 |
| B | 0 | 21584 | 0 |
| C | 0 | 57189 | 0 |
| D | 0 | 28934 | 0 |
| Quadrant | Total seconds | Saturated seconds | Saturation percentage |
|---|---|---|---|
| A | 7237 | 824 | 11.385933% |
| B | 7238 | 275 | 3.799392% |
| C | 7238 | 7096 | 98.038132% |
| D | 7238 | 521 | 7.198121% |
Noise dominated data is calculated using 1-second bins in cleaned event files. If a bin has >2000 counts, and if more than 50% of those come from <1% of pixels, then it is considered to be noise-dominated and hence unusable.
| Quadrant | # 1 sec bins | Bins with >0 counts | Bins with >2000 counts | High rate bins dominated by noise | Noise dominated (total time) | Noise dominated (detector-on time) | Marked lightcurve |
|---|---|---|---|---|---|---|---|
| A | 7237 | 7237 | 578 | 578 | 7.99% | 7.99% | 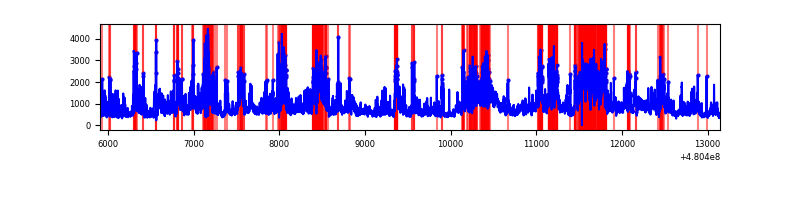 |
| B | 7238 | 7238 | 121 | 121 | 1.67% | 1.67% | 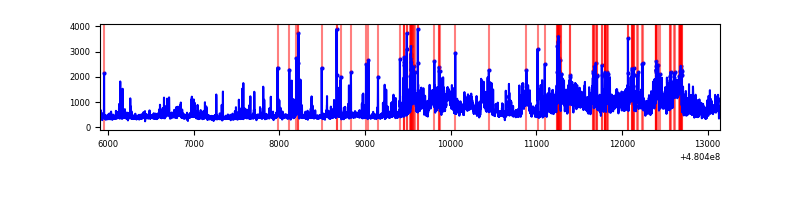 |
| C | 7238 | 7238 | 5855 | 5855 | 80.89% | 80.89% | 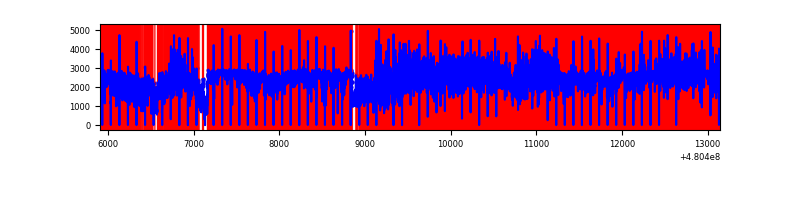 |
| D | 7238 | 7238 | 637 | 637 | 8.80% | 8.80% | 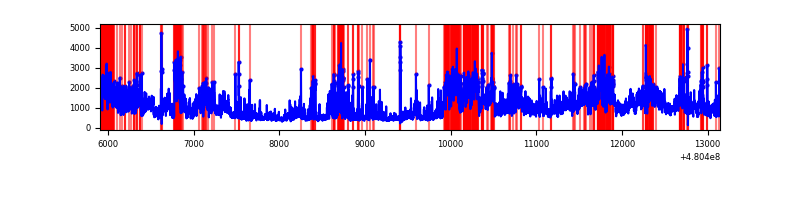 |
Top three noisy pixels from each quadrant. If the there are fewer than three noisy pixels in the level2.evt file, extra rows are filled as -1
| Pixel properties | Quadrant properties | ||||||
|---|---|---|---|---|---|---|---|
| Quadrant | DetID | PixID | Counts | Sigma | Mean | Median | Sigma |
| A | 12 | 250 | 1922759 | 11042.76 | 701 | 684 | 174.1 |
| A | 12 | 3 | 1105796 | 6349.12 | 701 | 684 | 174.1 |
| A | 9 | 191 | 428561 | 2458.25 | 701 | 684 | 174.1 |
| B | 10 | 254 | 1937502 | 12415.19 | 730 | 705 | 156.0 |
| B | 10 | 247 | 185476 | 1184.41 | 730 | 705 | 156.0 |
| B | 5 | 172 | 114427 | 728.98 | 730 | 705 | 156.0 |
| C | 15 | 198 | 14561118 | 351132.63 | 143 | 141 | 41.5 |
| C | 4 | 12 | 2103082 | 50711.65 | 143 | 141 | 41.5 |
| C | 12 | 252 | 70795 | 1703.8 | 143 | 141 | 41.5 |
| D | 8 | 176 | 3154968 | 16173.31 | 692 | 667 | 195.0 |
| D | 7 | 60 | 713089 | 3652.86 | 692 | 667 | 195.0 |
| D | 11 | 176 | 273736 | 1400.13 | 692 | 667 | 195.0 |
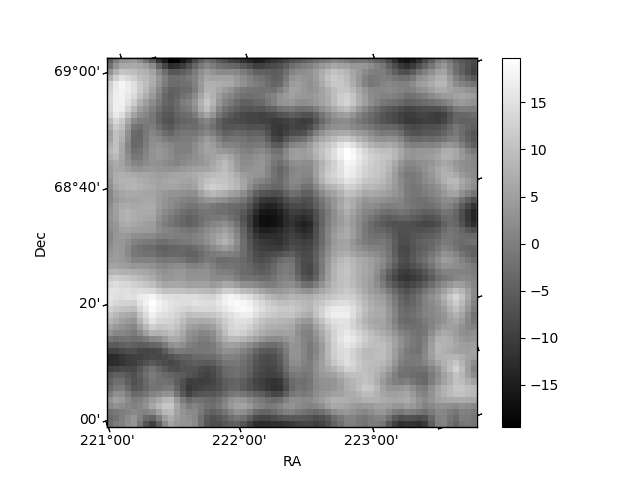
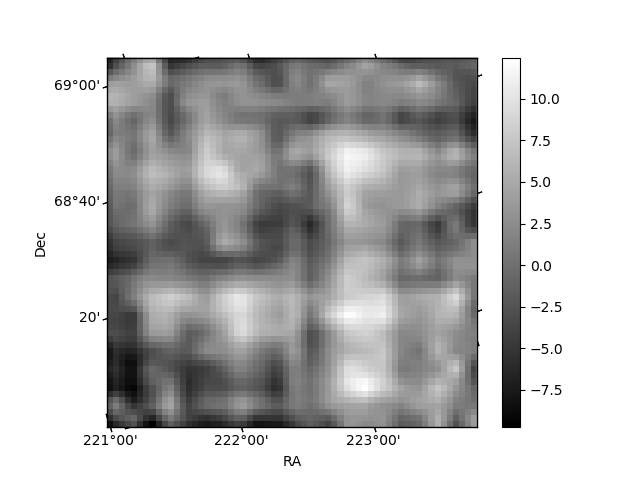
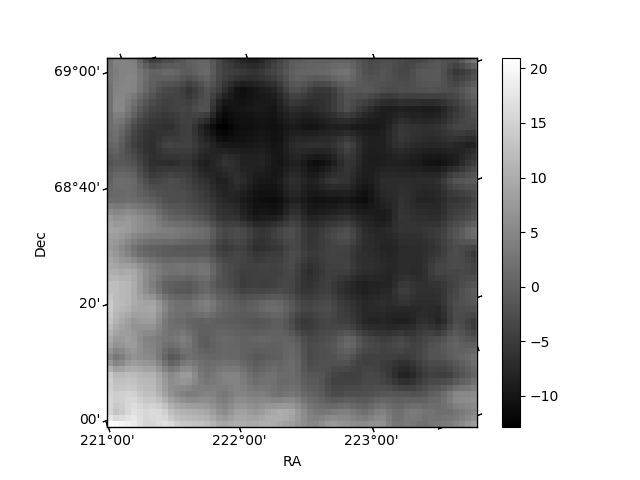
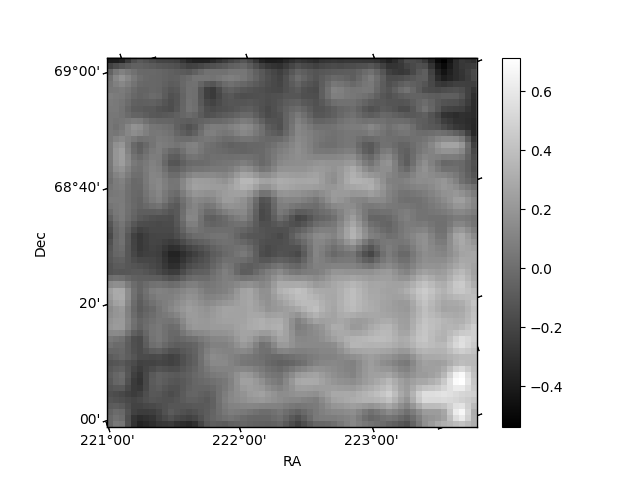
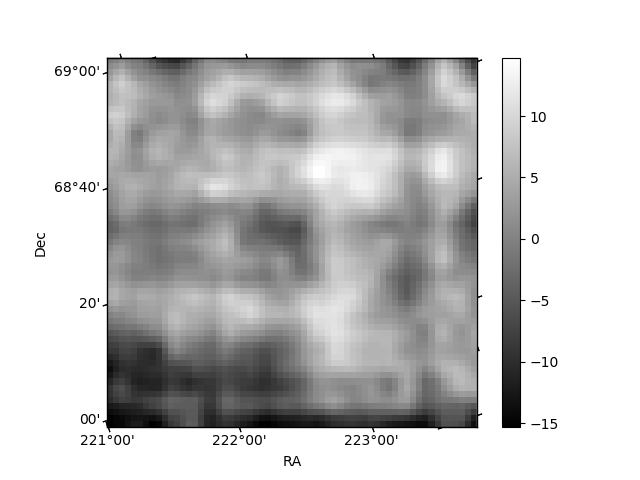
Histogram calculated using DETX and DETY for each event in the final _common_clean file
| Quadrant A | 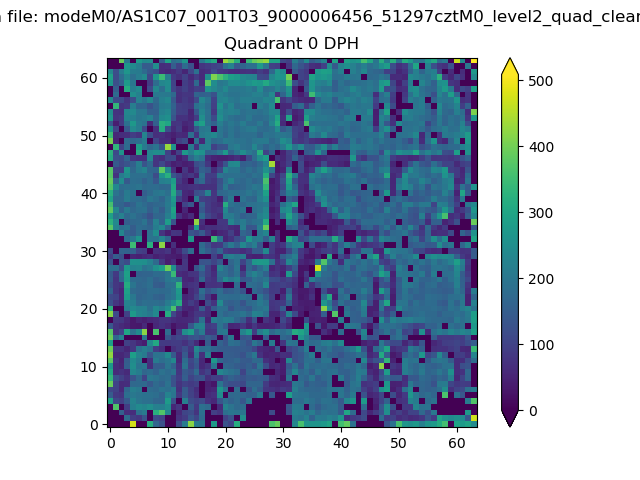 |
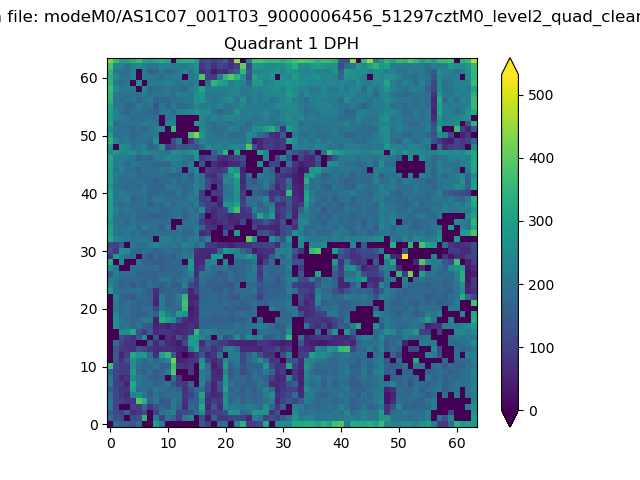 |
Quadrant B |
|---|---|---|---|
| Quadrant D | 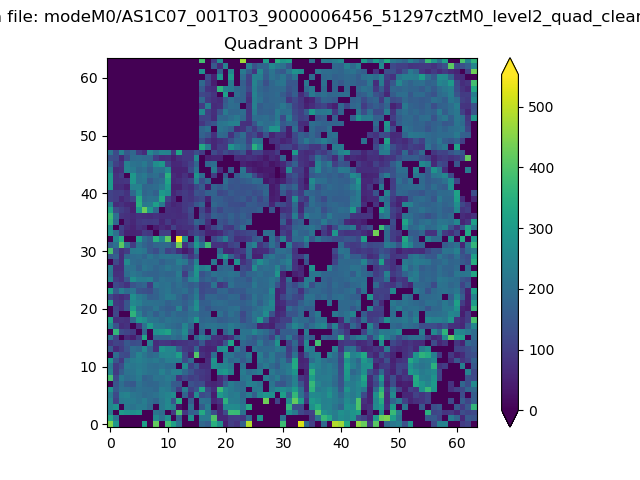 |
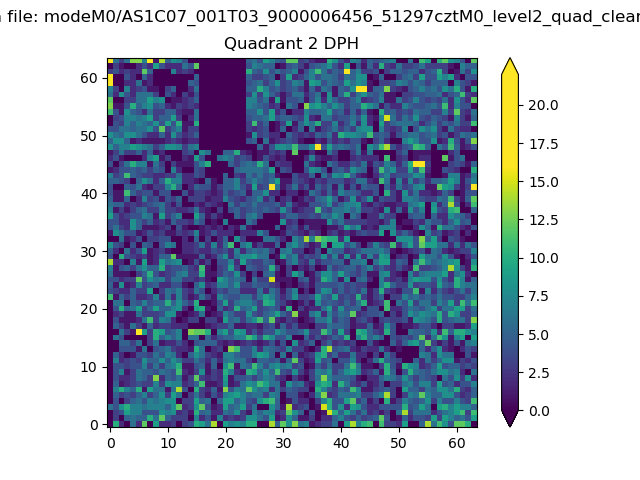 |
Quadrant C |
| Plot type | Count rate plots | Images |
|---|---|---|
| Comparison with Poisson distribution Blue bars denote a histogram of data divided into 1 sec bins. Red curve is a Poisson curve with rate = median count rate of data. |
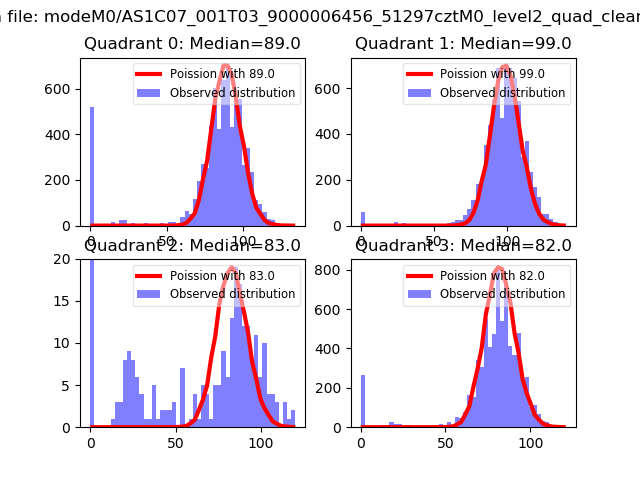 |
 |
| Quadrant-wise count rates Data is divided into 100 sec bins |
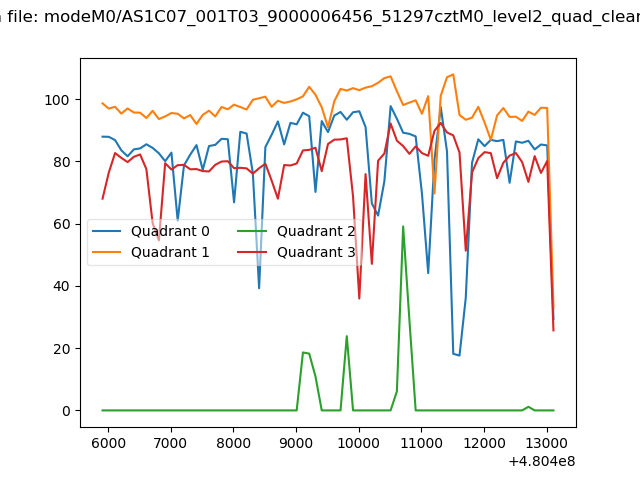 |
|
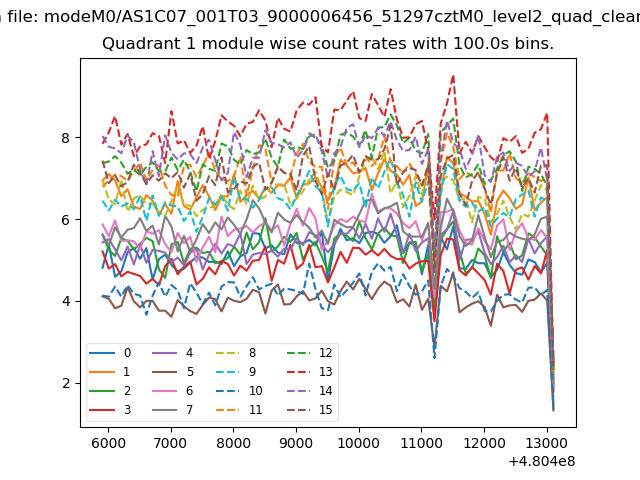
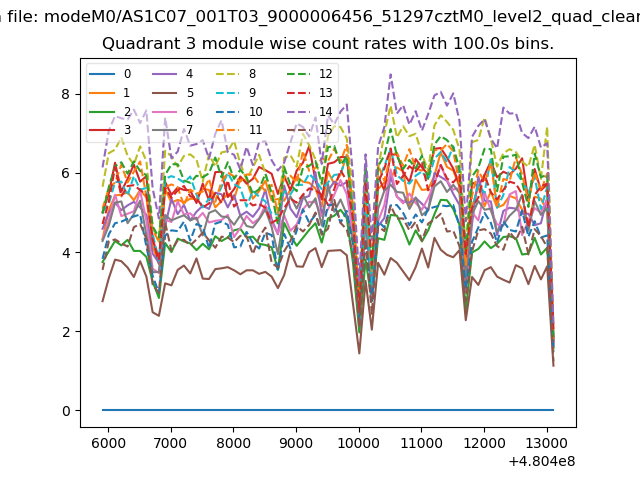
| Module-wise count rates for Quadrant A Data is divided into 100 sec bins |
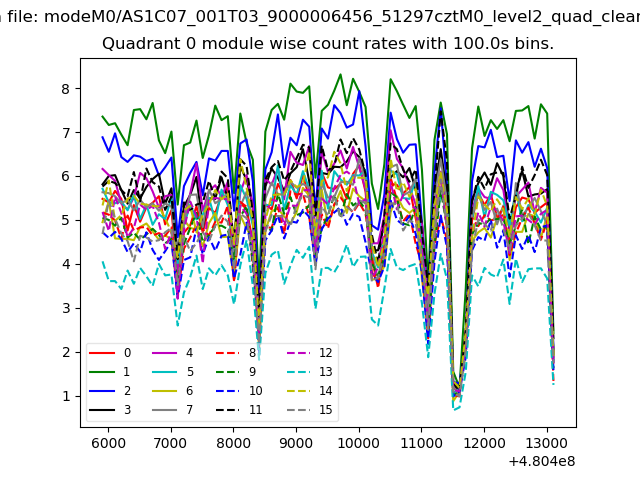 |
 |
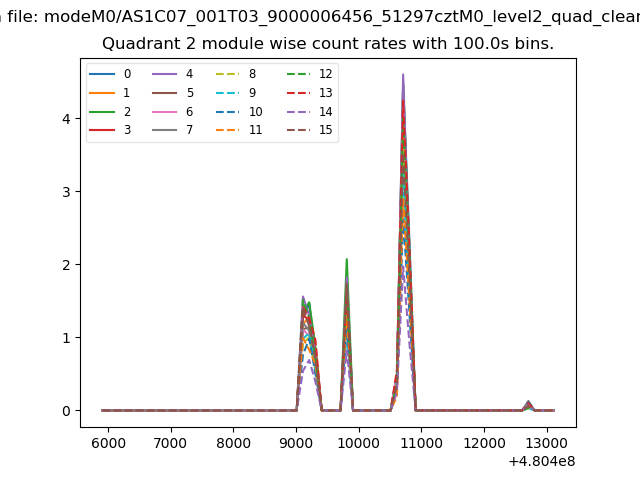
| Module-wise count rates for Quadrant B Data is divided into 100 sec bins |
 |
 |
| Module-wise count rates for Quadrant C Data is divided into 100 sec bins |
 |
 |
| Module-wise count rates for Quadrant D Data is divided into 100 sec bins |
 |
 |
| Parameter | Plot |
|---|---|
| CZT HV Monitor | 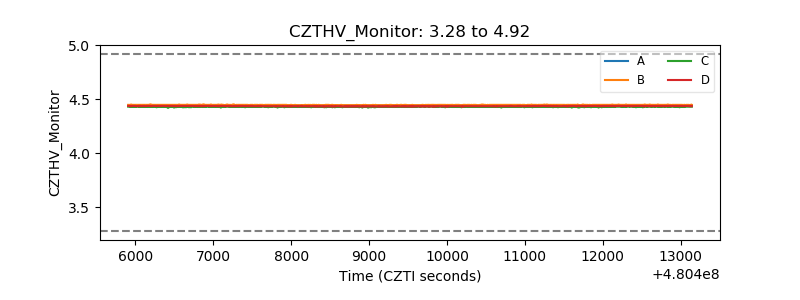 |
| D_VDD | 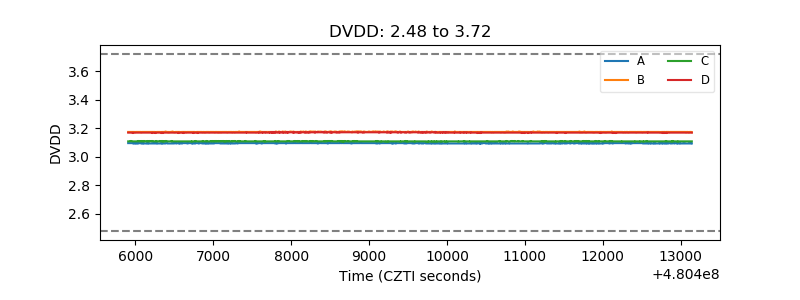 |
| Temperature 1 | 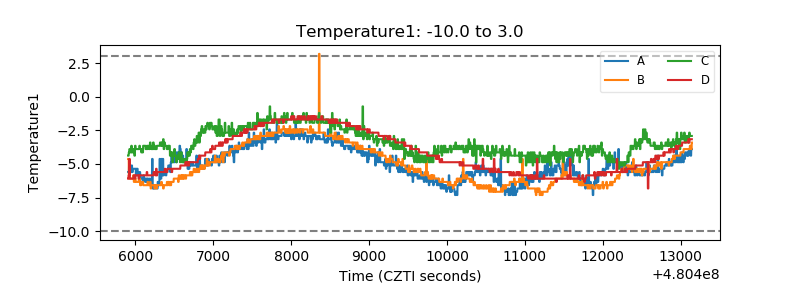 |
| Veto HV Monitor | 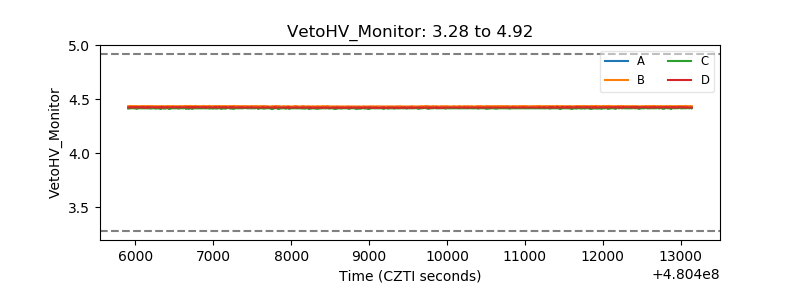 |
| Veto LLD | 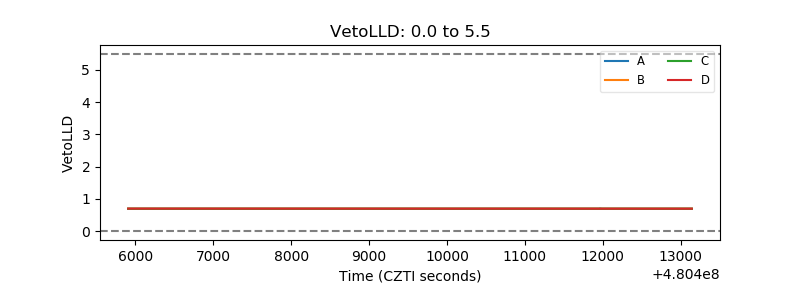 |
| Alpha Counter | 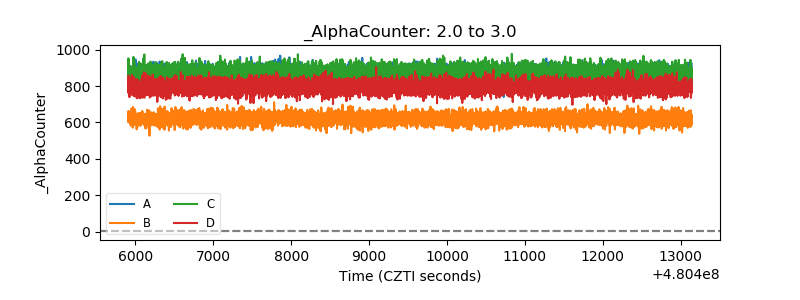 |
| _CPM_Rate | 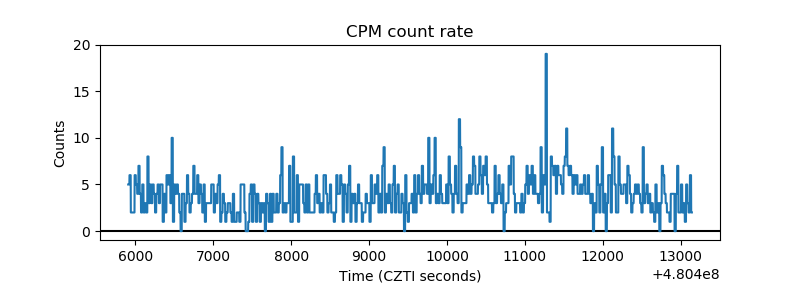 |
| CZT Counter | 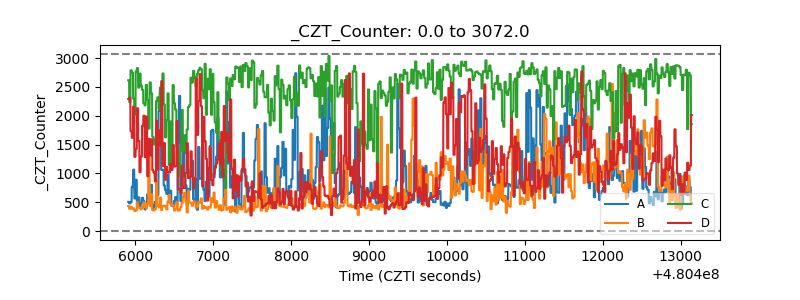 |
| +2.5 Volts monitor |  |
| +5 Volts monitor | 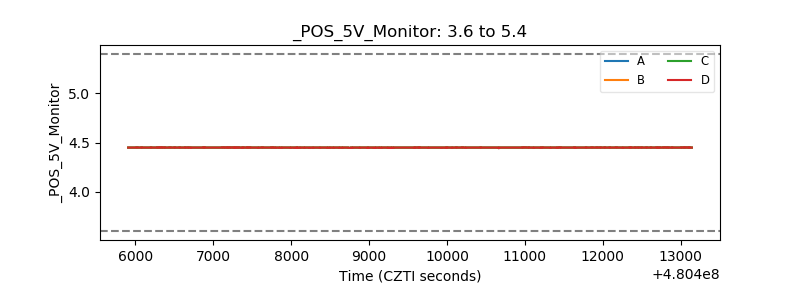 |
| _ROLL_ROT | 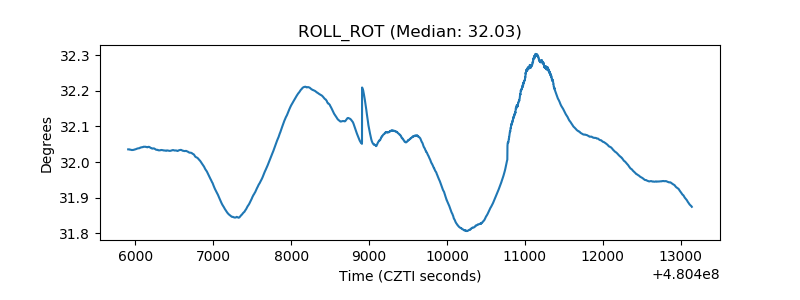 |
| _Roll_DEC | 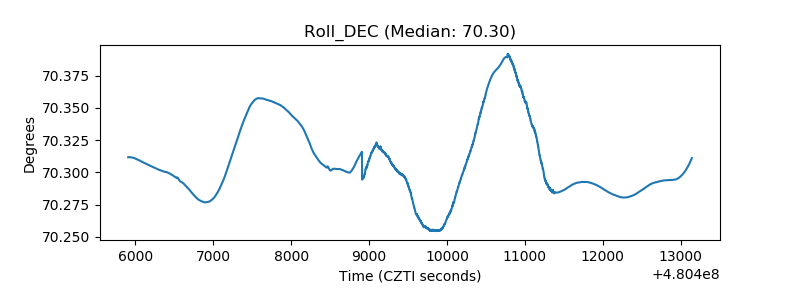 |
| _Roll_RA | 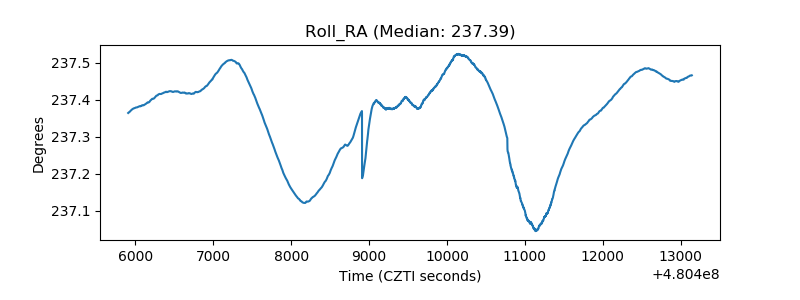 |
| Veto Counter | 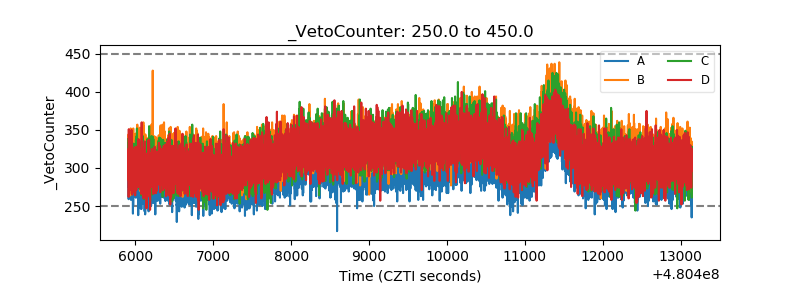 |