| Param | Original file | Final file |
|---|---|---|
| Filename | modeM0/AS1C07_001T03_9000006456_51301cztM0_level2.fits | modeM0/AS1C07_001T03_9000006456_51301cztM0_level2_quad_clean.evt |
| Size (bytes) | 912,479,040 | 83,888,640 |
| Size | 870.2 MB | 80.0 MB |
| Events in quadrant A | 6,213,220 | 624,290 |
| Events in quadrant B | 6,055,967 | 670,341 |
| Events in quadrant C | 15,293,853 | 200,535 |
| Events in quadrant D | 5,675,399 | 558,547 |
| Mode SS | |||
|---|---|---|---|
| Quadrant | BADHDUFLAG | Total packets | Discarded packets |
| A | 0 | 142 | 0 |
| B | 0 | 142 | 0 |
| C | 0 | 142 | 0 |
| D | 0 | 142 | 0 |
| Mode M0 | |||
|---|---|---|---|
| Quadrant | BADHDUFLAG | Total packets | Discarded packets |
| A | 0 | 23321 | 1 |
| B | 0 | 22799 | 1 |
| C | 0 | 50168 | 1 |
| D | 0 | 21764 | 1 |
| Mode M9 | |||
|---|---|---|---|
| Quadrant | BADHDUFLAG | Total packets | Discarded packets |
| A | 0 | 7 | 0 |
| B | 0 | 7 | 0 |
| C | 0 | 7 | 0 |
| D | 0 | 7 | 0 |
| Quadrant | Total seconds | Saturated seconds | Saturation percentage |
|---|---|---|---|
| A | 6974 | 355 | 5.090336% |
| B | 6973 | 583 | 8.360820% |
| C | 6973 | 5005 | 71.776854% |
| D | 6974 | 414 | 5.936335% |
Noise dominated data is calculated using 1-second bins in cleaned event files. If a bin has >2000 counts, and if more than 50% of those come from <1% of pixels, then it is considered to be noise-dominated and hence unusable.
| Quadrant | # 1 sec bins | Bins with >0 counts | Bins with >2000 counts | High rate bins dominated by noise | Noise dominated (total time) | Noise dominated (detector-on time) | Marked lightcurve |
|---|---|---|---|---|---|---|---|
| A | 7744 | 6975 | 134 | 134 | 1.73% | 1.92% | 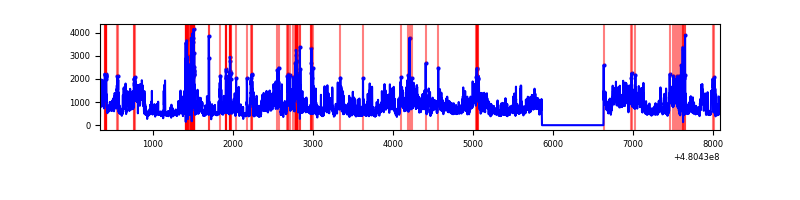 |
| B | 7743 | 6974 | 292 | 292 | 3.77% | 4.19% | 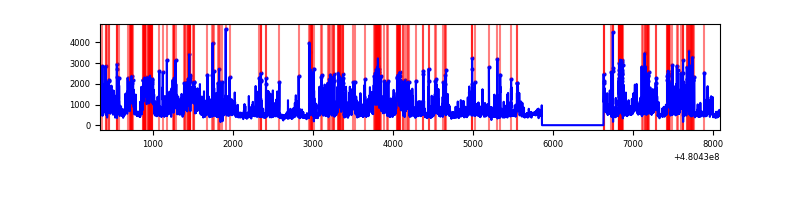 |
| C | 7742 | 6971 | 4472 | 4472 | 57.76% | 64.15% | 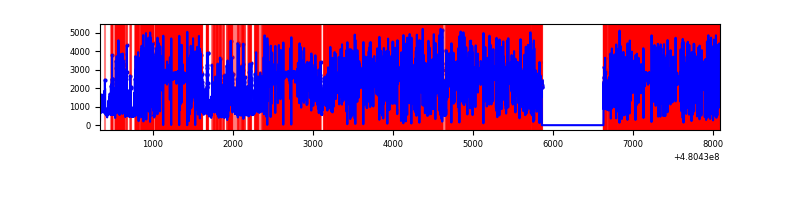 |
| D | 7744 | 6975 | 252 | 252 | 3.25% | 3.61% | 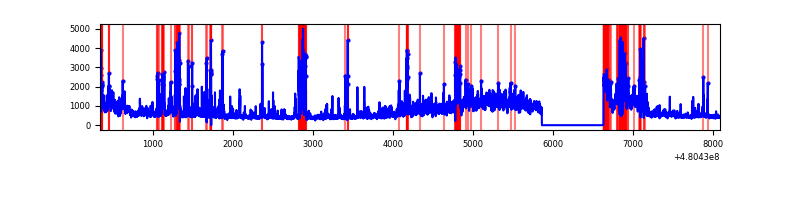 |
Top three noisy pixels from each quadrant. If the there are fewer than three noisy pixels in the level2.evt file, extra rows are filled as -1
| Pixel properties | Quadrant properties | ||||||
|---|---|---|---|---|---|---|---|
| Quadrant | DetID | PixID | Counts | Sigma | Mean | Median | Sigma |
| A | 12 | 3 | 1920576 | 10598.78 | 736 | 718 | 181.1 |
| A | 9 | 191 | 290175 | 1597.98 | 736 | 718 | 181.1 |
| A | 12 | 250 | 256246 | 1410.67 | 736 | 718 | 181.1 |
| B | 10 | 254 | 1604606 | 10377.25 | 726 | 702 | 154.6 |
| B | 5 | 172 | 633457 | 4093.92 | 726 | 702 | 154.6 |
| B | 5 | 185 | 198082 | 1277.05 | 726 | 702 | 154.6 |
| C | 4 | 12 | 11607782 | 108438.01 | 383 | 379 | 107.0 |
| C | 15 | 219 | 1162369 | 10855.48 | 383 | 379 | 107.0 |
| C | 12 | 247 | 303661 | 2833.3 | 383 | 379 | 107.0 |
| D | 8 | 176 | 1705900 | 8610.76 | 708 | 683 | 198.0 |
| D | 2 | 62 | 214871 | 1081.58 | 708 | 683 | 198.0 |
| D | 12 | 128 | 160515 | 807.1 | 708 | 683 | 198.0 |
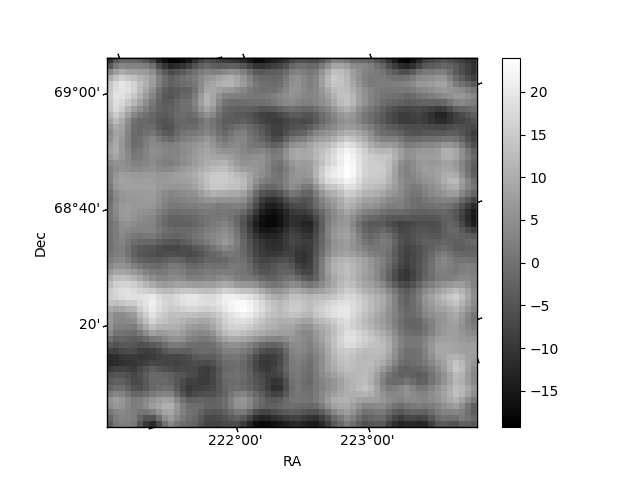
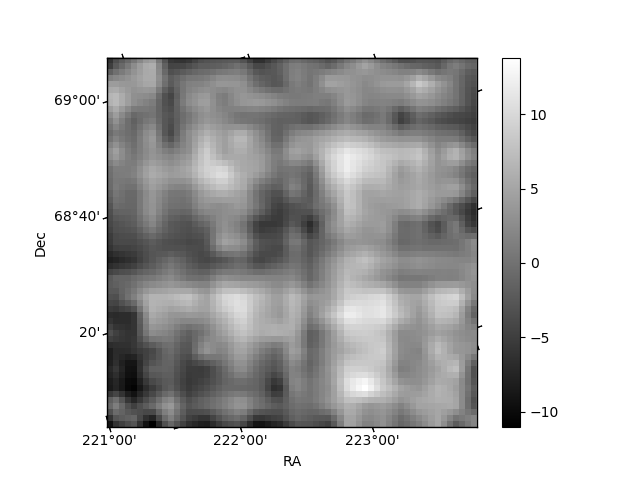
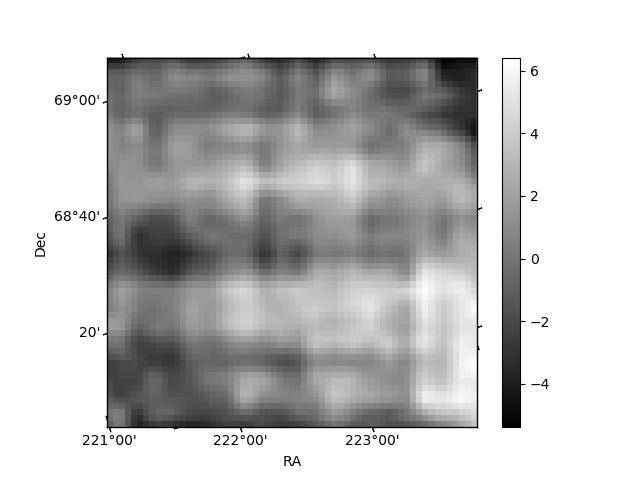
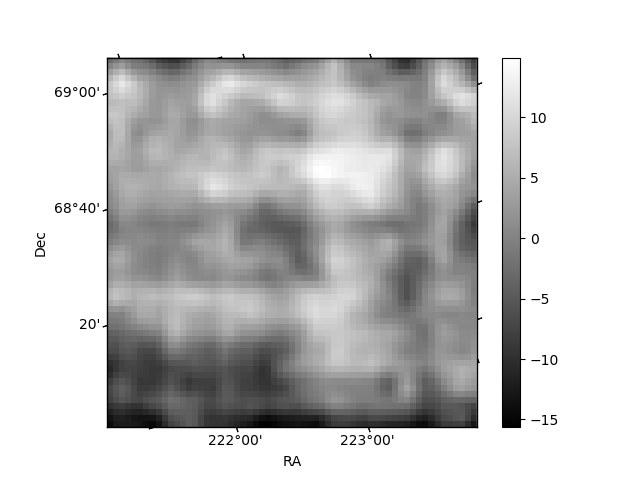
Histogram calculated using DETX and DETY for each event in the final _common_clean file
| Quadrant A | 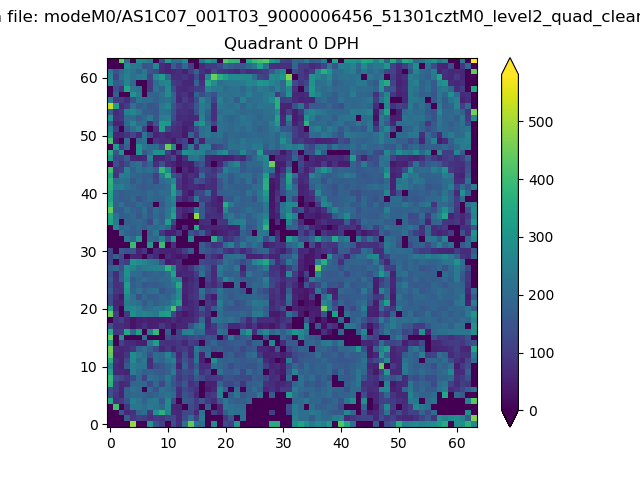 |
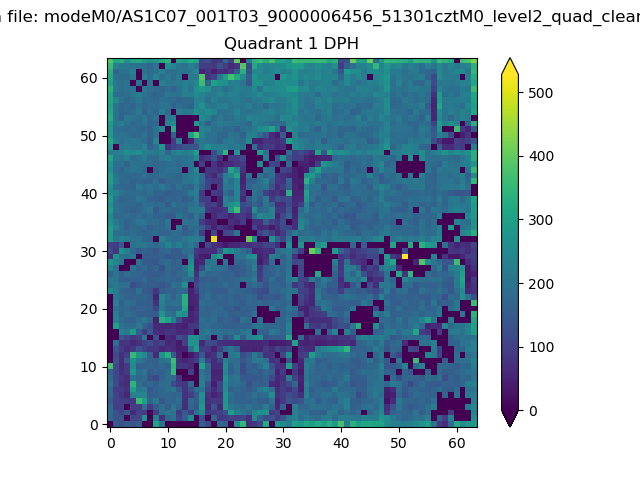 |
Quadrant B |
|---|---|---|---|
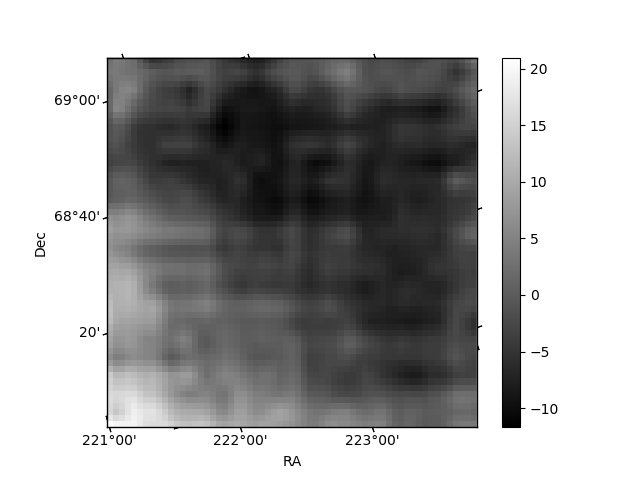
| Quadrant D | 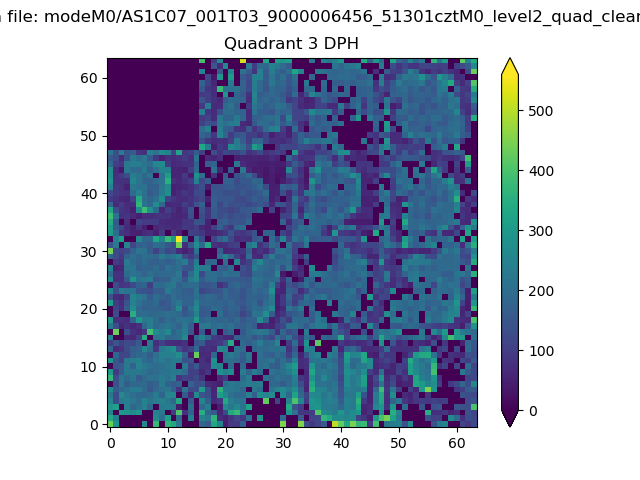 |
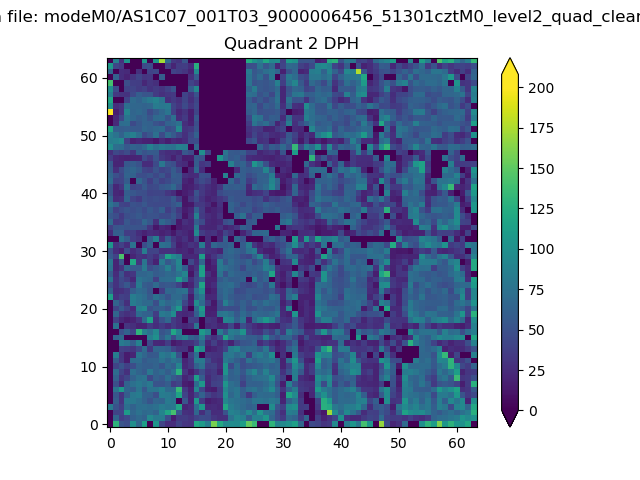 |
Quadrant C |
| Plot type | Count rate plots | Images |
|---|---|---|
| Comparison with Poisson distribution Blue bars denote a histogram of data divided into 1 sec bins. Red curve is a Poisson curve with rate = median count rate of data. |
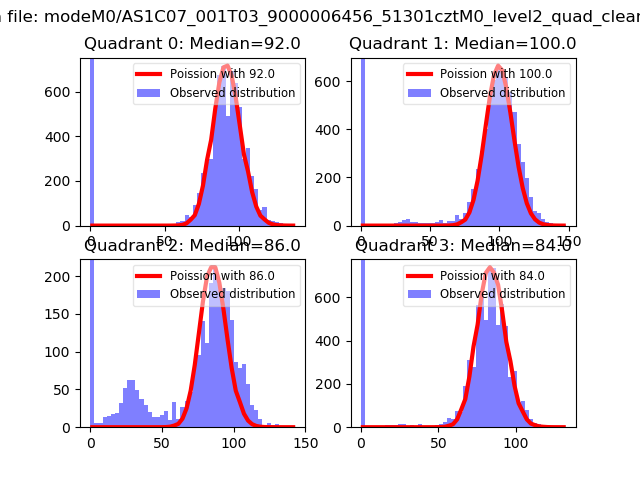 |
 |
| Quadrant-wise count rates Data is divided into 100 sec bins |
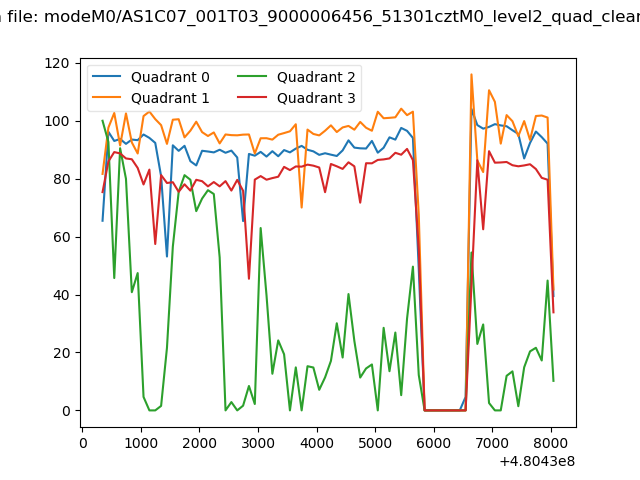 |
|
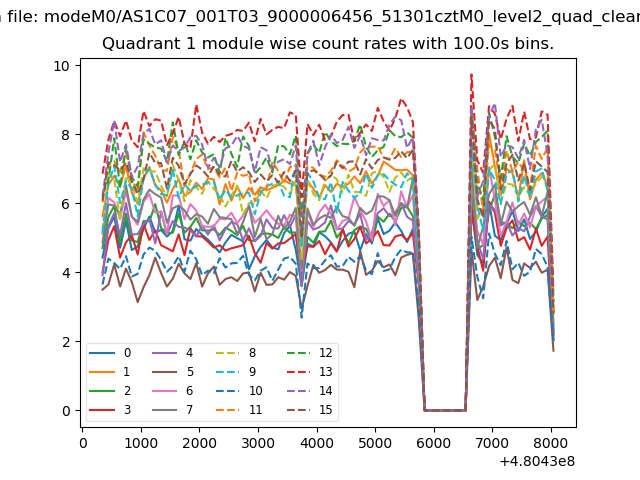
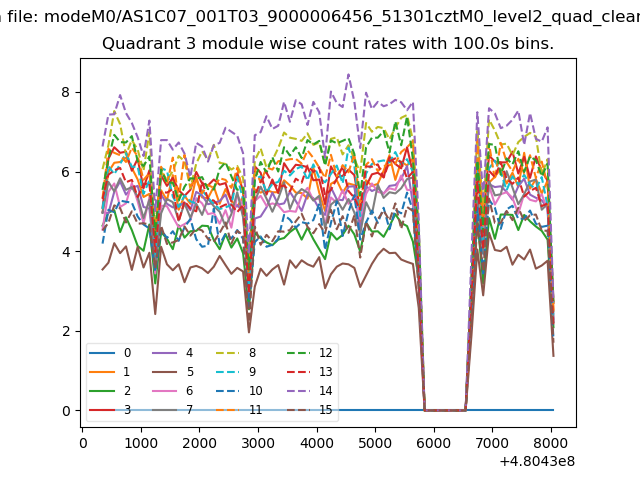
| Module-wise count rates for Quadrant A Data is divided into 100 sec bins |
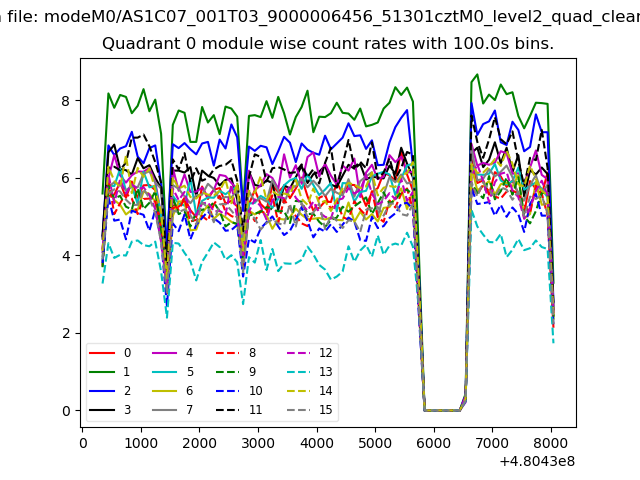 |
 |
| Module-wise count rates for Quadrant B Data is divided into 100 sec bins |
 |
 |
| Module-wise count rates for Quadrant C Data is divided into 100 sec bins |
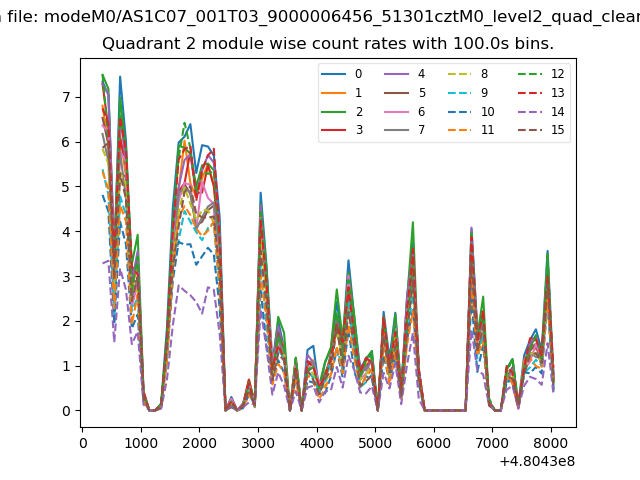 |
 |
| Module-wise count rates for Quadrant D Data is divided into 100 sec bins |
 |
 |
| Parameter | Plot |
|---|---|
| CZT HV Monitor | 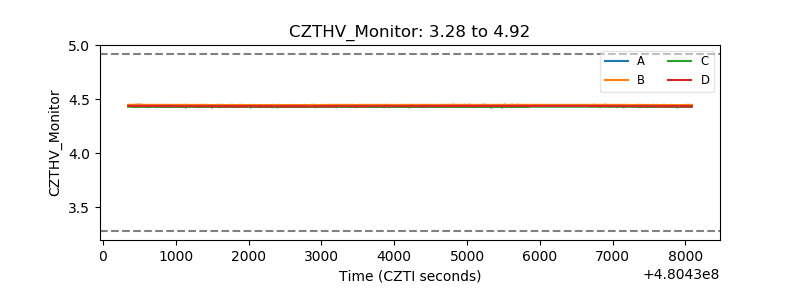 |
| D_VDD | 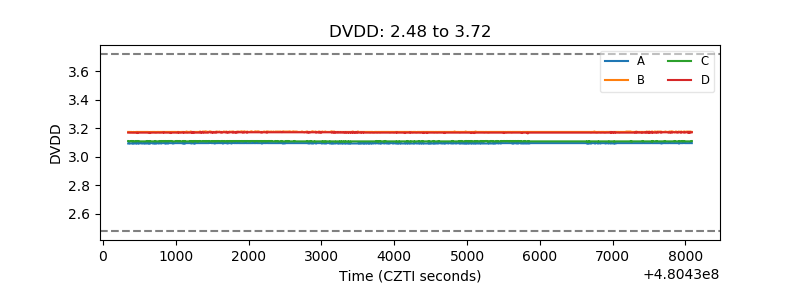 |
| Temperature 1 | 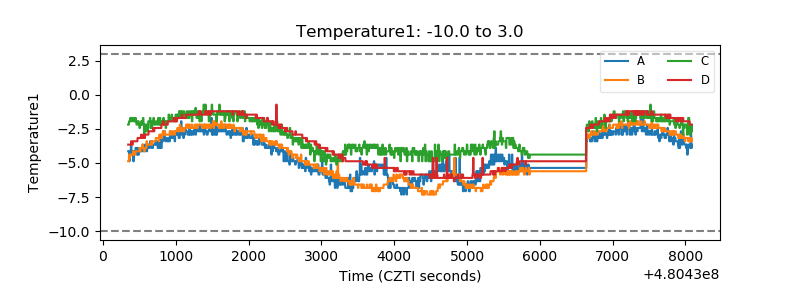 |
| Veto HV Monitor | 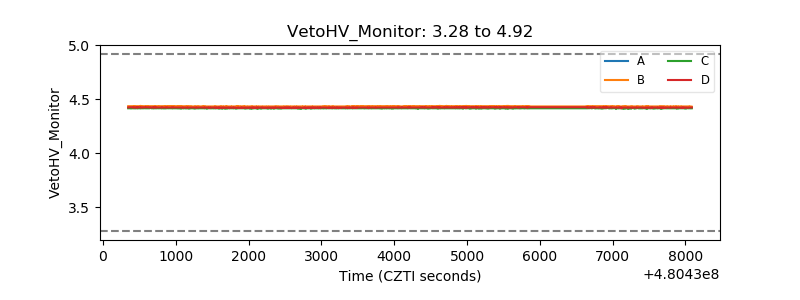 |
| Veto LLD | 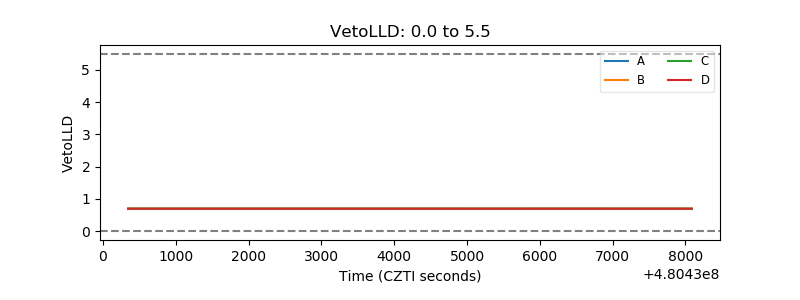 |
| Alpha Counter | 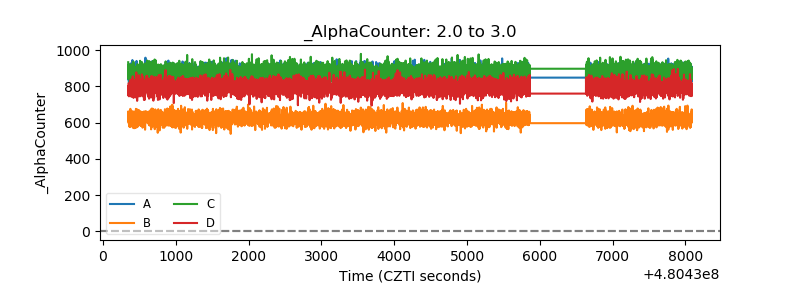 |
| _CPM_Rate | 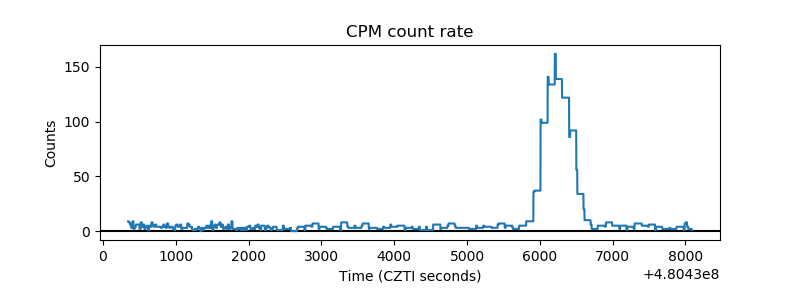 |
| CZT Counter | 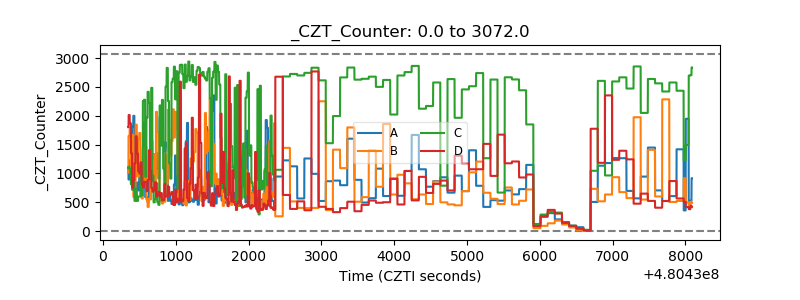 |
| +2.5 Volts monitor | 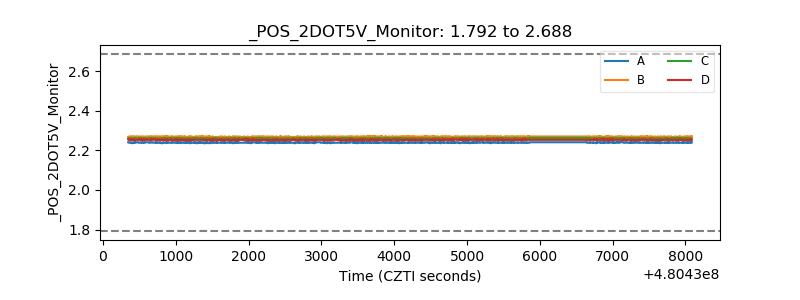 |
| +5 Volts monitor | 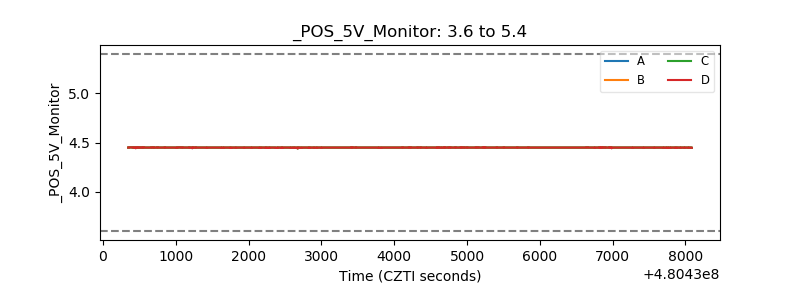 |
| _ROLL_ROT | 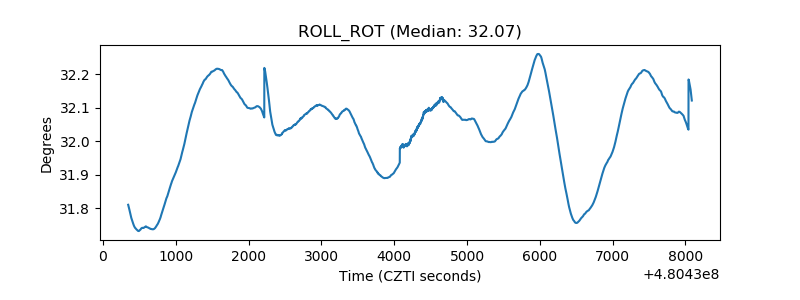 |
| _Roll_DEC | 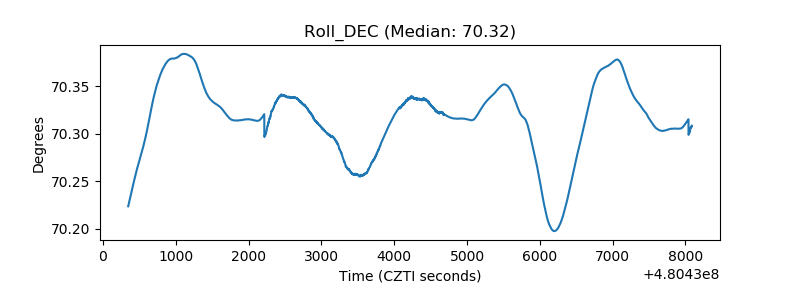 |
| _Roll_RA | 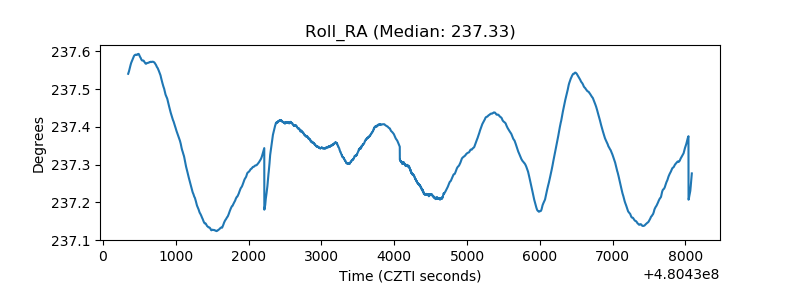 |
| Veto Counter | 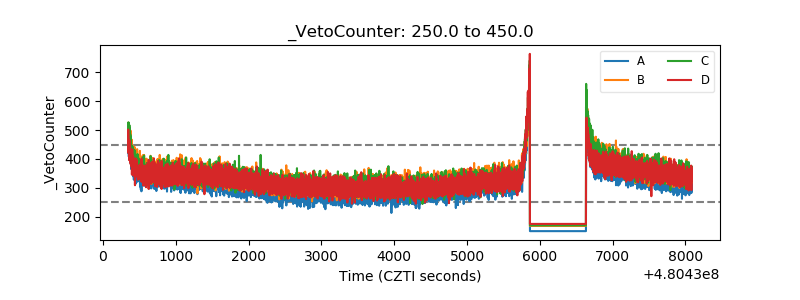 |