| Param | Original file | Final file |
|---|---|---|
| Filename | modeM0/AS1C07_001T03_9000006456_51302cztM0_level2.fits | modeM0/AS1C07_001T03_9000006456_51302cztM0_level2_quad_clean.evt |
| Size (bytes) | 741,323,520 | 79,663,680 |
| Size | 707.0 MB | 76.0 MB |
| Events in quadrant A | 5,981,831 | 578,359 |
| Events in quadrant B | 4,257,527 | 630,433 |
| Events in quadrant C | 12,505,914 | 229,121 |
| Events in quadrant D | 4,204,847 | 531,005 |
| Mode SS | |||
|---|---|---|---|
| Quadrant | BADHDUFLAG | Total packets | Discarded packets |
| A | 0 | 130 | 0 |
| B | 0 | 130 | 0 |
| C | 0 | 130 | 0 |
| D | 0 | 130 | 0 |
| Mode M0 | |||
|---|---|---|---|
| Quadrant | BADHDUFLAG | Total packets | Discarded packets |
| A | 0 | 22122 | 1 |
| B | 0 | 17053 | 1 |
| C | 0 | 41496 | 1 |
| D | 0 | 16864 | 1 |
| Mode M9 | |||
|---|---|---|---|
| Quadrant | BADHDUFLAG | Total packets | Discarded packets |
| A | 0 | 9 | 0 |
| B | 0 | 9 | 0 |
| C | 0 | 9 | 0 |
| D | 0 | 9 | 0 |
| Quadrant | Total seconds | Saturated seconds | Saturation percentage |
|---|---|---|---|
| A | 6342 | 326 | 5.140334% |
| B | 6343 | 300 | 4.729623% |
| C | 6343 | 4047 | 63.802617% |
| D | 6343 | 155 | 2.443639% |
Noise dominated data is calculated using 1-second bins in cleaned event files. If a bin has >2000 counts, and if more than 50% of those come from <1% of pixels, then it is considered to be noise-dominated and hence unusable.
| Quadrant | # 1 sec bins | Bins with >0 counts | Bins with >2000 counts | High rate bins dominated by noise | Noise dominated (total time) | Noise dominated (detector-on time) | Marked lightcurve |
|---|---|---|---|---|---|---|---|
| A | 7322 | 6343 | 293 | 293 | 4.00% | 4.62% | 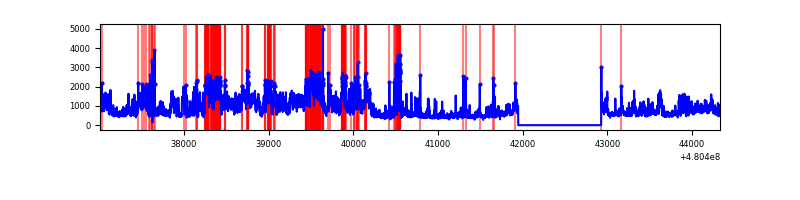 |
| B | 7323 | 6344 | 132 | 132 | 1.80% | 2.08% | 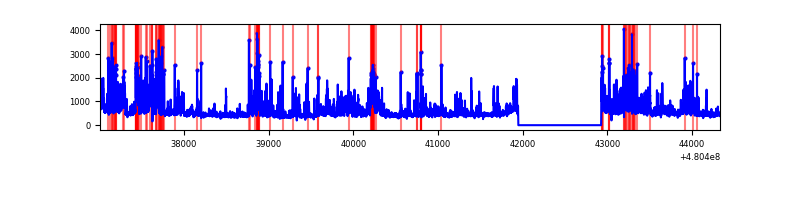 |
| C | 7323 | 6344 | 3489 | 3489 | 47.64% | 55.00% | 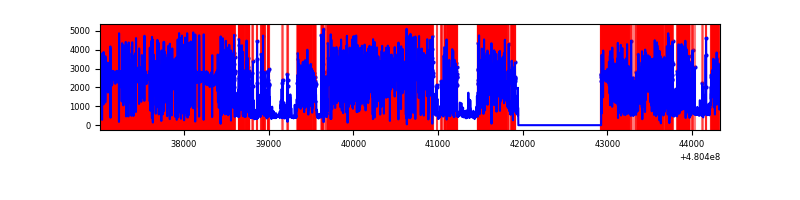 |
| D | 7323 | 6344 | 93 | 93 | 1.27% | 1.47% | 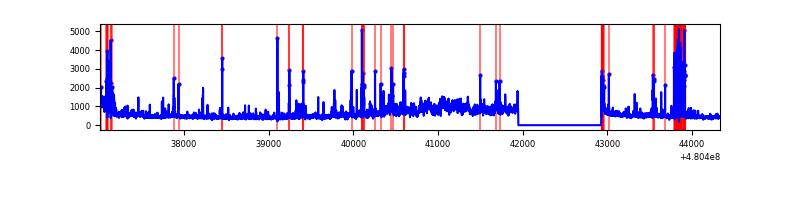 |
Top three noisy pixels from each quadrant. If the there are fewer than three noisy pixels in the level2.evt file, extra rows are filled as -1
| Pixel properties | Quadrant properties | ||||||
|---|---|---|---|---|---|---|---|
| Quadrant | DetID | PixID | Counts | Sigma | Mean | Median | Sigma |
| A | 12 | 3 | 1553585 | 9329.53 | 667 | 650 | 166.5 |
| A | 9 | 96 | 507563 | 3045.37 | 667 | 650 | 166.5 |
| A | 12 | 250 | 303377 | 1818.69 | 667 | 650 | 166.5 |
| B | 10 | 254 | 363187 | 2570.06 | 660 | 638 | 141.1 |
| B | 5 | 172 | 337706 | 2389.43 | 660 | 638 | 141.1 |
| B | 5 | 185 | 228735 | 1616.95 | 660 | 638 | 141.1 |
| C | 4 | 12 | 8432666 | 77573.02 | 389 | 385 | 108.7 |
| C | 15 | 179 | 963834 | 8863.28 | 389 | 385 | 108.7 |
| C | 15 | 219 | 634712 | 5835.51 | 389 | 385 | 108.7 |
| D | 8 | 176 | 966159 | 5317.36 | 649 | 625 | 181.6 |
| D | 15 | 170 | 149547 | 820.14 | 649 | 625 | 181.6 |
| D | 12 | 128 | 72951 | 398.31 | 649 | 625 | 181.6 |
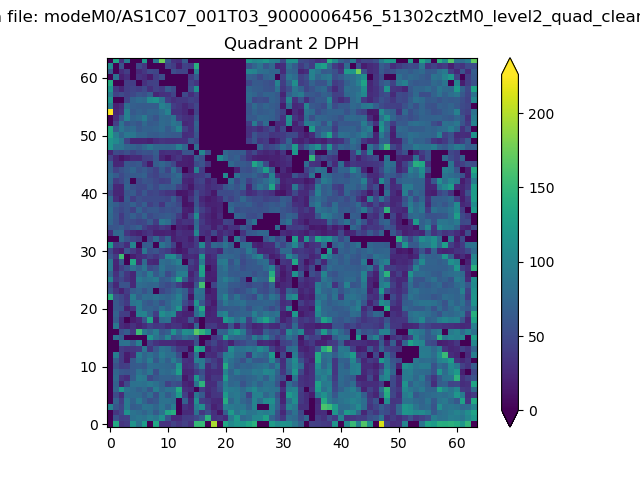
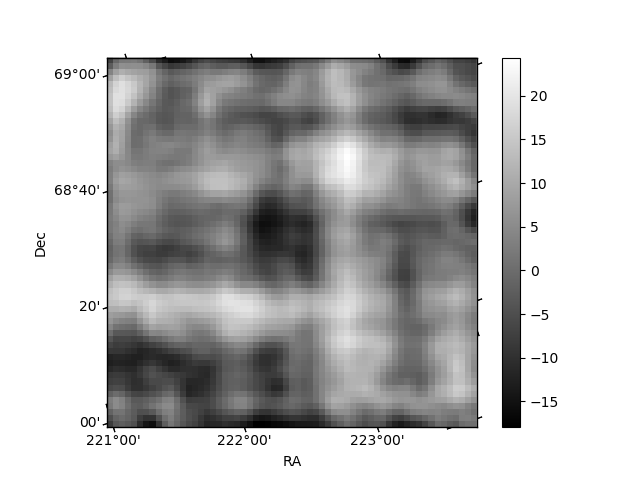
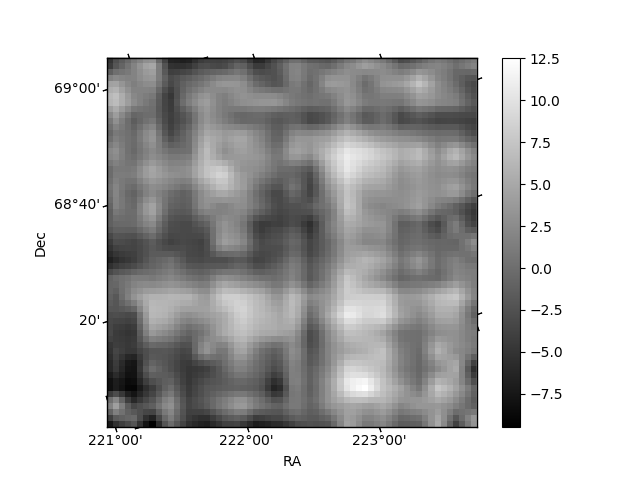
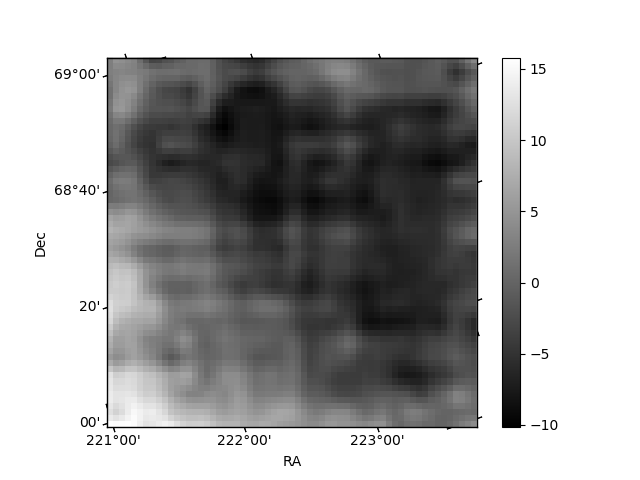
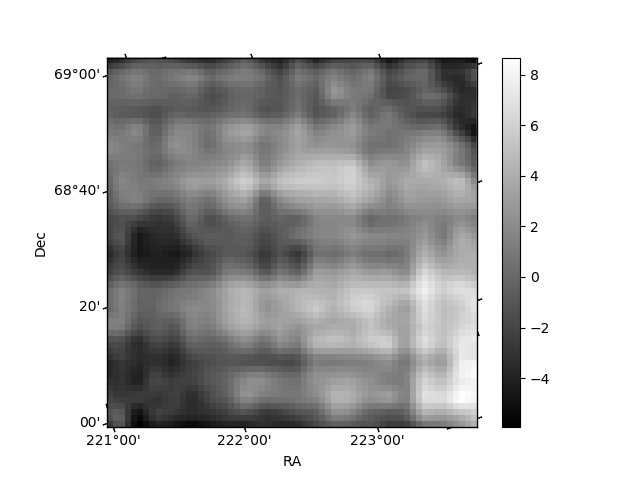
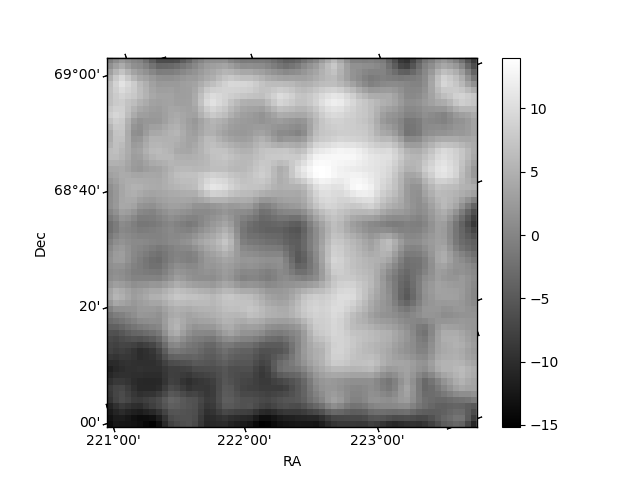
Histogram calculated using DETX and DETY for each event in the final _common_clean file
| Quadrant A | 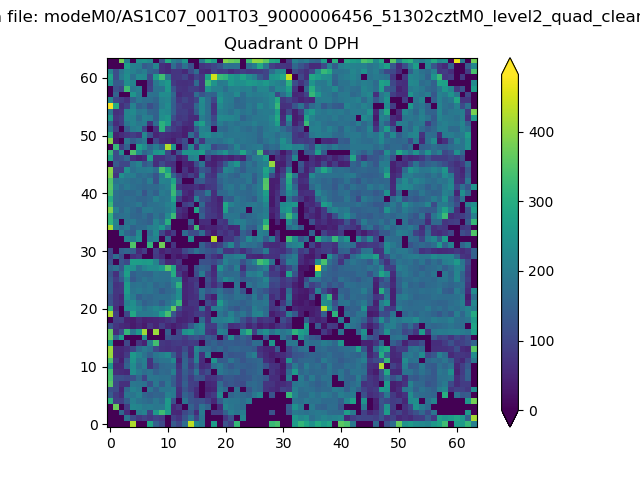 |
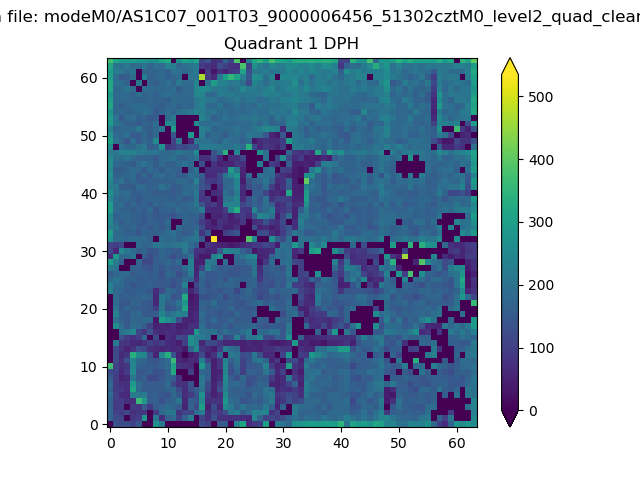 |
Quadrant B |
|---|---|---|---|
| Quadrant D | 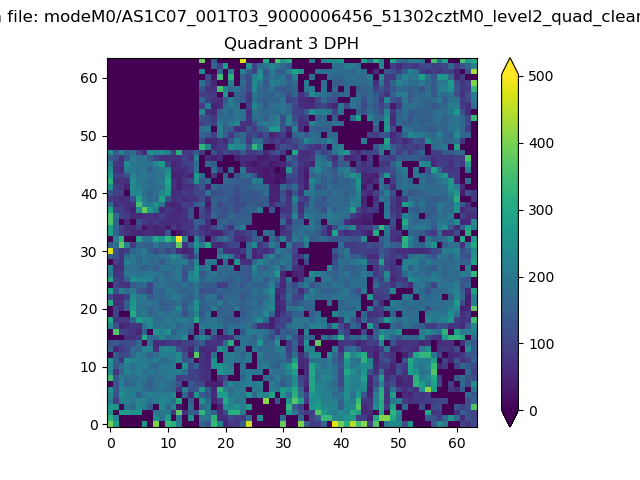 |
 |
Quadrant C |
| Plot type | Count rate plots | Images |
|---|---|---|
| Comparison with Poisson distribution Blue bars denote a histogram of data divided into 1 sec bins. Red curve is a Poisson curve with rate = median count rate of data. |
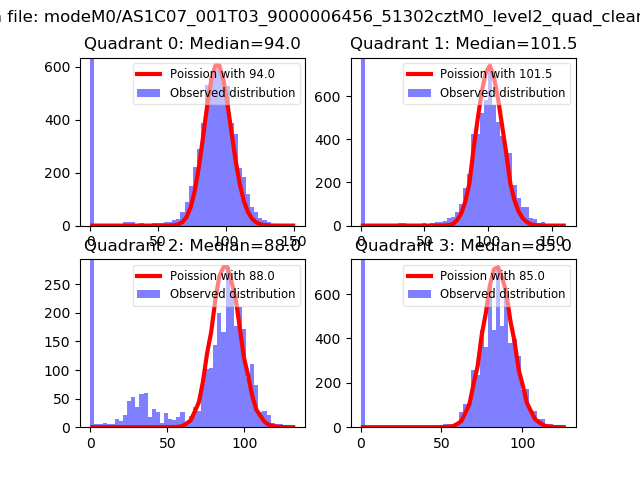 |
 |
| Quadrant-wise count rates Data is divided into 100 sec bins |
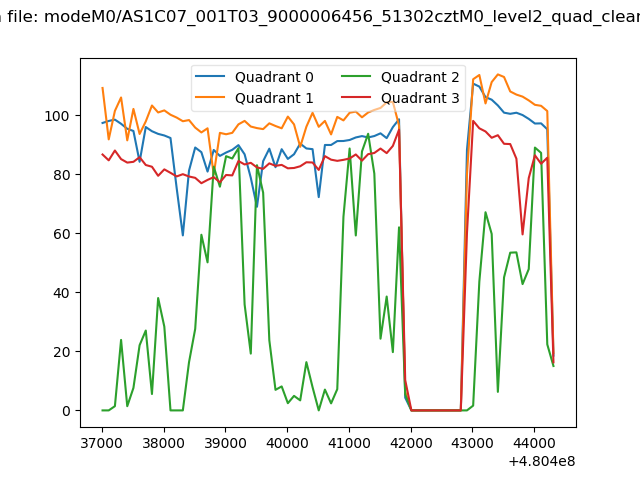 |
|
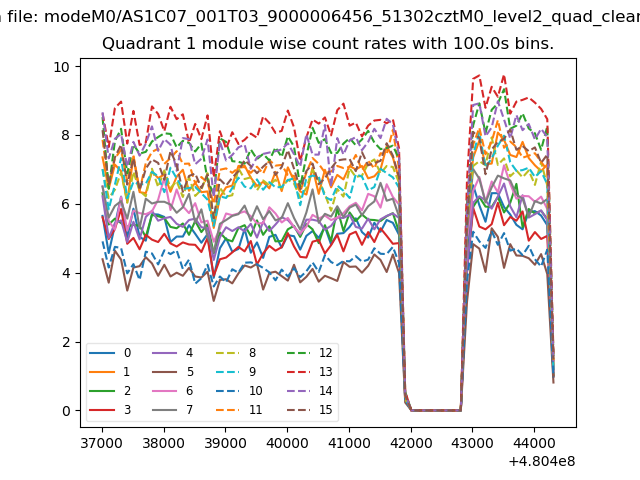
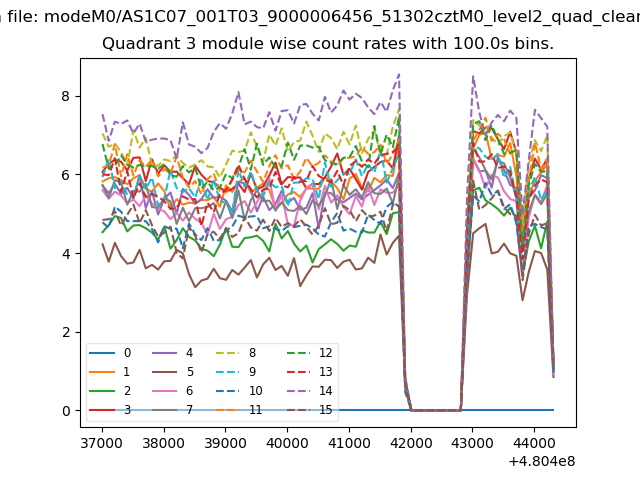
| Module-wise count rates for Quadrant A Data is divided into 100 sec bins |
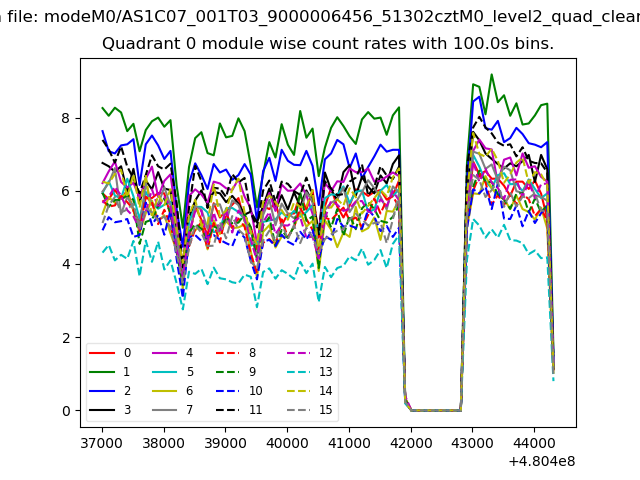 |
 |
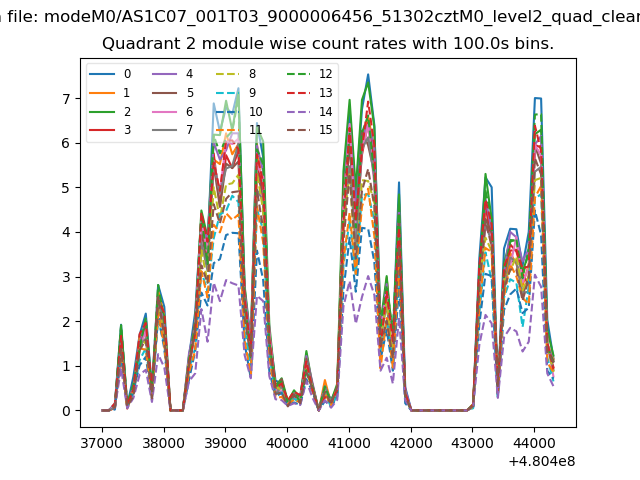
| Module-wise count rates for Quadrant B Data is divided into 100 sec bins |
 |
 |
| Module-wise count rates for Quadrant C Data is divided into 100 sec bins |
 |
 |
| Module-wise count rates for Quadrant D Data is divided into 100 sec bins |
 |
 |
| Parameter | Plot |
|---|---|
| CZT HV Monitor | 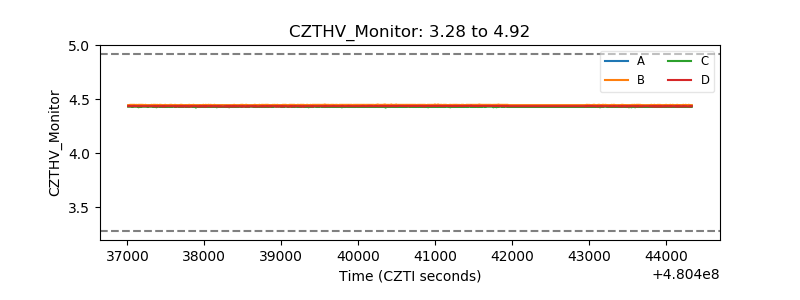 |
| D_VDD | 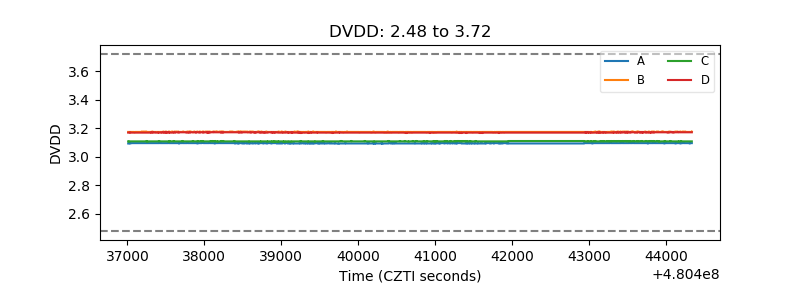 |
| Temperature 1 | 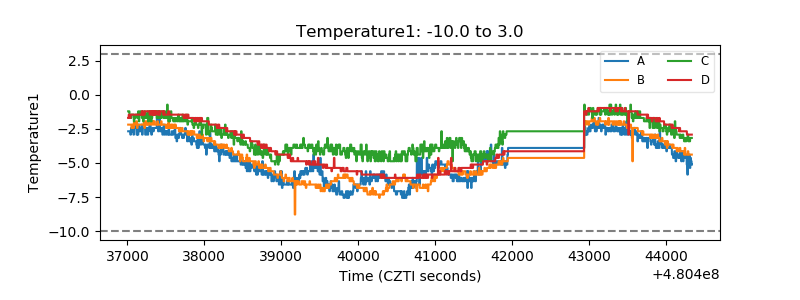 |
| Veto HV Monitor | 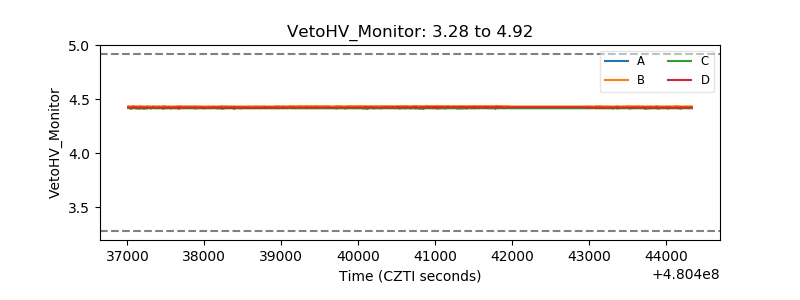 |
| Veto LLD | 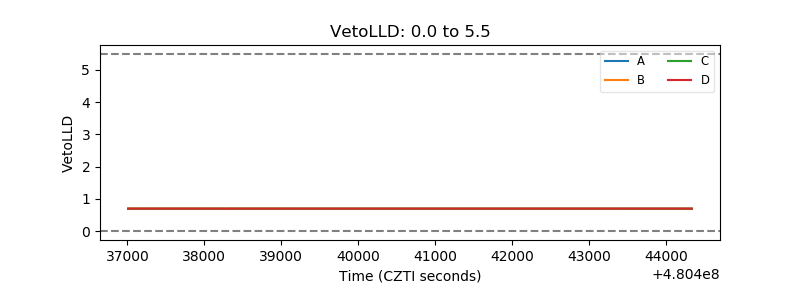 |
| Alpha Counter | 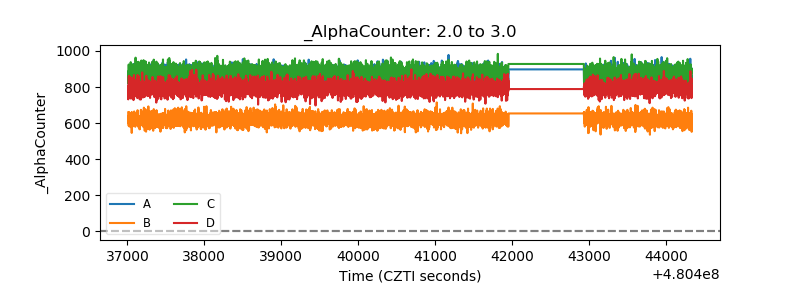 |
| _CPM_Rate | 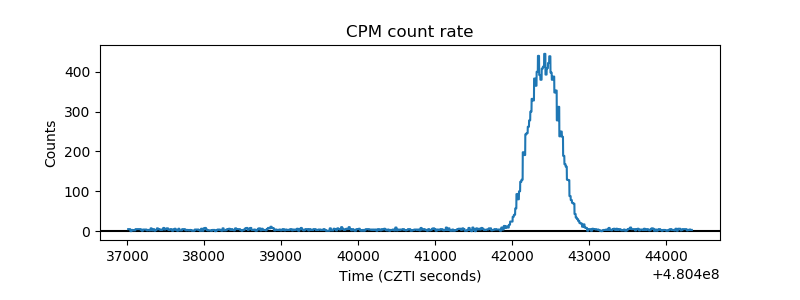 |
| CZT Counter | 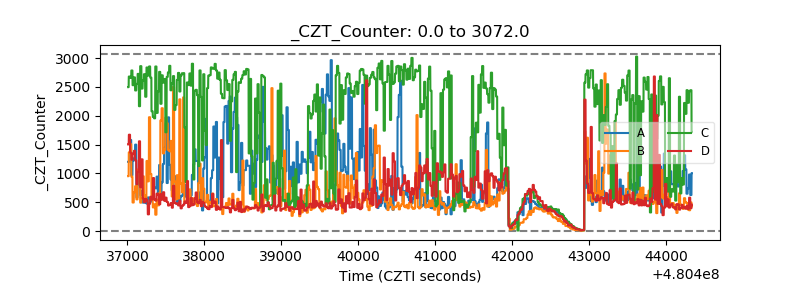 |
| +2.5 Volts monitor | 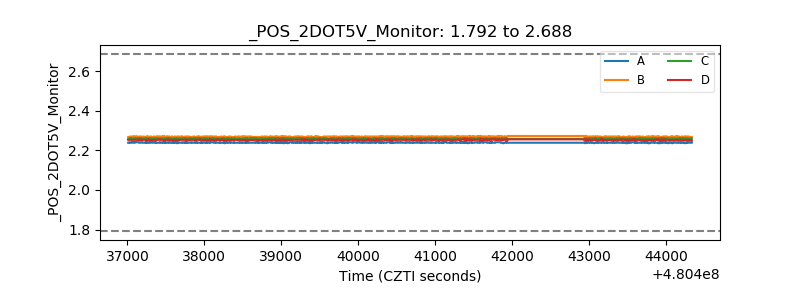 |
| +5 Volts monitor | 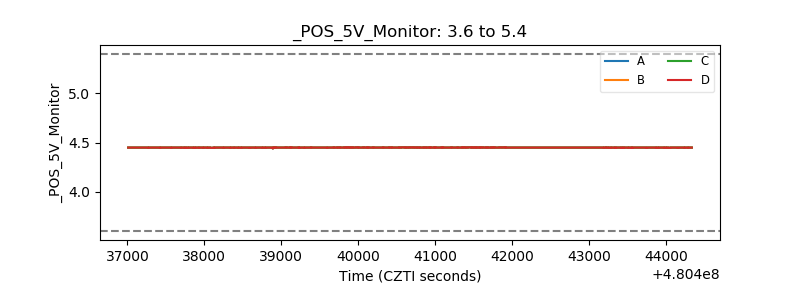 |
| _ROLL_ROT | 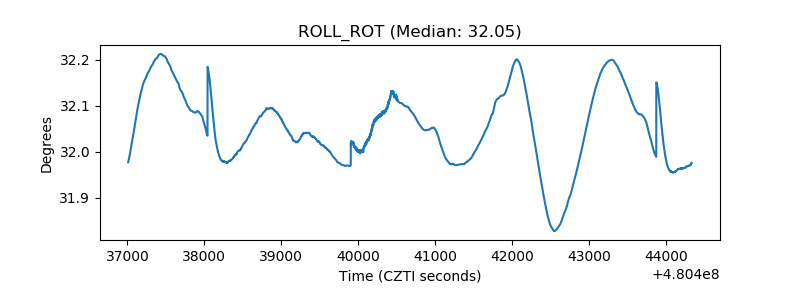 |
| _Roll_DEC | 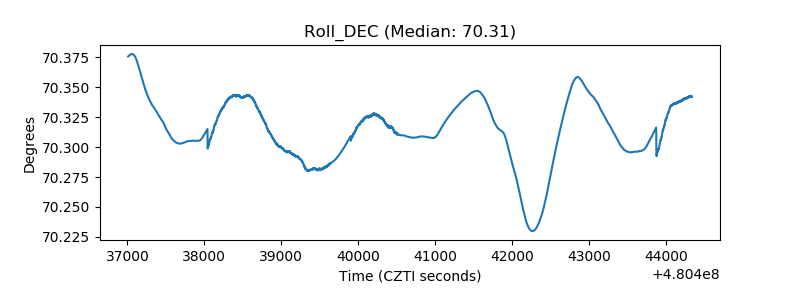 |
| _Roll_RA | 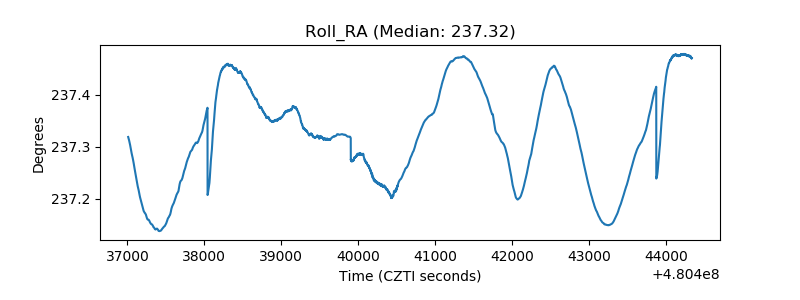 |
| Veto Counter | 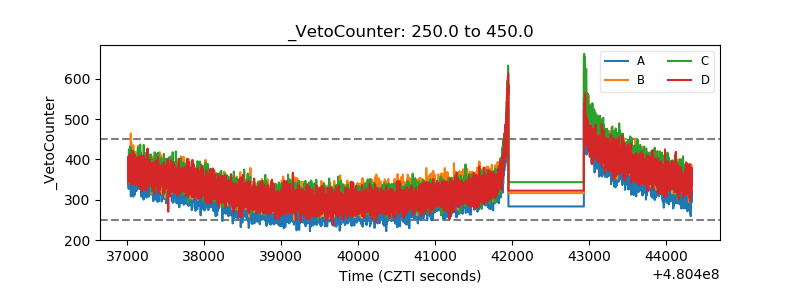 |