| Param | Original file | Final file |
|---|---|---|
| Filename | modeM0/AS1C07_001T03_9000006456_51304cztM0_level2.fits | modeM0/AS1C07_001T03_9000006456_51304cztM0_level2_quad_clean.evt |
| Size (bytes) | 674,521,920 | 83,520,000 |
| Size | 643.3 MB | 79.7 MB |
| Events in quadrant A | 5,837,747 | 580,688 |
| Events in quadrant B | 4,247,022 | 615,595 |
| Events in quadrant C | 9,666,231 | 376,580 |
| Events in quadrant D | 4,739,781 | 524,483 |
| Mode SS | |||
|---|---|---|---|
| Quadrant | BADHDUFLAG | Total packets | Discarded packets |
| A | 0 | 126 | 0 |
| B | 0 | 126 | 0 |
| C | 0 | 126 | 0 |
| D | 0 | 126 | 0 |
| Mode M0 | |||
|---|---|---|---|
| Quadrant | BADHDUFLAG | Total packets | Discarded packets |
| A | 0 | 21679 | 1 |
| B | 0 | 17015 | 4 |
| C | 0 | 33029 | 1 |
| D | 0 | 18418 | 1 |
| Mode M9 | |||
|---|---|---|---|
| Quadrant | BADHDUFLAG | Total packets | Discarded packets |
| A | 0 | 11 | 0 |
| B | 0 | 11 | 0 |
| C | 0 | 11 | 0 |
| D | 0 | 11 | 0 |
| Quadrant | Total seconds | Saturated seconds | Saturation percentage |
|---|---|---|---|
| A | 6178 | 230 | 3.722888% |
| B | 6178 | 356 | 5.762383% |
| C | 6178 | 2459 | 39.802525% |
| D | 6178 | 267 | 4.321787% |
Noise dominated data is calculated using 1-second bins in cleaned event files. If a bin has >2000 counts, and if more than 50% of those come from <1% of pixels, then it is considered to be noise-dominated and hence unusable.
| Quadrant | # 1 sec bins | Bins with >0 counts | Bins with >2000 counts | High rate bins dominated by noise | Noise dominated (total time) | Noise dominated (detector-on time) | Marked lightcurve |
|---|---|---|---|---|---|---|---|
| A | 7263 | 6179 | 162 | 162 | 2.23% | 2.62% | 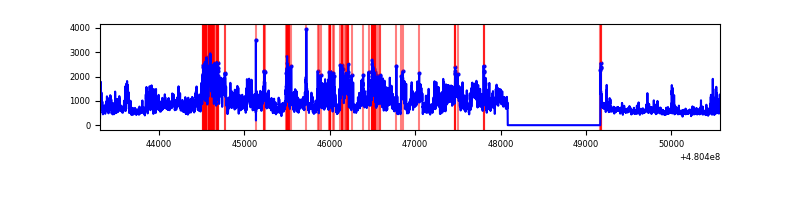 |
| B | 7263 | 6179 | 201 | 201 | 2.77% | 3.25% | 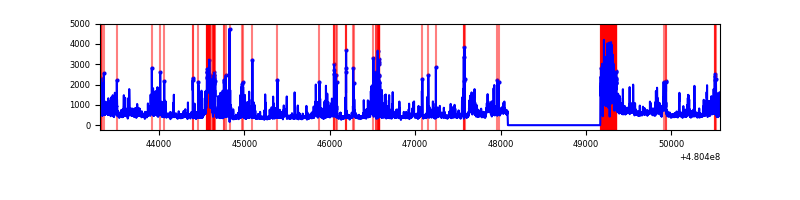 |
| C | 7263 | 6179 | 2038 | 2038 | 28.06% | 32.98% | 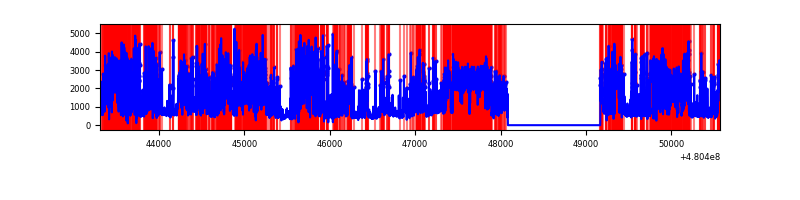 |
| D | 7263 | 6179 | 210 | 210 | 2.89% | 3.40% | 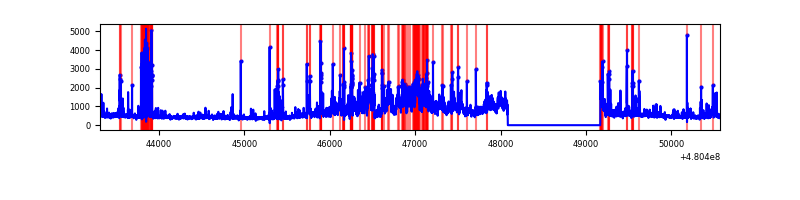 |
Top three noisy pixels from each quadrant. If the there are fewer than three noisy pixels in the level2.evt file, extra rows are filled as -1
| Pixel properties | Quadrant properties | ||||||
|---|---|---|---|---|---|---|---|
| Quadrant | DetID | PixID | Counts | Sigma | Mean | Median | Sigma |
| A | 12 | 3 | 2099902 | 13097.01 | 651 | 636 | 160.3 |
| A | 4 | 3 | 278101 | 1731.06 | 651 | 636 | 160.3 |
| A | 12 | 194 | 244866 | 1523.71 | 651 | 636 | 160.3 |
| B | 8 | 128 | 330063 | 2415.91 | 642 | 621 | 136.4 |
| B | 5 | 172 | 291511 | 2133.19 | 642 | 621 | 136.4 |
| B | 1 | 255 | 267904 | 1960.08 | 642 | 621 | 136.4 |
| C | 4 | 12 | 5853574 | 39074.66 | 536 | 530 | 149.8 |
| C | 15 | 158 | 368115 | 2453.98 | 536 | 530 | 149.8 |
| C | 3 | 233 | 214489 | 1428.38 | 536 | 530 | 149.8 |
| D | 8 | 176 | 1421644 | 8017.8 | 633 | 610 | 177.2 |
| D | 12 | 128 | 158588 | 891.35 | 633 | 610 | 177.2 |
| D | 15 | 170 | 149465 | 839.87 | 633 | 610 | 177.2 |
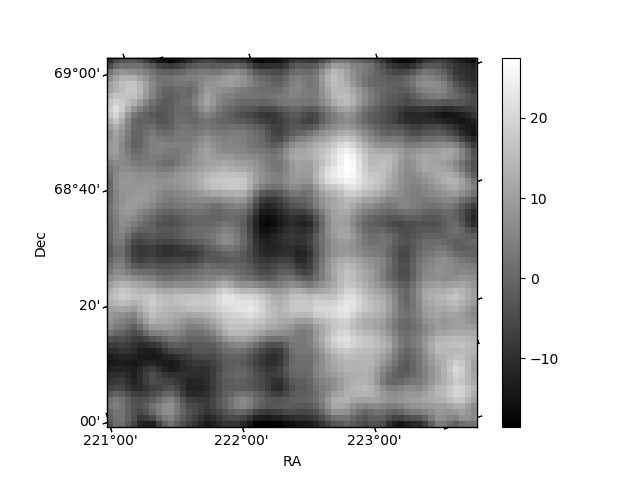
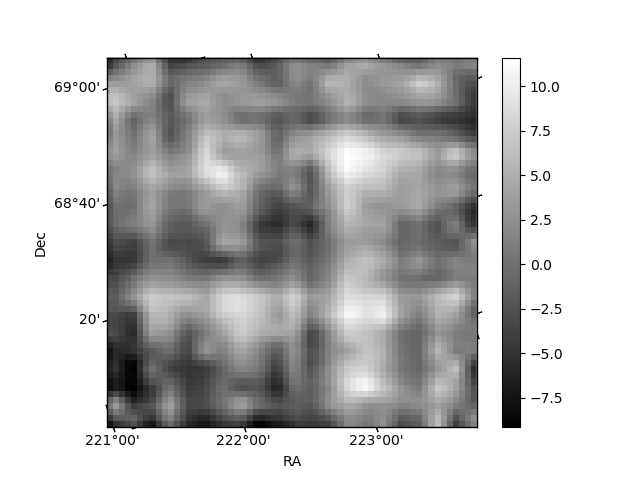
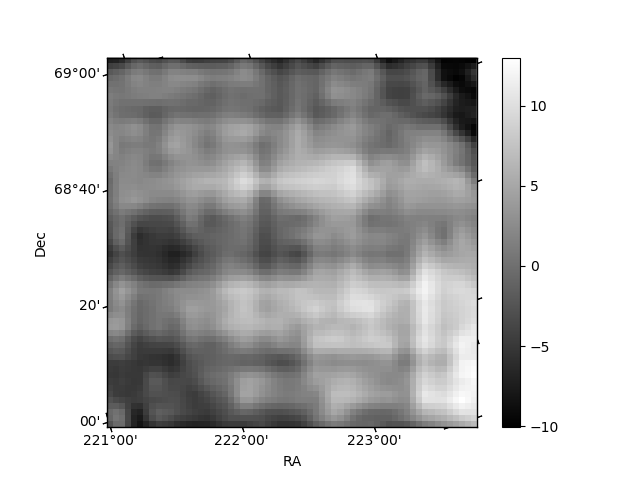
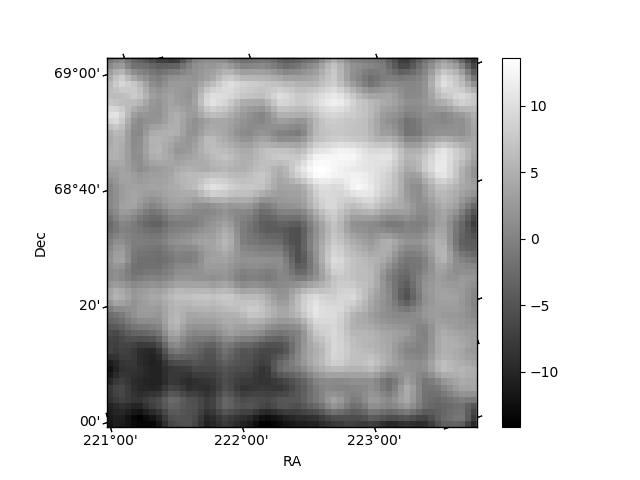
Histogram calculated using DETX and DETY for each event in the final _common_clean file
| Quadrant A | 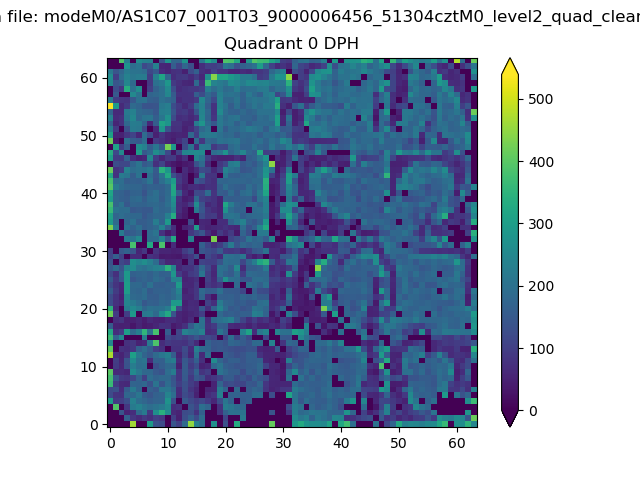 |
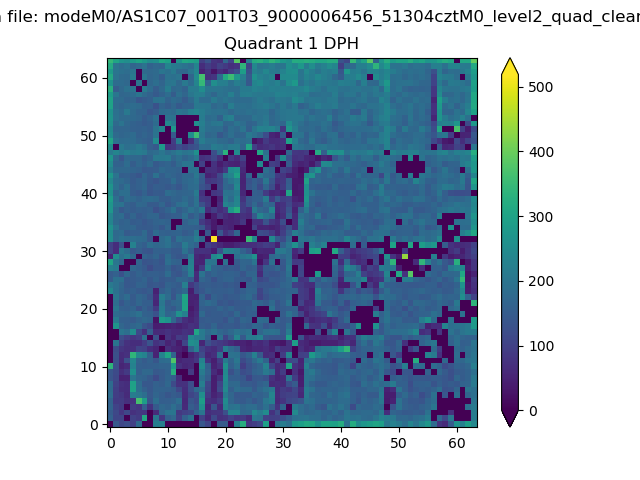 |
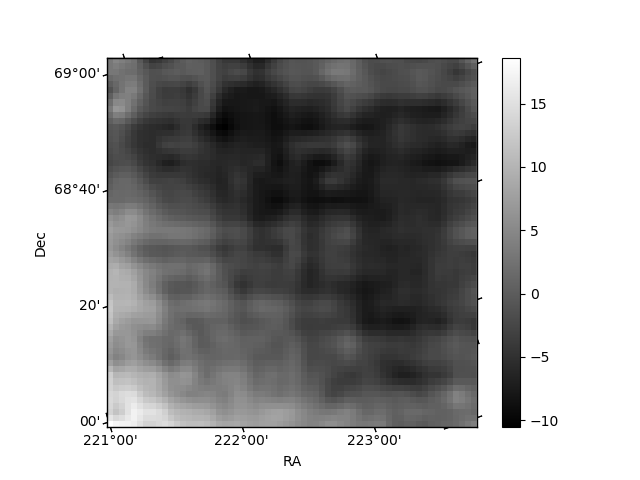
Quadrant B |
|---|---|---|---|
| Quadrant D | 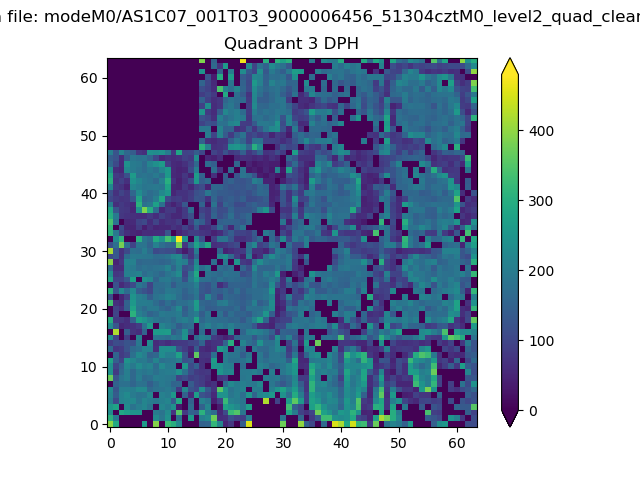 |
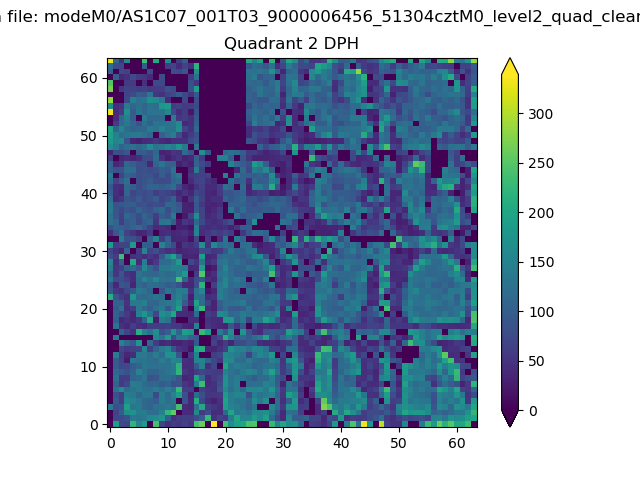 |
Quadrant C |
| Plot type | Count rate plots | Images |
|---|---|---|
| Comparison with Poisson distribution Blue bars denote a histogram of data divided into 1 sec bins. Red curve is a Poisson curve with rate = median count rate of data. |
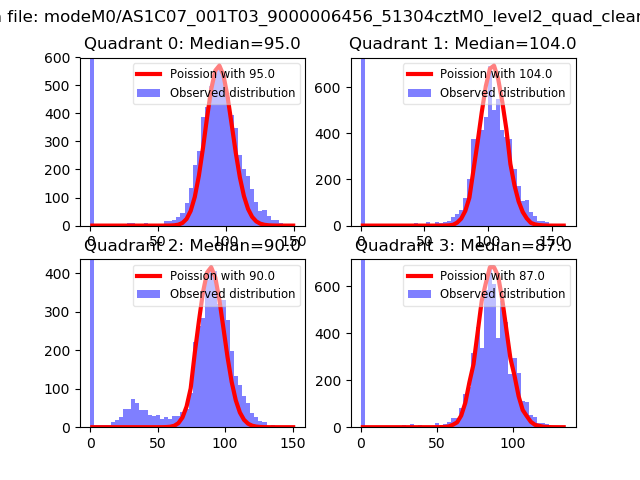 |
 |
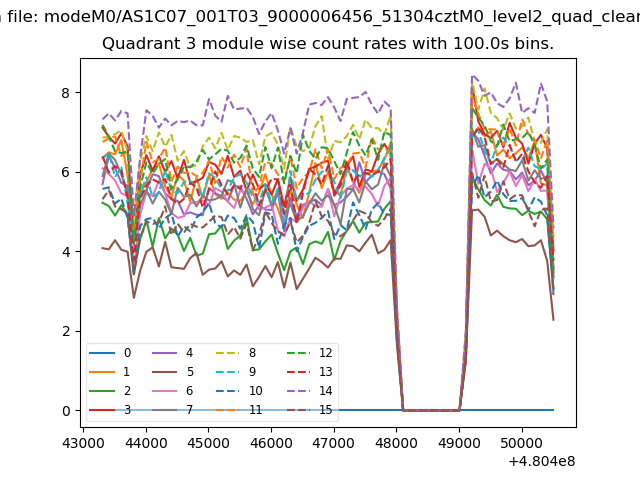
| Quadrant-wise count rates Data is divided into 100 sec bins |
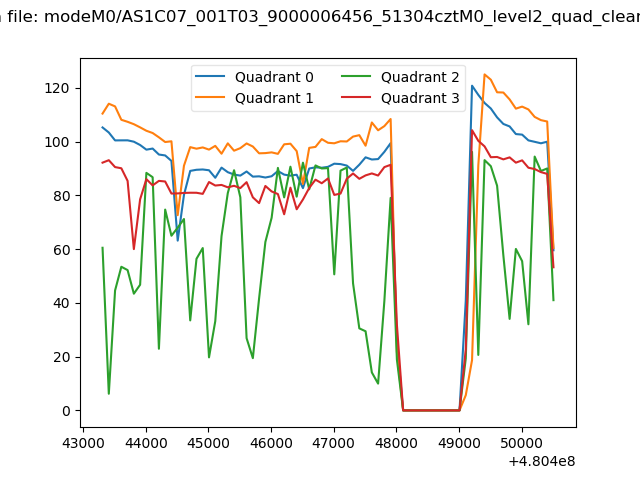 |
|
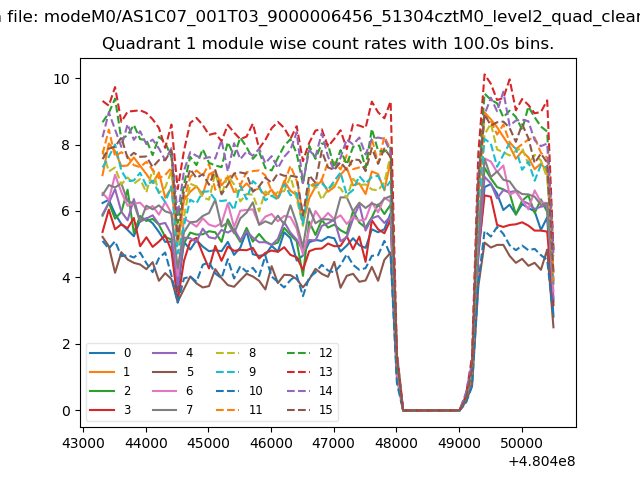
| Module-wise count rates for Quadrant A Data is divided into 100 sec bins |
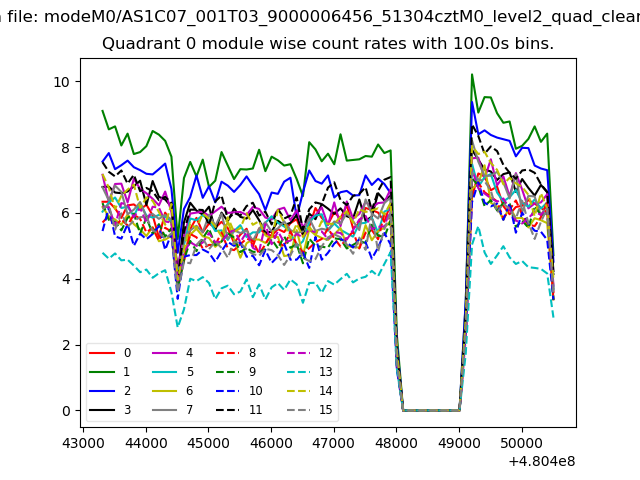 |
 |
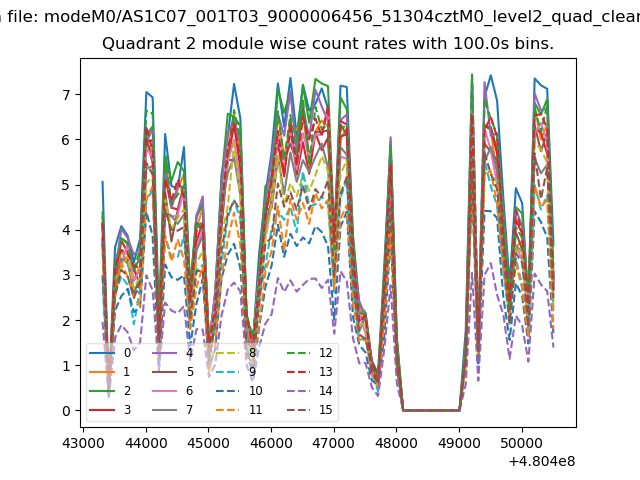
| Module-wise count rates for Quadrant B Data is divided into 100 sec bins |
 |
 |
| Module-wise count rates for Quadrant C Data is divided into 100 sec bins |
 |
 |
| Module-wise count rates for Quadrant D Data is divided into 100 sec bins |
 |
 |
| Parameter | Plot |
|---|---|
| CZT HV Monitor | 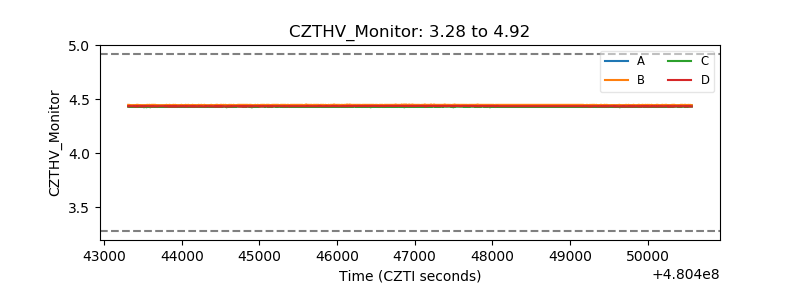 |
| D_VDD | 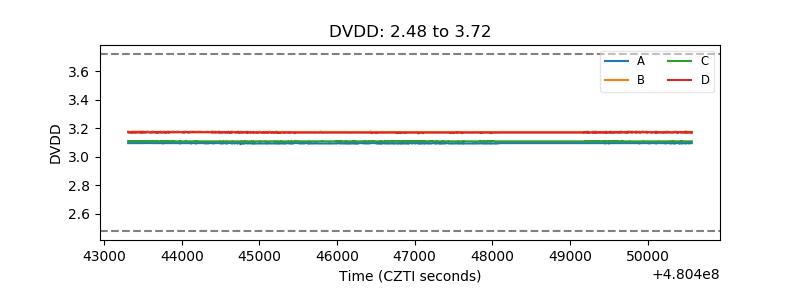 |
| Temperature 1 | 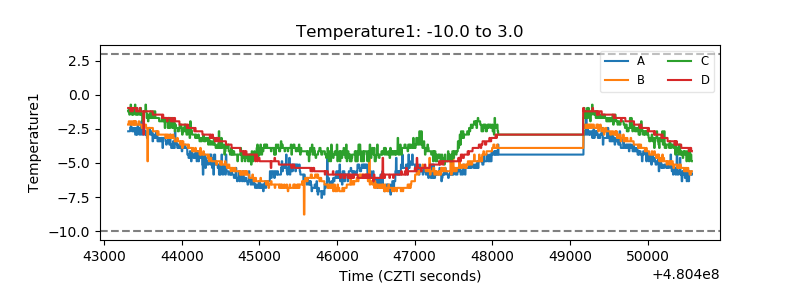 |
| Veto HV Monitor | 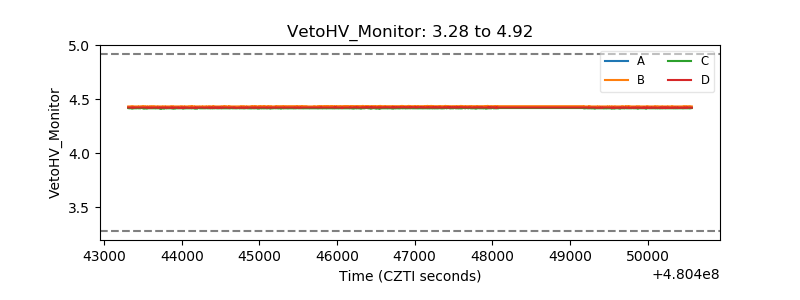 |
| Veto LLD | 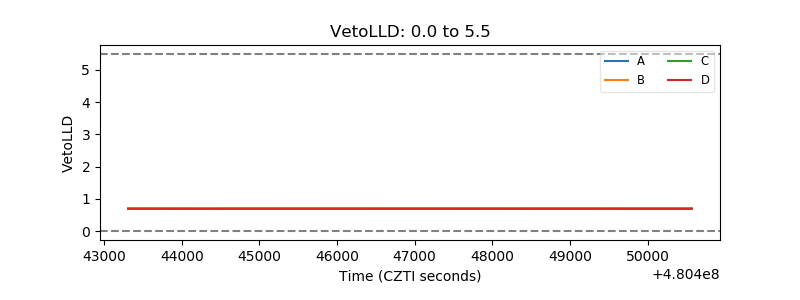 |
| Alpha Counter | 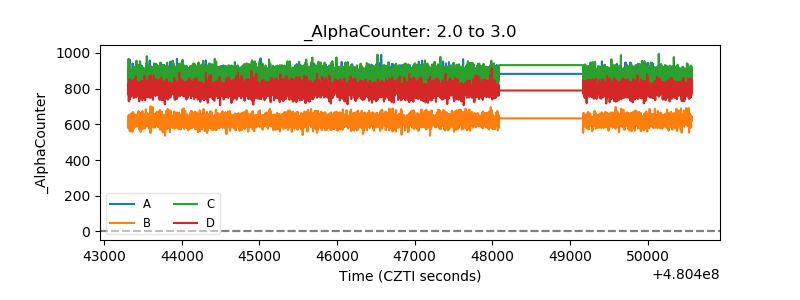 |
| _CPM_Rate | 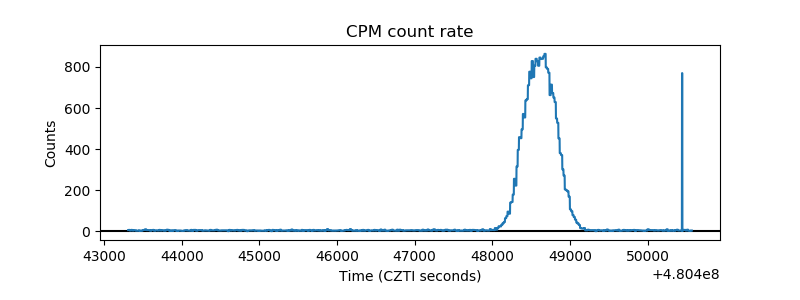 |
| CZT Counter | 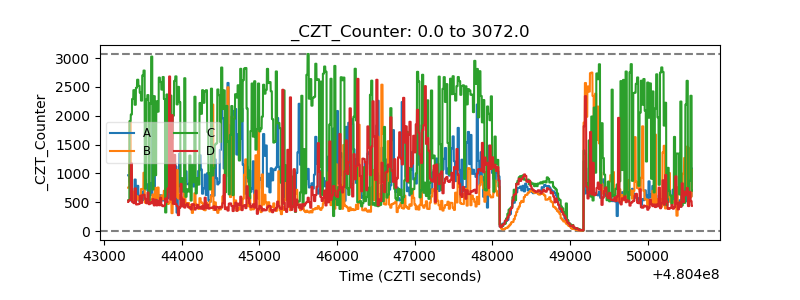 |
| +2.5 Volts monitor | 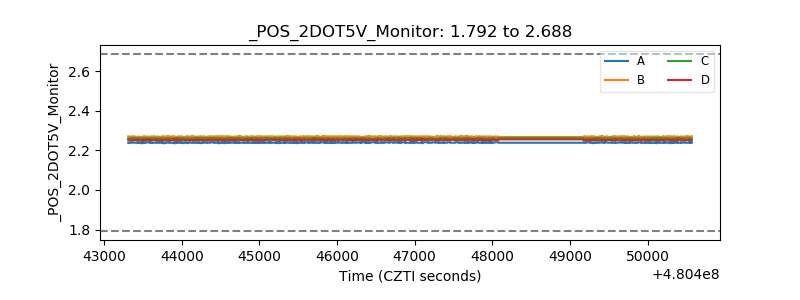 |
| +5 Volts monitor |  |
| _ROLL_ROT | 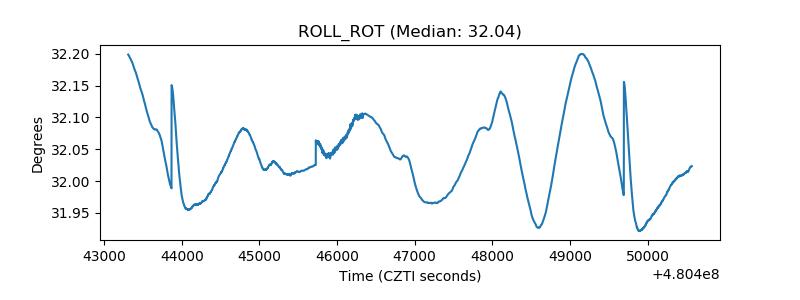 |
| _Roll_DEC | 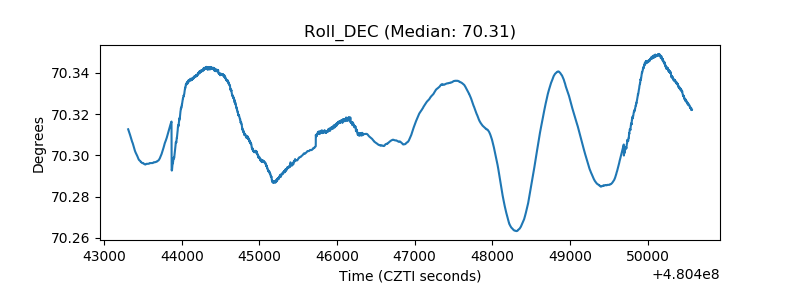 |
| _Roll_RA | 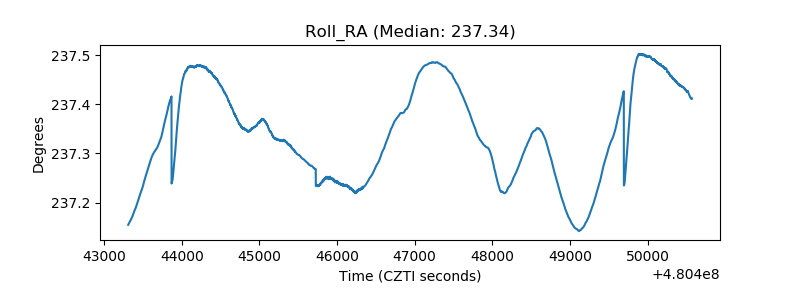 |
| Veto Counter | 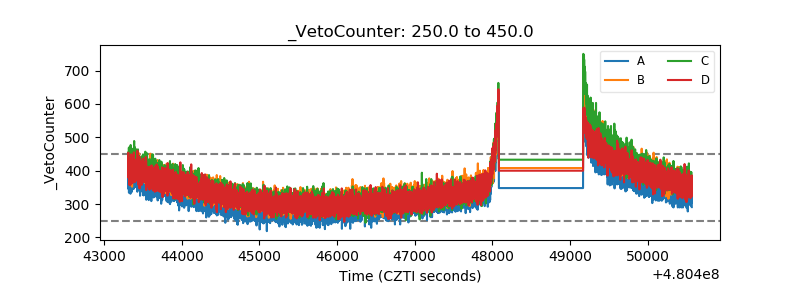 |