| Param | Original file | Final file |
|---|---|---|
| Filename | modeM0/AS1C07_001T03_9000006456_51305cztM0_level2.fits | modeM0/AS1C07_001T03_9000006456_51305cztM0_level2_quad_clean.evt |
| Size (bytes) | 758,203,200 | 85,089,600 |
| Size | 723.1 MB | 81.1 MB |
| Events in quadrant A | 5,164,575 | 623,222 |
| Events in quadrant B | 4,436,035 | 662,218 |
| Events in quadrant C | 11,808,079 | 321,220 |
| Events in quadrant D | 6,164,247 | 524,971 |
| Mode SS | |||
|---|---|---|---|
| Quadrant | BADHDUFLAG | Total packets | Discarded packets |
| A | 0 | 130 | 0 |
| B | 0 | 130 | 0 |
| C | 0 | 130 | 0 |
| D | 0 | 130 | 0 |
| Mode M0 | |||
|---|---|---|---|
| Quadrant | BADHDUFLAG | Total packets | Discarded packets |
| A | 0 | 19754 | 2 |
| B | 0 | 17678 | 2 |
| C | 0 | 39455 | 2 |
| D | 0 | 22725 | 2 |
| Mode M9 | |||
|---|---|---|---|
| Quadrant | BADHDUFLAG | Total packets | Discarded packets |
| A | 0 | 23 | 0 |
| B | 0 | 23 | 0 |
| C | 0 | 23 | 0 |
| D | 0 | 23 | 0 |
| Quadrant | Total seconds | Saturated seconds | Saturation percentage |
|---|---|---|---|
| A | 6379 | 174 | 2.727700% |
| B | 6379 | 399 | 6.254899% |
| C | 6378 | 3440 | 53.935403% |
| D | 6378 | 629 | 9.862026% |
Noise dominated data is calculated using 1-second bins in cleaned event files. If a bin has >2000 counts, and if more than 50% of those come from <1% of pixels, then it is considered to be noise-dominated and hence unusable.
| Quadrant | # 1 sec bins | Bins with >0 counts | Bins with >2000 counts | High rate bins dominated by noise | Noise dominated (total time) | Noise dominated (detector-on time) | Marked lightcurve |
|---|---|---|---|---|---|---|---|
| A | 8659 | 6381 | 90 | 90 | 1.04% | 1.41% | 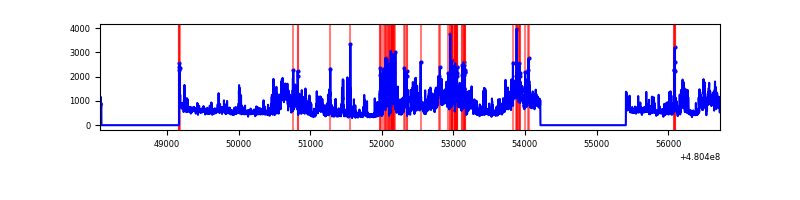 |
| B | 8659 | 6381 | 211 | 211 | 2.44% | 3.31% | 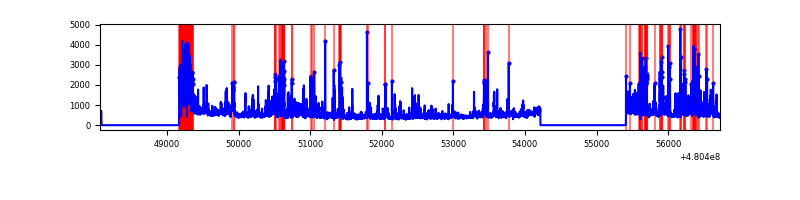 |
| C | 8658 | 6380 | 3007 | 3007 | 34.73% | 47.13% | 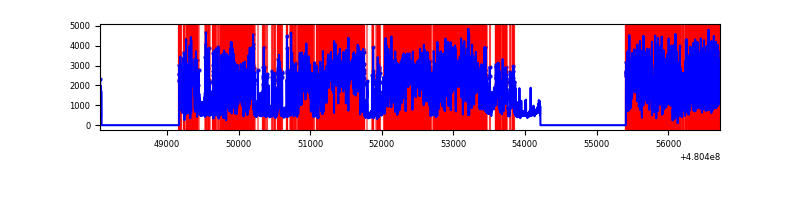 |
| D | 8658 | 6380 | 576 | 576 | 6.65% | 9.03% |  |
Top three noisy pixels from each quadrant. If the there are fewer than three noisy pixels in the level2.evt file, extra rows are filled as -1
| Pixel properties | Quadrant properties | ||||||
|---|---|---|---|---|---|---|---|
| Quadrant | DetID | PixID | Counts | Sigma | Mean | Median | Sigma |
| A | 12 | 3 | 1169707 | 6886.05 | 686 | 668 | 169.8 |
| A | 12 | 250 | 527170 | 3101.28 | 686 | 668 | 169.8 |
| A | 4 | 3 | 276279 | 1623.44 | 686 | 668 | 169.8 |
| B | 5 | 172 | 472903 | 3279.64 | 678 | 655 | 144.0 |
| B | 8 | 128 | 376766 | 2611.99 | 678 | 655 | 144.0 |
| B | 5 | 185 | 205013 | 1419.21 | 678 | 655 | 144.0 |
| C | 4 | 12 | 9174714 | 63054.55 | 525 | 519 | 145.5 |
| C | 3 | 233 | 123210 | 843.26 | 525 | 519 | 145.5 |
| C | 13 | 3 | 103783 | 709.74 | 525 | 519 | 145.5 |
| D | 8 | 176 | 1622183 | 9145.94 | 634 | 611 | 177.3 |
| D | 3 | 12 | 1317130 | 7425.39 | 634 | 611 | 177.3 |
| D | 12 | 2 | 120629 | 676.92 | 634 | 611 | 177.3 |
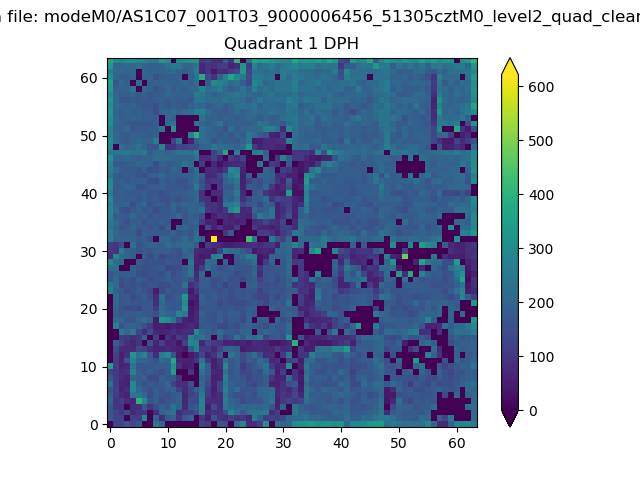
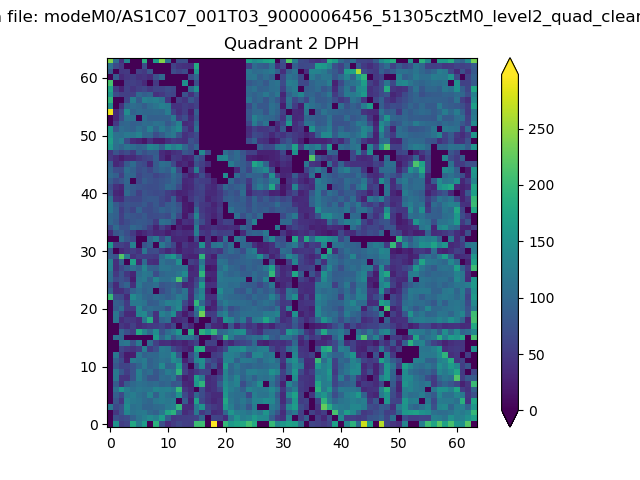
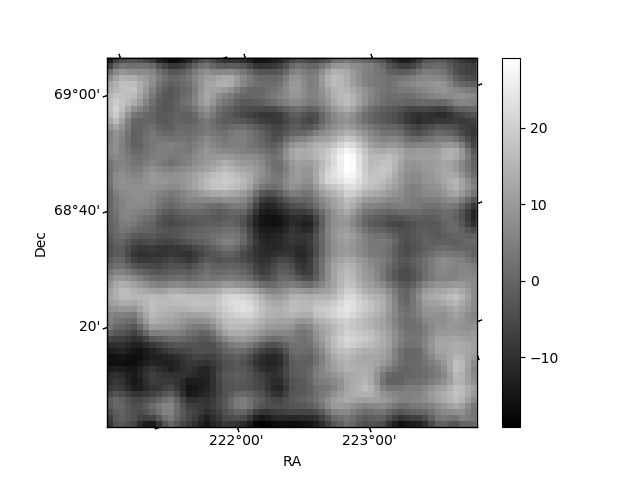
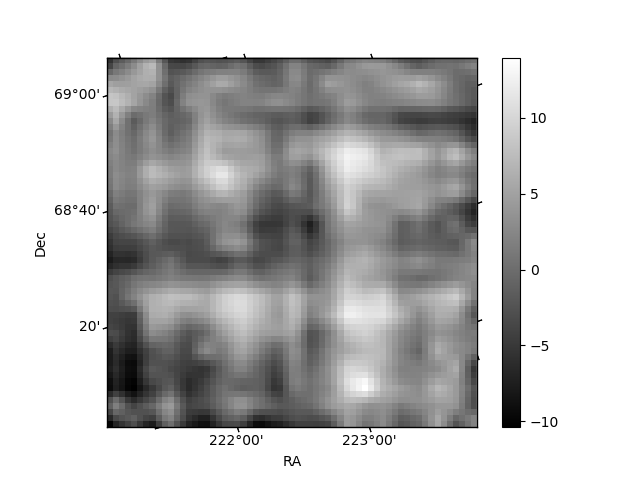
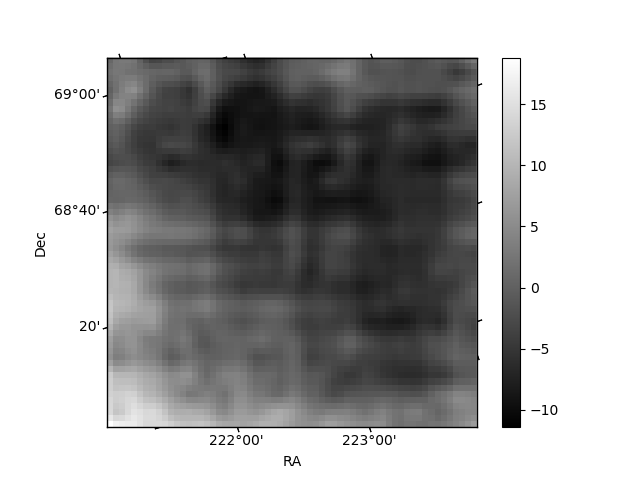
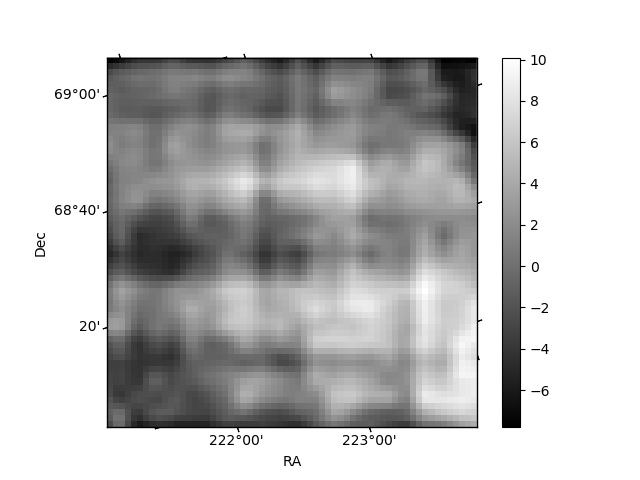
Histogram calculated using DETX and DETY for each event in the final _common_clean file
| Quadrant A | 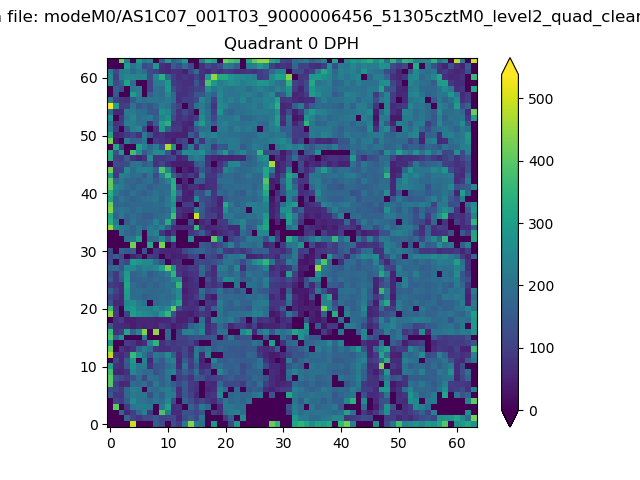 |
 |
Quadrant B |
|---|---|---|---|
| Quadrant D | 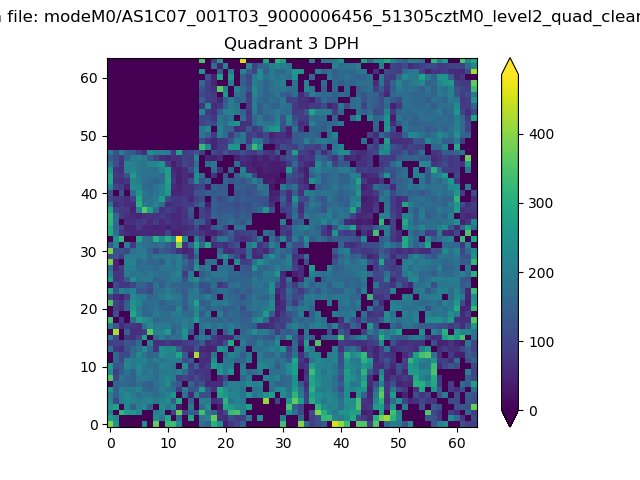 |
 |
Quadrant C |
| Plot type | Count rate plots | Images |
|---|---|---|
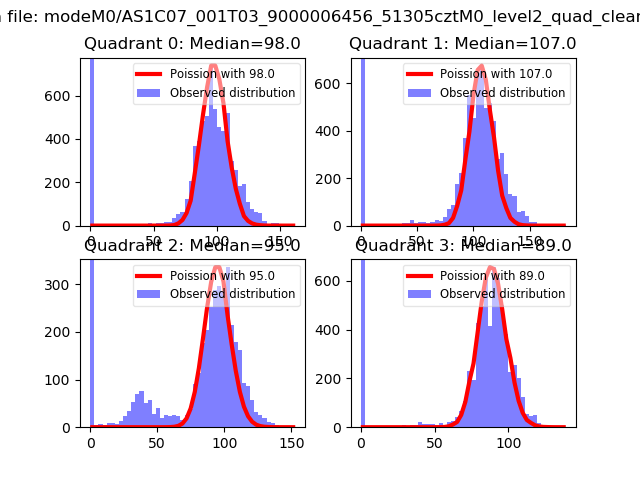
| Comparison with Poisson distribution Blue bars denote a histogram of data divided into 1 sec bins. Red curve is a Poisson curve with rate = median count rate of data. |
 |
 |
| Quadrant-wise count rates Data is divided into 100 sec bins |
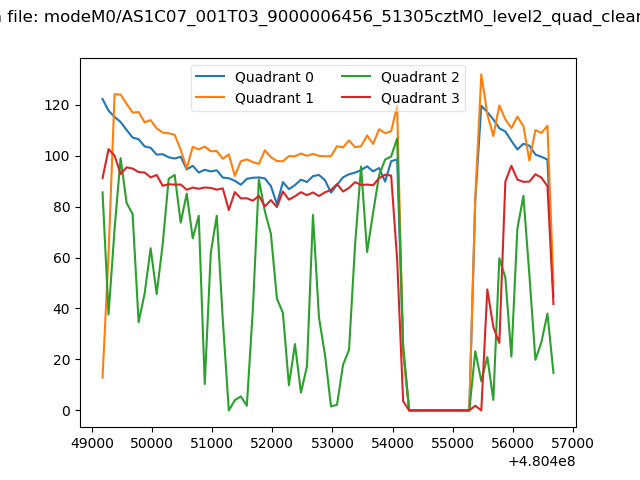 |
|
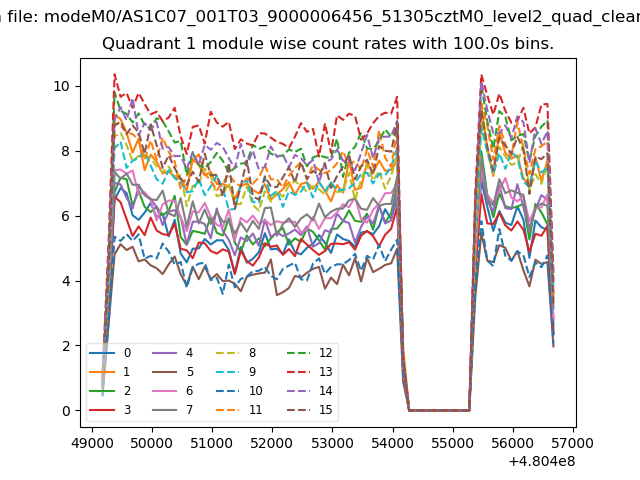
| Module-wise count rates for Quadrant A Data is divided into 100 sec bins |
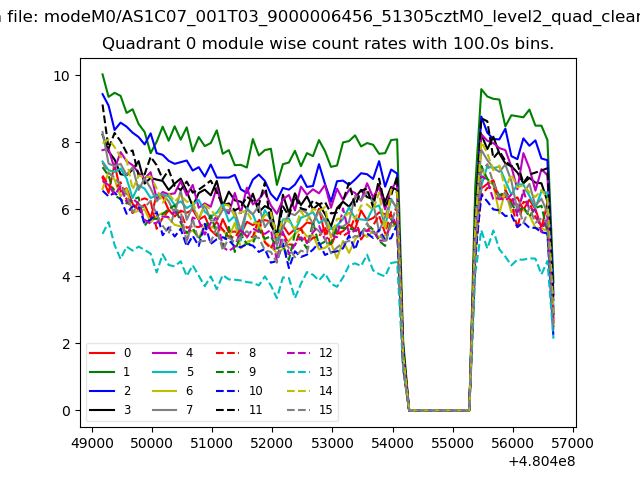 |
 |
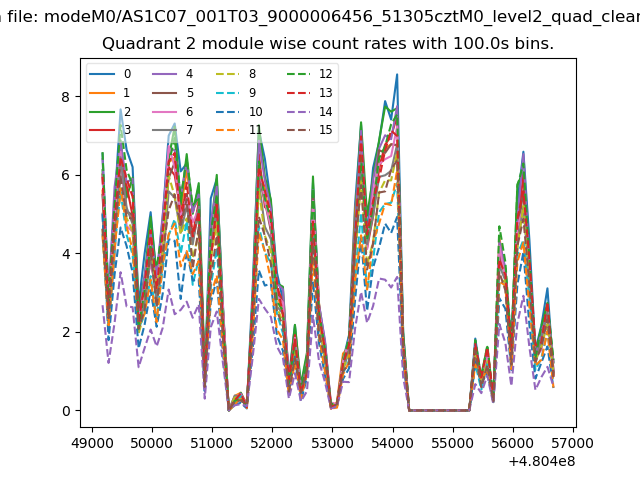
| Module-wise count rates for Quadrant B Data is divided into 100 sec bins |
 |
 |
| Module-wise count rates for Quadrant C Data is divided into 100 sec bins |
 |
 |
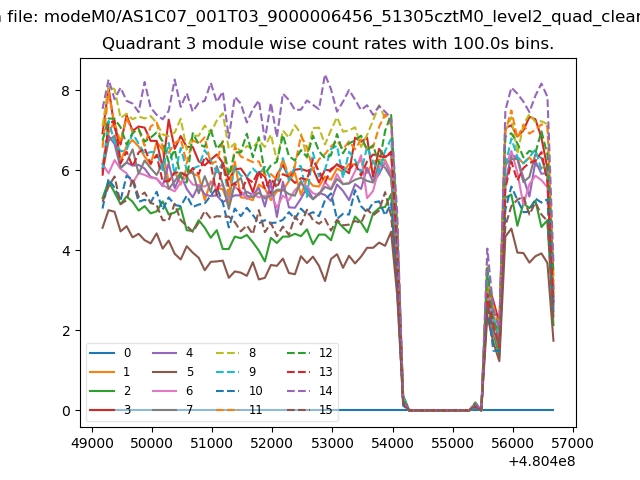
| Module-wise count rates for Quadrant D Data is divided into 100 sec bins |
 |
 |
| Parameter | Plot |
|---|---|
| CZT HV Monitor | 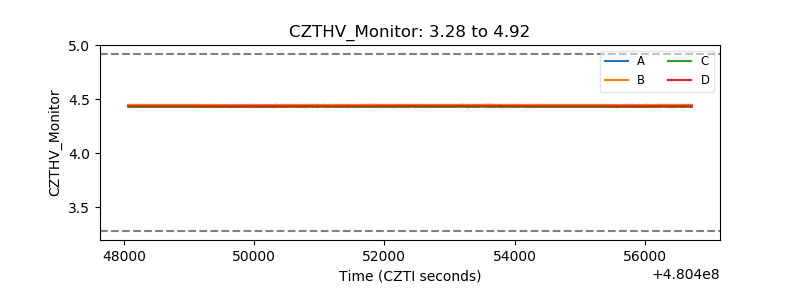 |
| D_VDD | 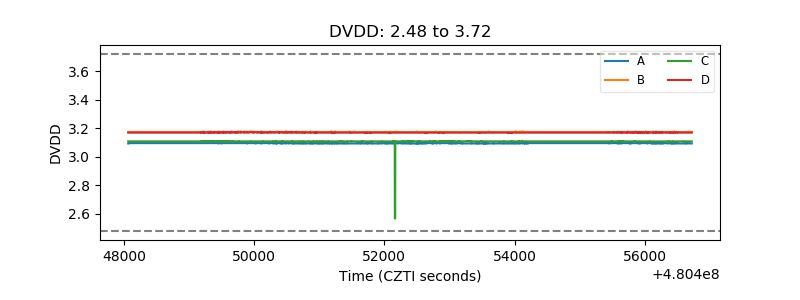 |
| Temperature 1 | 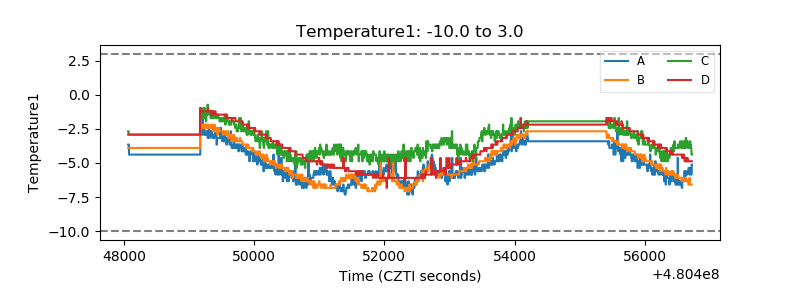 |
| Veto HV Monitor | 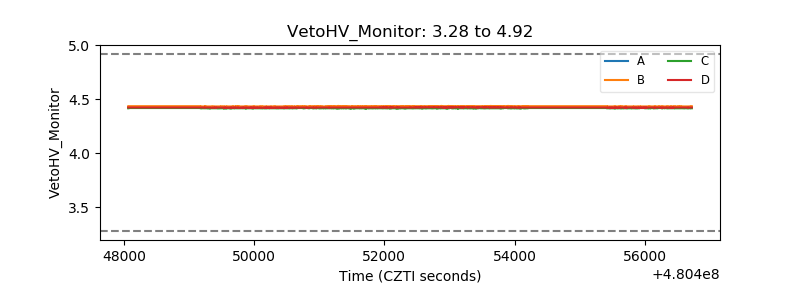 |
| Veto LLD | 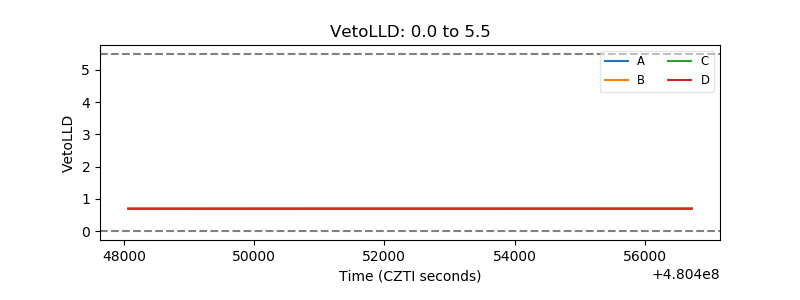 |
| Alpha Counter | 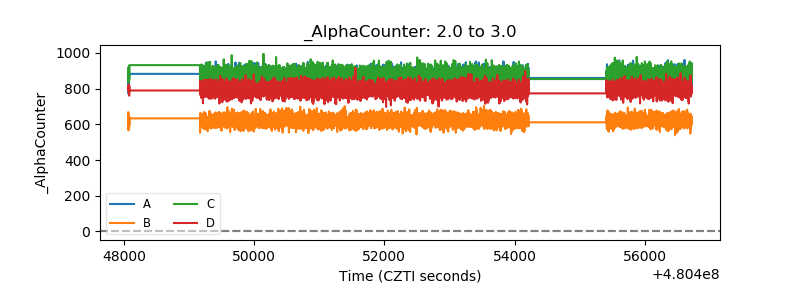 |
| _CPM_Rate | 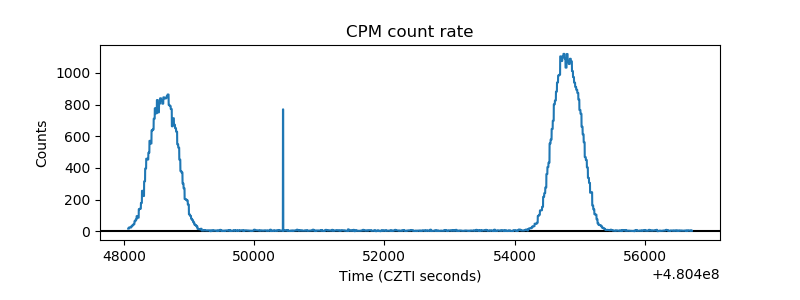 |
| CZT Counter | 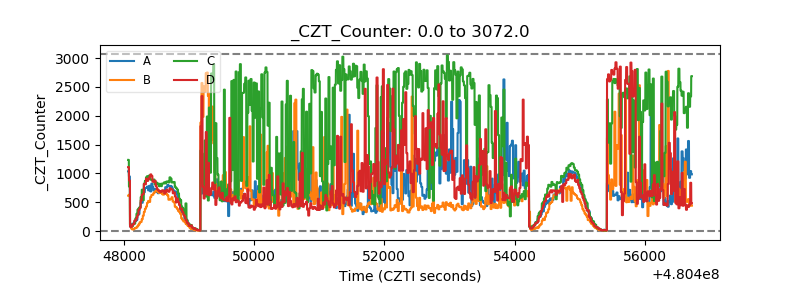 |
| +2.5 Volts monitor | 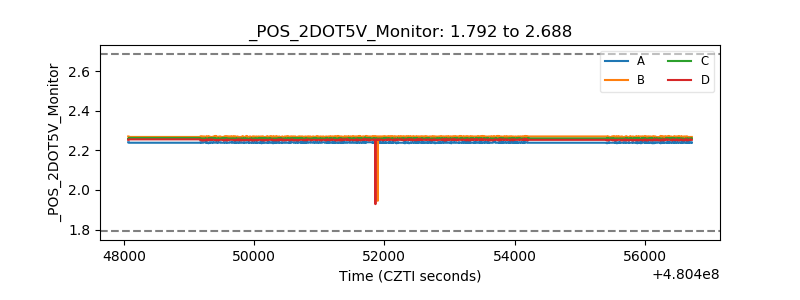 |
| +5 Volts monitor |  |
| _ROLL_ROT | 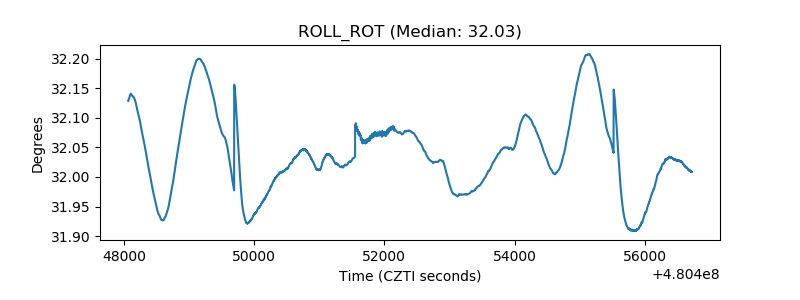 |
| _Roll_DEC | 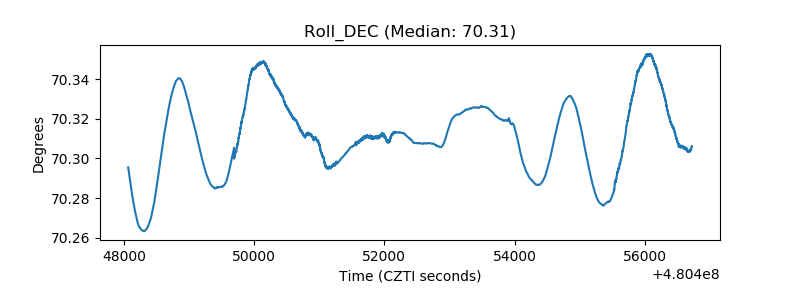 |
| _Roll_RA | 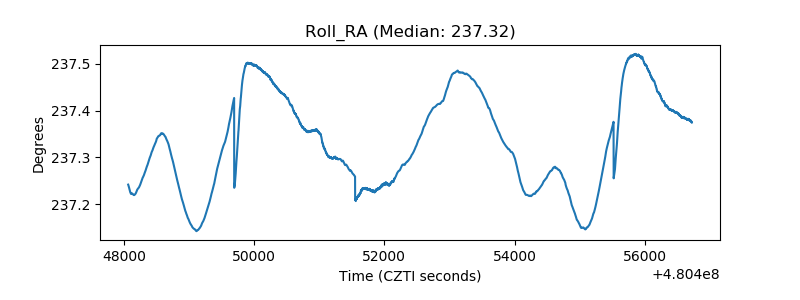 |
| Veto Counter | 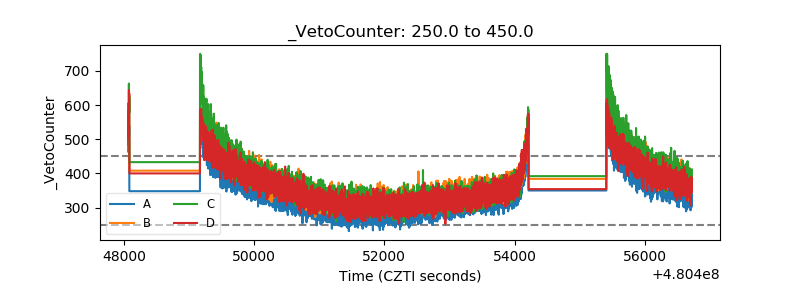 |