| Param | Original file | Final file |
|---|---|---|
| Filename | modeM0/AS1C07_001T03_9000006456_51306cztM0_level2.fits | modeM0/AS1C07_001T03_9000006456_51306cztM0_level2_quad_clean.evt |
| Size (bytes) | 790,441,920 | 85,199,040 |
| Size | 753.8 MB | 81.3 MB |
| Events in quadrant A | 4,791,310 | 633,153 |
| Events in quadrant B | 4,175,913 | 684,168 |
| Events in quadrant C | 12,298,403 | 294,915 |
| Events in quadrant D | 7,501,251 | 522,383 |
| Mode SS | |||
|---|---|---|---|
| Quadrant | BADHDUFLAG | Total packets | Discarded packets |
| A | 0 | 130 | 0 |
| B | 0 | 130 | 0 |
| C | 0 | 130 | 0 |
| D | 0 | 130 | 0 |
| Mode M0 | |||
|---|---|---|---|
| Quadrant | BADHDUFLAG | Total packets | Discarded packets |
| A | 0 | 18563 | 3 |
| B | 0 | 16898 | 2 |
| C | 0 | 40817 | 2 |
| D | 0 | 26745 | 2 |
| Mode M9 | |||
|---|---|---|---|
| Quadrant | BADHDUFLAG | Total packets | Discarded packets |
| A | 0 | 22 | 0 |
| B | 0 | 23 | 0 |
| C | 0 | 23 | 0 |
| D | 0 | 23 | 0 |
| Quadrant | Total seconds | Saturated seconds | Saturation percentage |
|---|---|---|---|
| A | 6376 | 79 | 1.239021% |
| B | 6376 | 280 | 4.391468% |
| C | 6376 | 3751 | 58.829987% |
| D | 6376 | 758 | 11.888331% |
Noise dominated data is calculated using 1-second bins in cleaned event files. If a bin has >2000 counts, and if more than 50% of those come from <1% of pixels, then it is considered to be noise-dominated and hence unusable.
| Quadrant | # 1 sec bins | Bins with >0 counts | Bins with >2000 counts | High rate bins dominated by noise | Noise dominated (total time) | Noise dominated (detector-on time) | Marked lightcurve |
|---|---|---|---|---|---|---|---|
| A | 7586 | 6377 | 17 | 17 | 0.22% | 0.27% | 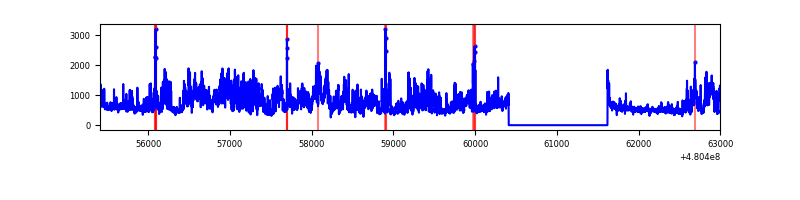 |
| B | 7586 | 6377 | 131 | 131 | 1.73% | 2.05% | 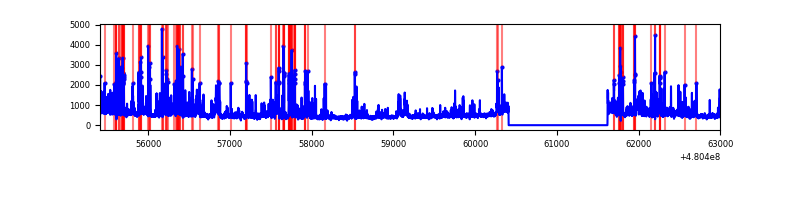 |
| C | 7586 | 6377 | 3191 | 3191 | 42.06% | 50.04% | 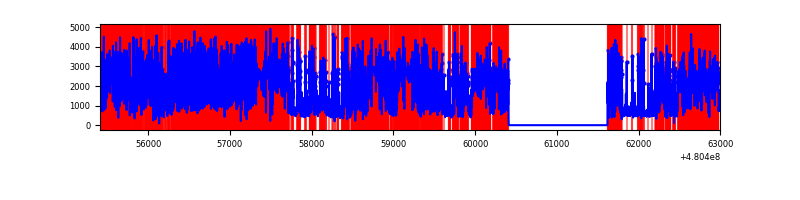 |
| D | 7586 | 6377 | 788 | 788 | 10.39% | 12.36% | 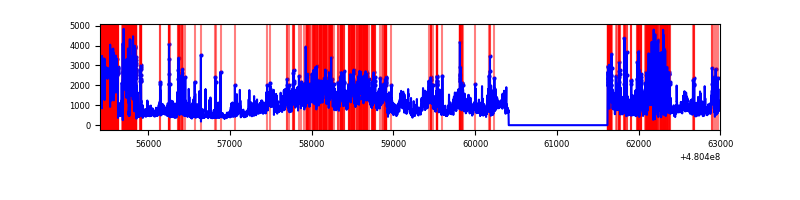 |
Top three noisy pixels from each quadrant. If the there are fewer than three noisy pixels in the level2.evt file, extra rows are filled as -1
| Pixel properties | Quadrant properties | ||||||
|---|---|---|---|---|---|---|---|
| Quadrant | DetID | PixID | Counts | Sigma | Mean | Median | Sigma |
| A | 12 | 3 | 1380162 | 8170.59 | 683 | 666 | 168.8 |
| A | 4 | 3 | 168955 | 996.76 | 683 | 666 | 168.8 |
| A | 12 | 194 | 164275 | 969.04 | 683 | 666 | 168.8 |
| B | 5 | 172 | 493442 | 3404.26 | 685 | 661 | 144.8 |
| B | 5 | 185 | 249139 | 1716.55 | 685 | 661 | 144.8 |
| B | 10 | 247 | 131924 | 906.8 | 685 | 661 | 144.8 |
| C | 4 | 12 | 9524283 | 70026.36 | 491 | 487 | 136.0 |
| C | 10 | 171 | 276767 | 2031.43 | 491 | 487 | 136.0 |
| C | 3 | 233 | 152078 | 1114.62 | 491 | 487 | 136.0 |
| D | 8 | 176 | 2525812 | 14496.95 | 619 | 596 | 174.2 |
| D | 3 | 12 | 1675165 | 9613.49 | 619 | 596 | 174.2 |
| D | 12 | 2 | 123884 | 707.78 | 619 | 596 | 174.2 |
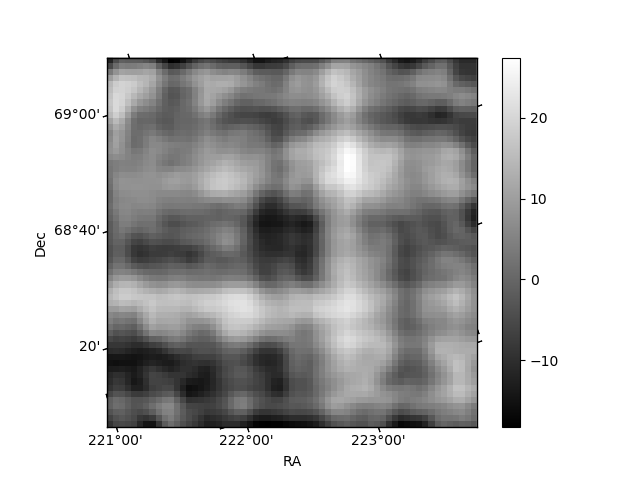
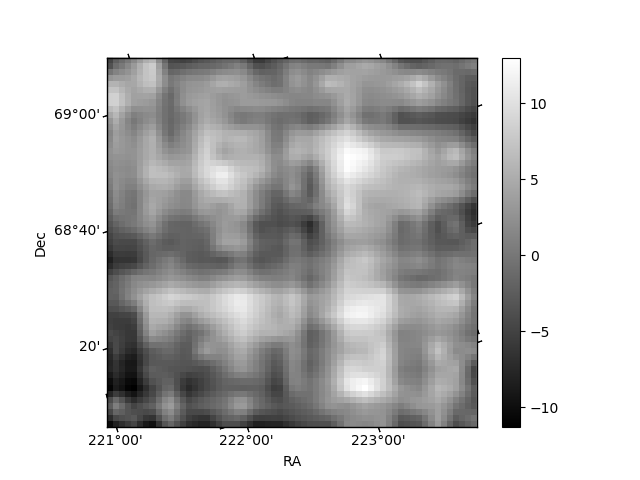
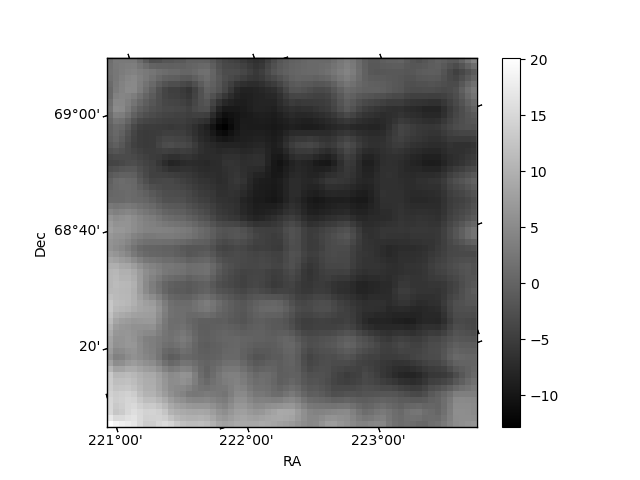
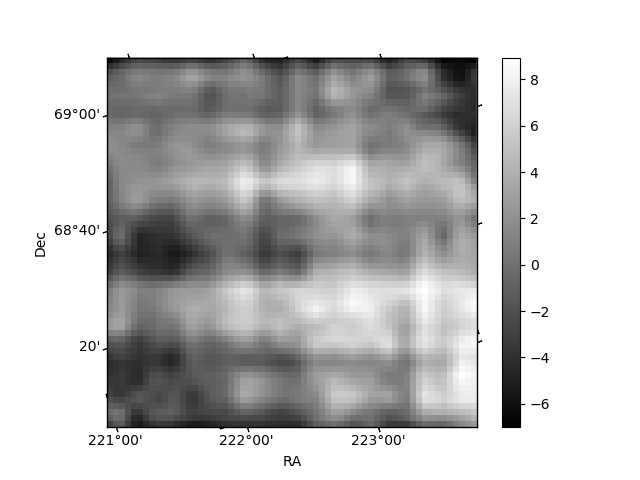
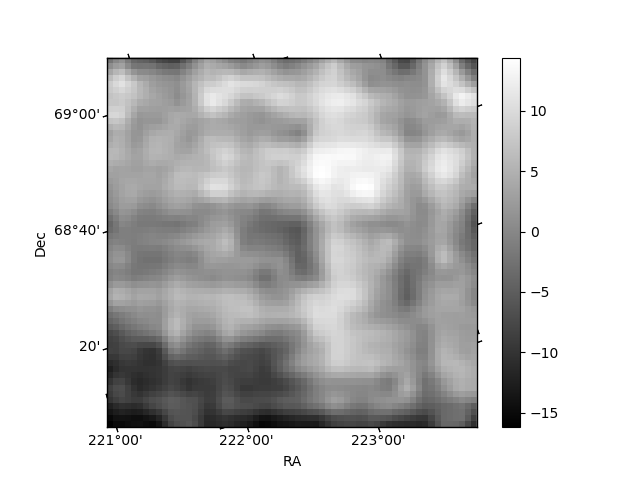
Histogram calculated using DETX and DETY for each event in the final _common_clean file
| Quadrant A | 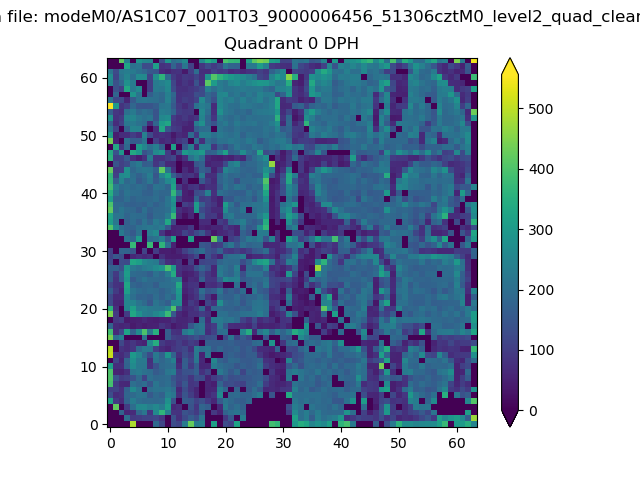 |
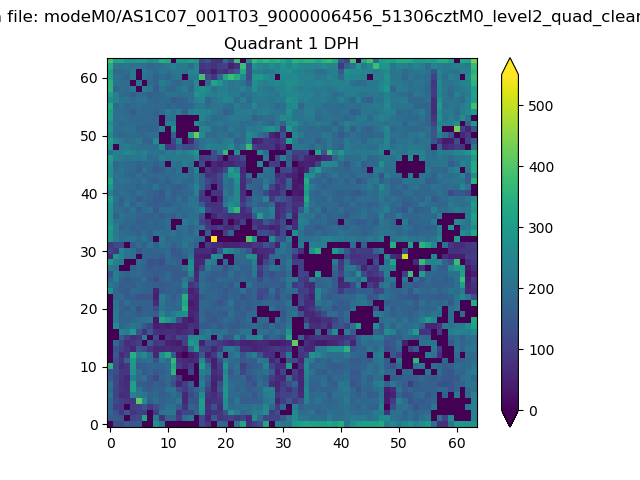 |
Quadrant B |
|---|---|---|---|
| Quadrant D | 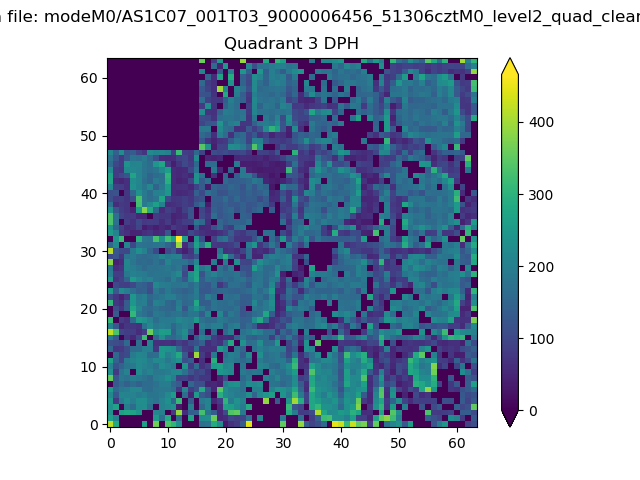 |
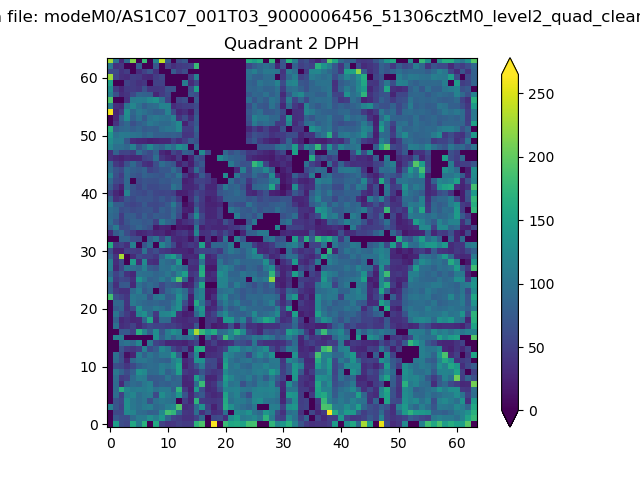 |
Quadrant C |
| Plot type | Count rate plots | Images |
|---|---|---|
| Comparison with Poisson distribution Blue bars denote a histogram of data divided into 1 sec bins. Red curve is a Poisson curve with rate = median count rate of data. |
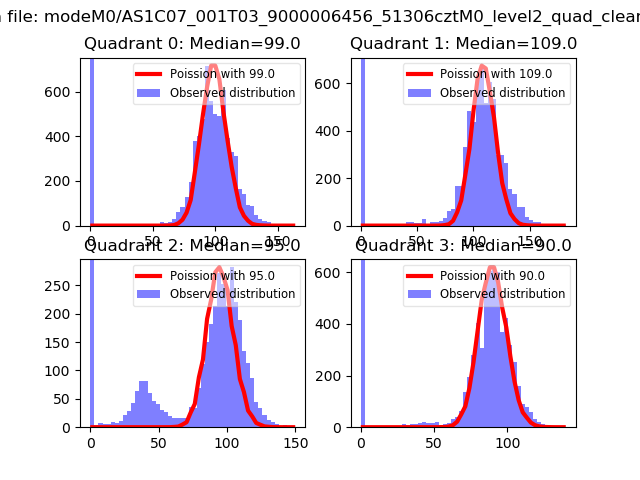 |
 |
| Quadrant-wise count rates Data is divided into 100 sec bins |
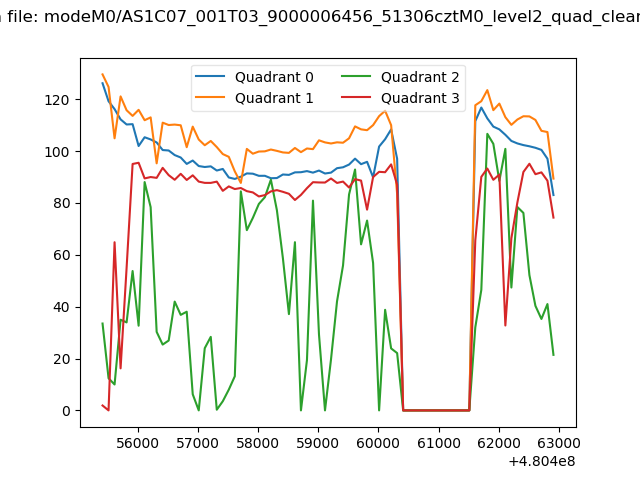 |
|
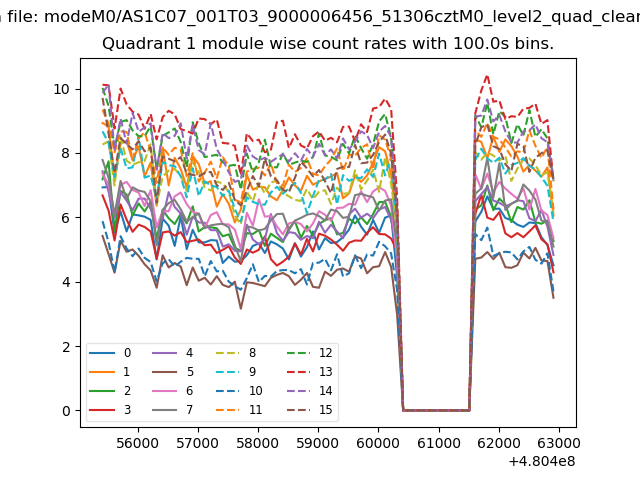
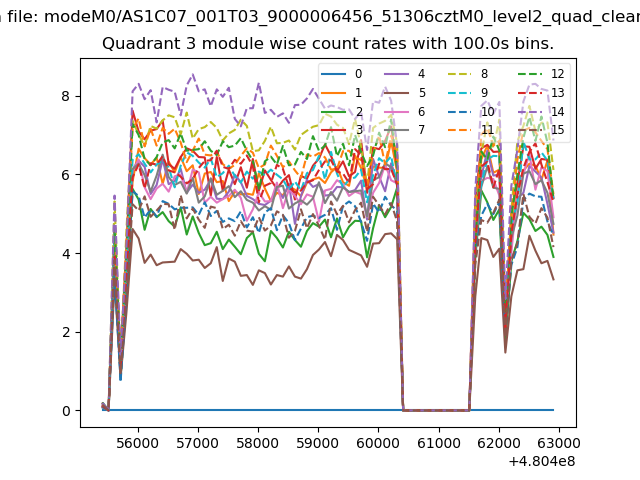
| Module-wise count rates for Quadrant A Data is divided into 100 sec bins |
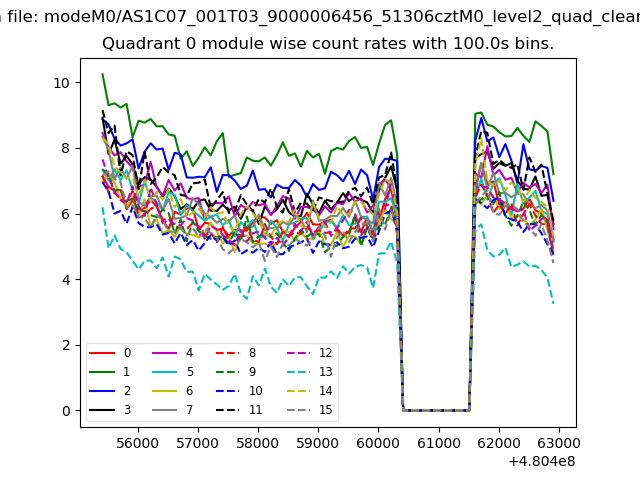 |
 |
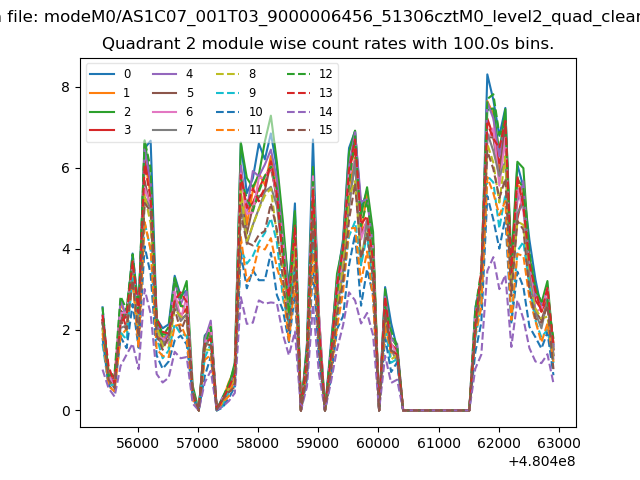
| Module-wise count rates for Quadrant B Data is divided into 100 sec bins |
 |
 |
| Module-wise count rates for Quadrant C Data is divided into 100 sec bins |
 |
 |
| Module-wise count rates for Quadrant D Data is divided into 100 sec bins |
 |
 |
| Parameter | Plot |
|---|---|
| CZT HV Monitor | 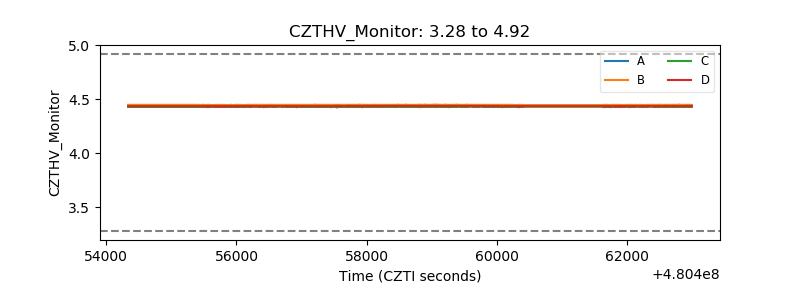 |
| D_VDD | 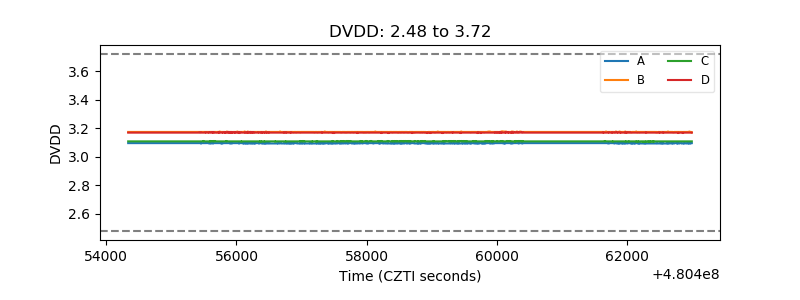 |
| Temperature 1 | 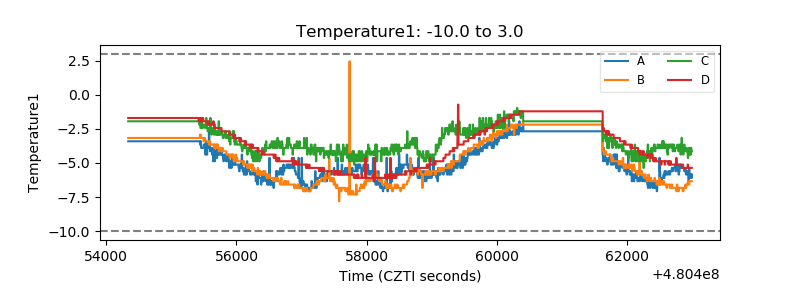 |
| Veto HV Monitor | 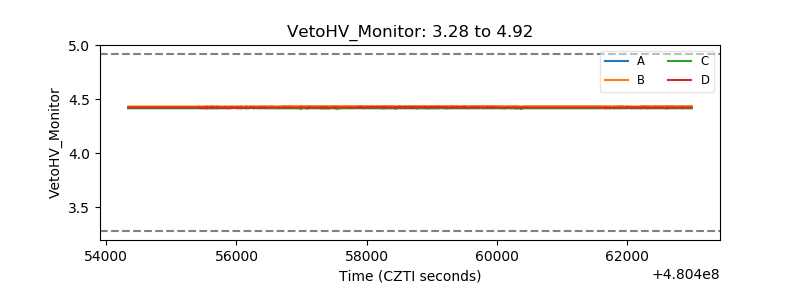 |
| Veto LLD | 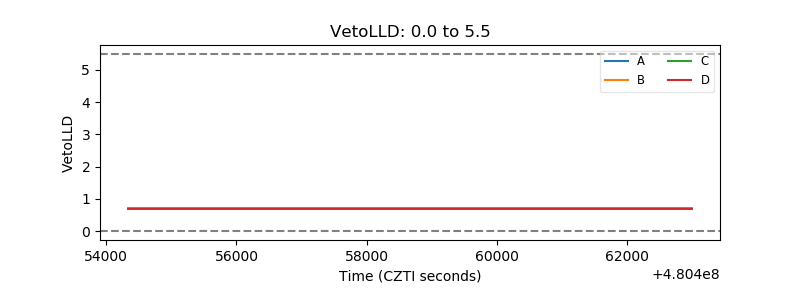 |
| Alpha Counter | 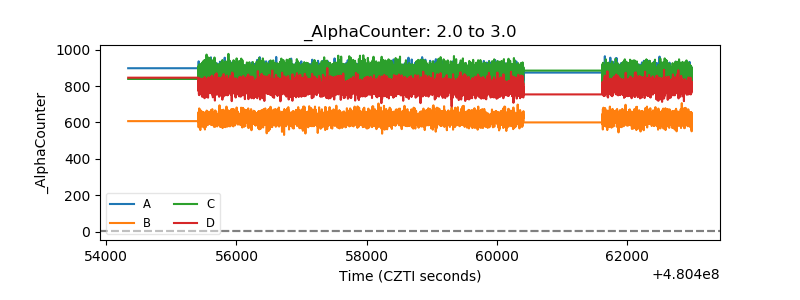 |
| _CPM_Rate | 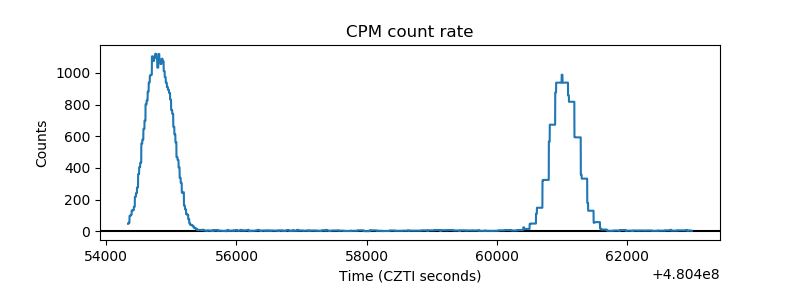 |
| CZT Counter | 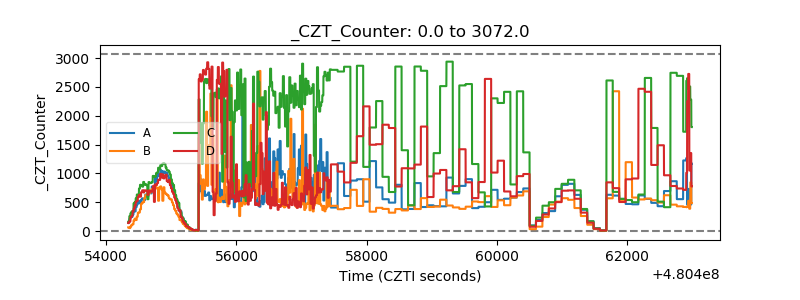 |
| +2.5 Volts monitor | 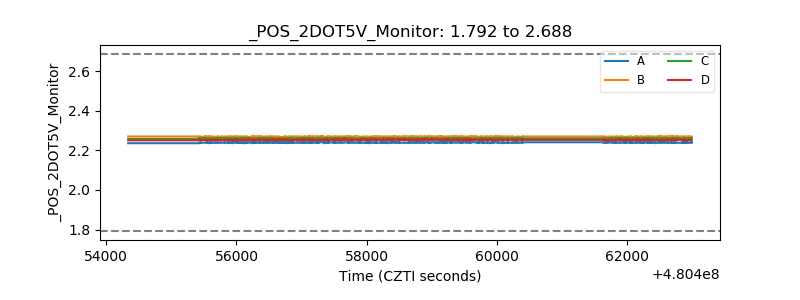 |
| +5 Volts monitor | 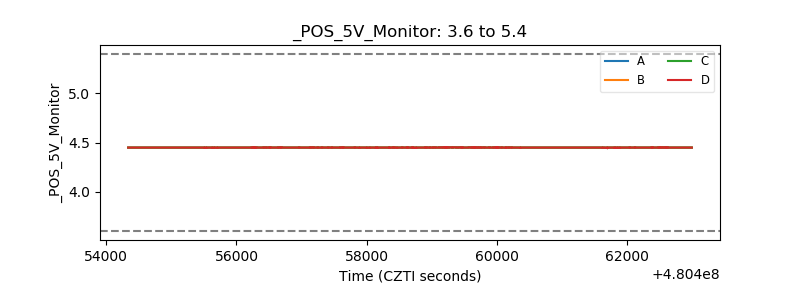 |
| _ROLL_ROT | 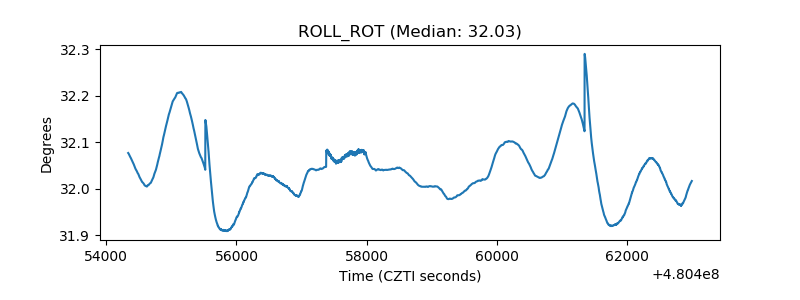 |
| _Roll_DEC | 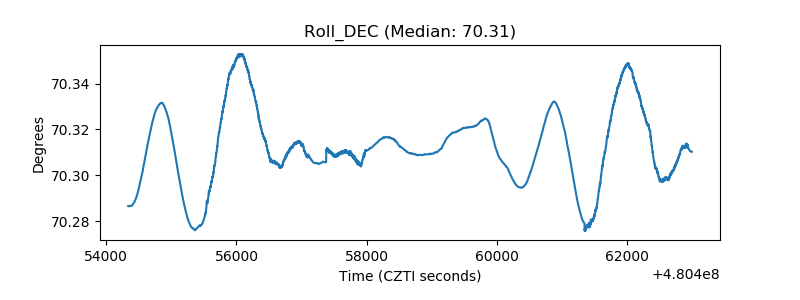 |
| _Roll_RA | 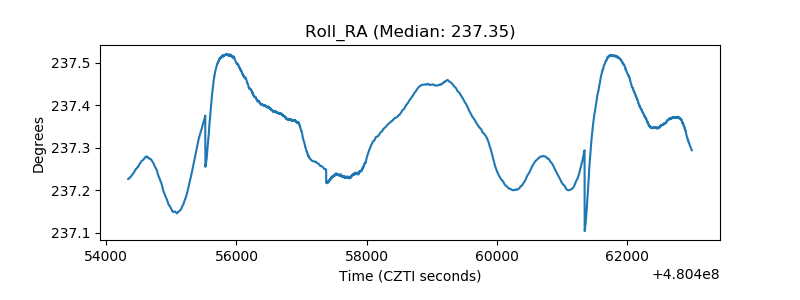 |
| Veto Counter | 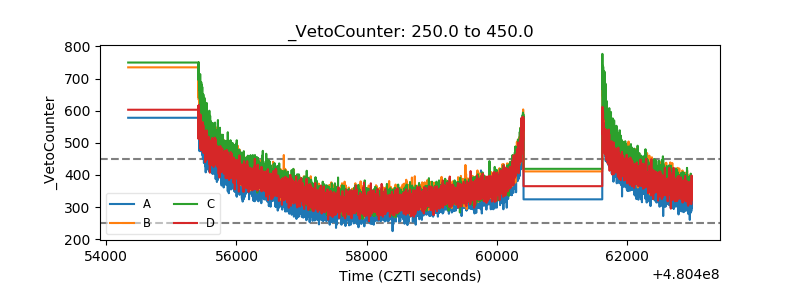 |