| Param | Original file | Final file |
|---|---|---|
| Filename | modeM0/AS1C07_001T03_9000006456_51307cztM0_level2.fits | modeM0/AS1C07_001T03_9000006456_51307cztM0_level2_quad_clean.evt |
| Size (bytes) | 620,228,160 | 91,022,400 |
| Size | 591.5 MB | 86.8 MB |
| Events in quadrant A | 3,954,470 | 611,419 |
| Events in quadrant B | 3,930,424 | 671,705 |
| Events in quadrant C | 7,077,216 | 516,641 |
| Events in quadrant D | 7,511,189 | 518,221 |
| Mode SS | |||
|---|---|---|---|
| Quadrant | BADHDUFLAG | Total packets | Discarded packets |
| A | 0 | 128 | 0 |
| B | 0 | 128 | 0 |
| C | 0 | 128 | 0 |
| D | 0 | 128 | 0 |
| Mode M0 | |||
|---|---|---|---|
| Quadrant | BADHDUFLAG | Total packets | Discarded packets |
| A | 0 | 16111 | 2 |
| B | 0 | 16146 | 2 |
| C | 0 | 25329 | 2 |
| D | 0 | 26668 | 2 |
| Mode M9 | |||
|---|---|---|---|
| Quadrant | BADHDUFLAG | Total packets | Discarded packets |
| A | 0 | 18 | 0 |
| B | 0 | 19 | 0 |
| C | 0 | 19 | 0 |
| D | 0 | 19 | 0 |
| Quadrant | Total seconds | Saturated seconds | Saturation percentage |
|---|---|---|---|
| A | 6277 | 68 | 1.083320% |
| B | 6277 | 156 | 2.485264% |
| C | 6277 | 1182 | 18.830652% |
| D | 6277 | 691 | 11.008444% |
Noise dominated data is calculated using 1-second bins in cleaned event files. If a bin has >2000 counts, and if more than 50% of those come from <1% of pixels, then it is considered to be noise-dominated and hence unusable.
| Quadrant | # 1 sec bins | Bins with >0 counts | Bins with >2000 counts | High rate bins dominated by noise | Noise dominated (total time) | Noise dominated (detector-on time) | Marked lightcurve |
|---|---|---|---|---|---|---|---|
| A | 7487 | 6278 | 26 | 26 | 0.35% | 0.41% | 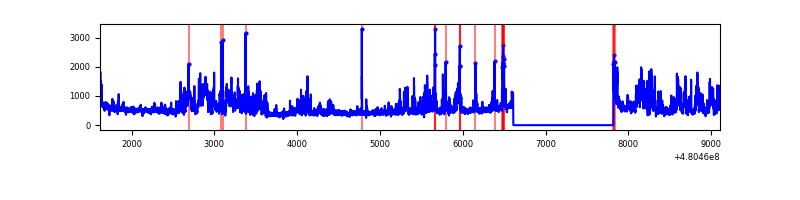 |
| B | 7487 | 6278 | 78 | 78 | 1.04% | 1.24% | 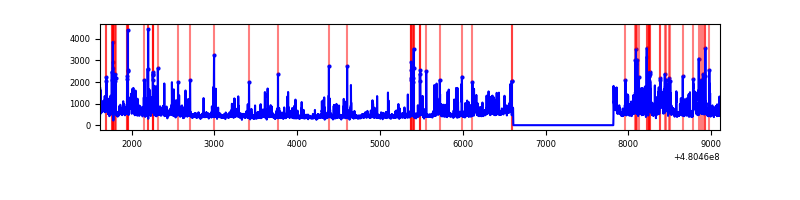 |
| C | 7487 | 6278 | 1107 | 1107 | 14.79% | 17.63% | 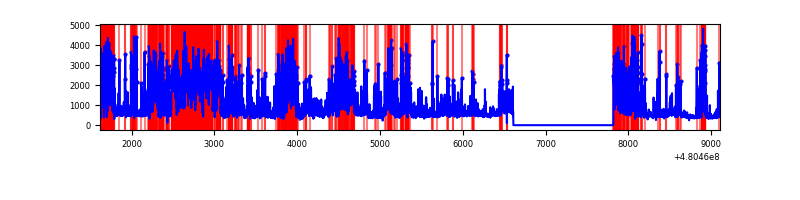 |
| D | 7487 | 6278 | 809 | 809 | 10.81% | 12.89% | 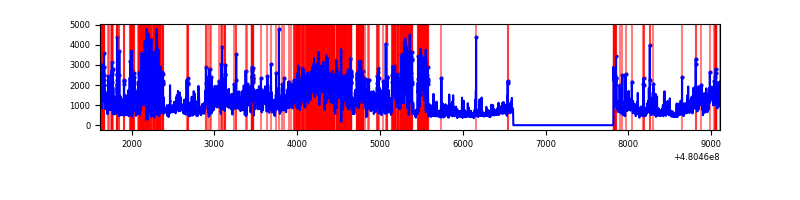 |
Top three noisy pixels from each quadrant. If the there are fewer than three noisy pixels in the level2.evt file, extra rows are filled as -1
| Pixel properties | Quadrant properties | ||||||
|---|---|---|---|---|---|---|---|
| Quadrant | DetID | PixID | Counts | Sigma | Mean | Median | Sigma |
| A | 12 | 3 | 776518 | 4782.25 | 657 | 640 | 162.2 |
| A | 4 | 3 | 152058 | 933.29 | 657 | 640 | 162.2 |
| A | 12 | 194 | 95150 | 582.53 | 657 | 640 | 162.2 |
| B | 5 | 172 | 295656 | 2103.52 | 664 | 643 | 140.2 |
| B | 5 | 185 | 225636 | 1604.26 | 664 | 643 | 140.2 |
| B | 10 | 254 | 169319 | 1202.7 | 664 | 643 | 140.2 |
| C | 4 | 12 | 4072070 | 23991.41 | 608 | 603 | 169.7 |
| C | 13 | 3 | 151786 | 890.86 | 608 | 603 | 169.7 |
| C | 10 | 252 | 83563 | 488.85 | 608 | 603 | 169.7 |
| D | 8 | 176 | 2795043 | 16256.4 | 615 | 592 | 171.9 |
| D | 3 | 12 | 786580 | 4572.4 | 615 | 592 | 171.9 |
| D | 6 | 42 | 605980 | 3521.78 | 615 | 592 | 171.9 |
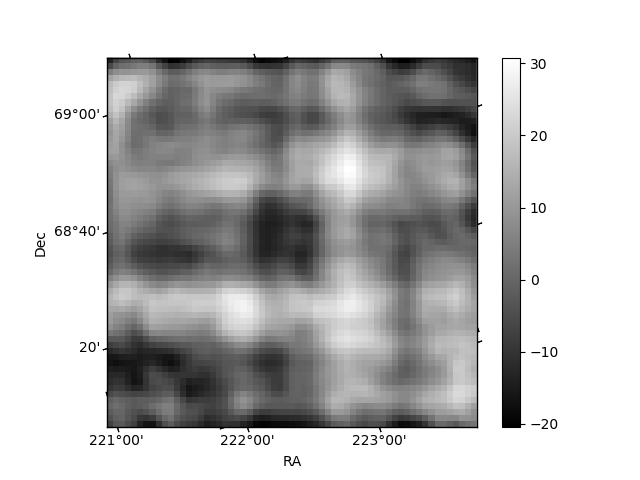
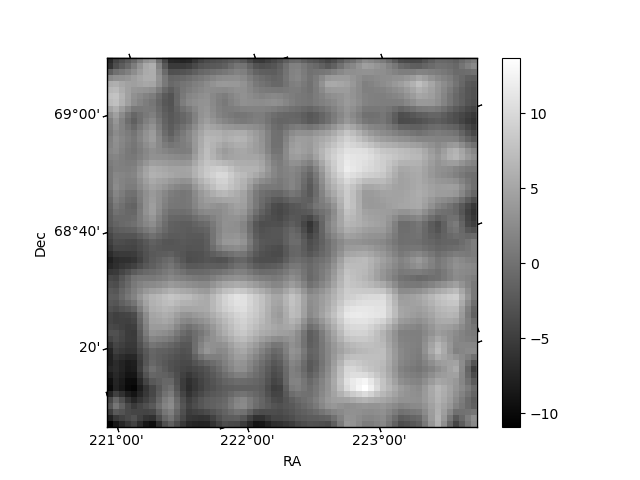
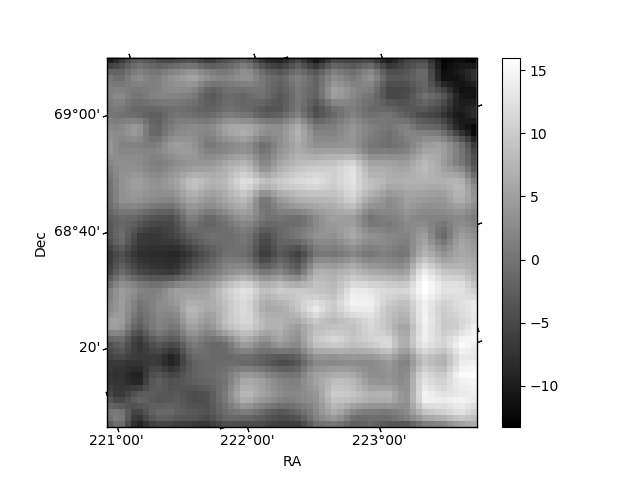
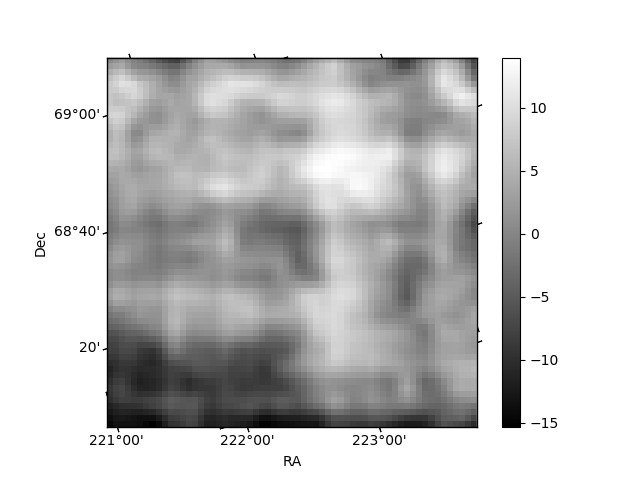
Histogram calculated using DETX and DETY for each event in the final _common_clean file
| Quadrant A | 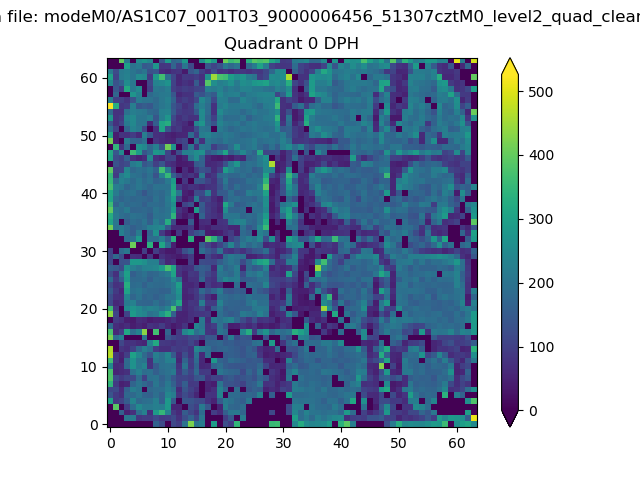 |
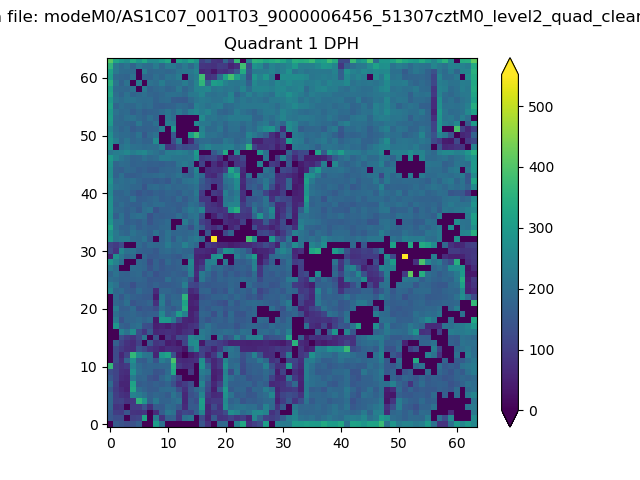 |
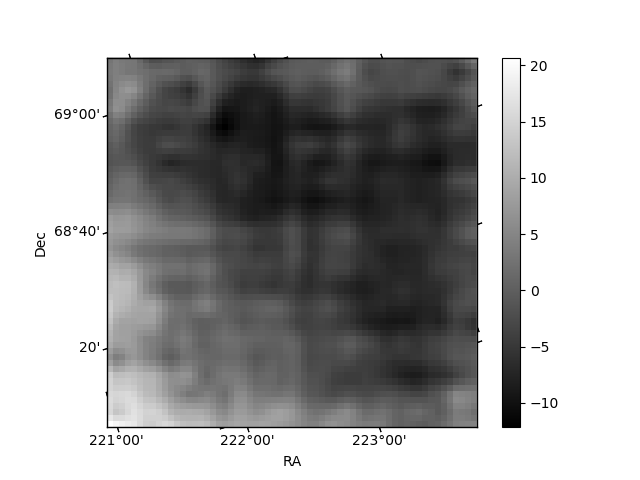
Quadrant B |
|---|---|---|---|
| Quadrant D | 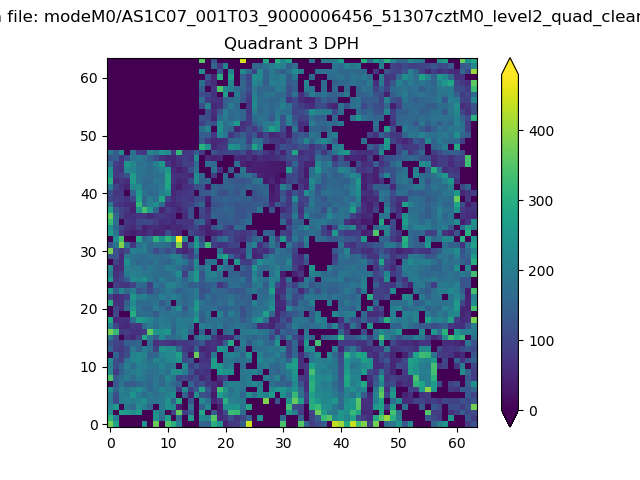 |
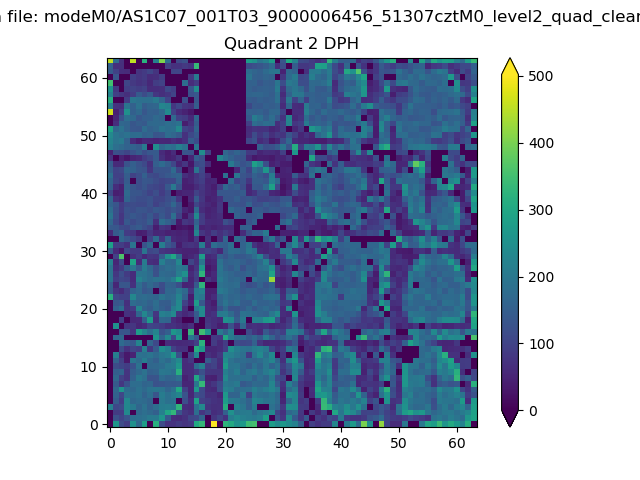 |
Quadrant C |
| Plot type | Count rate plots | Images |
|---|---|---|
| Comparison with Poisson distribution Blue bars denote a histogram of data divided into 1 sec bins. Red curve is a Poisson curve with rate = median count rate of data. |
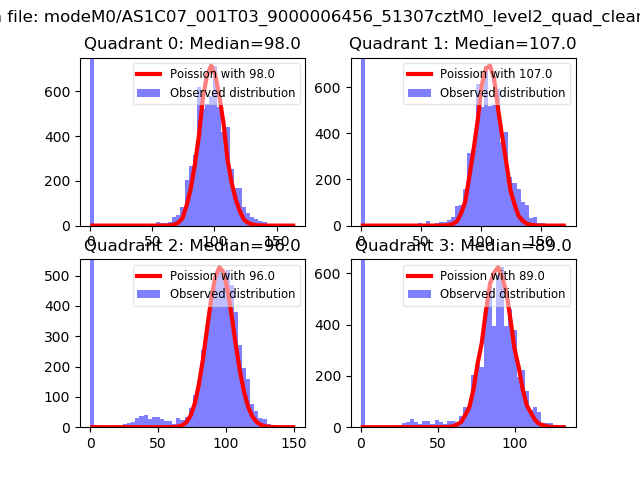 |
 |
| Quadrant-wise count rates Data is divided into 100 sec bins |
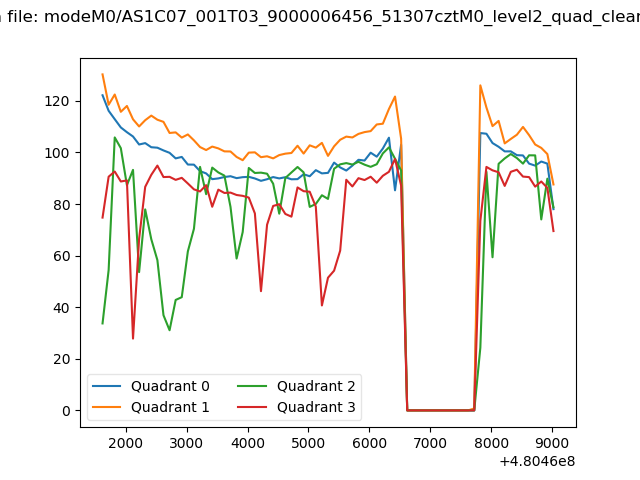 |
|
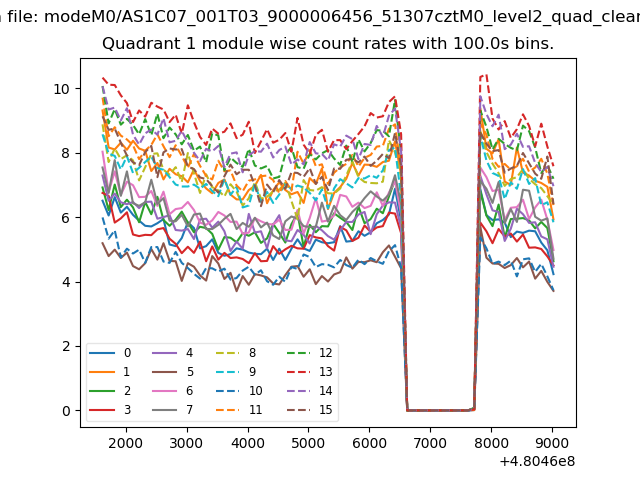
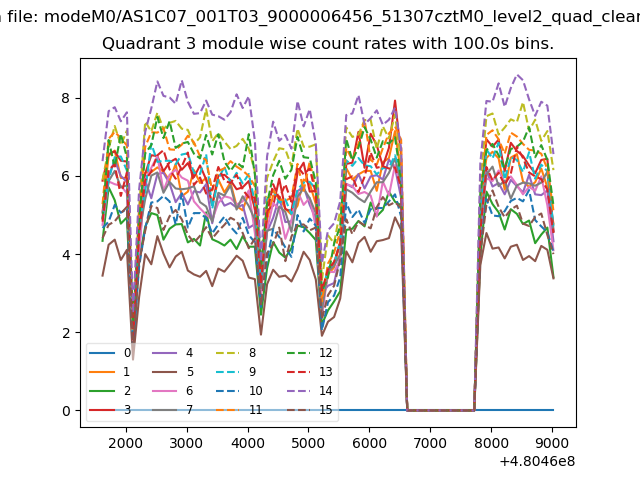
| Module-wise count rates for Quadrant A Data is divided into 100 sec bins |
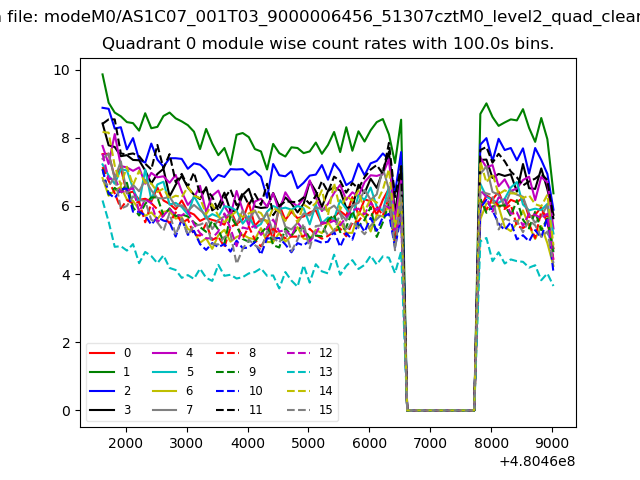 |
 |
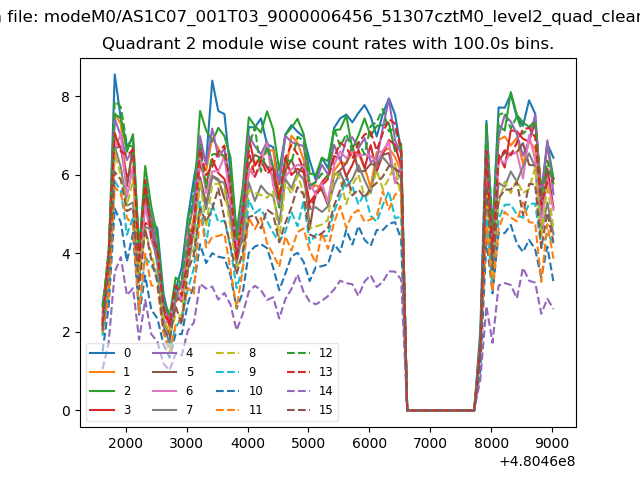
| Module-wise count rates for Quadrant B Data is divided into 100 sec bins |
 |
 |
| Module-wise count rates for Quadrant C Data is divided into 100 sec bins |
 |
 |
| Module-wise count rates for Quadrant D Data is divided into 100 sec bins |
 |
 |
| Parameter | Plot |
|---|---|
| CZT HV Monitor | 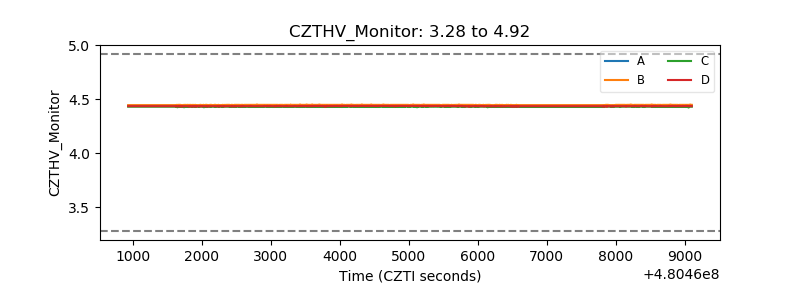 |
| D_VDD | 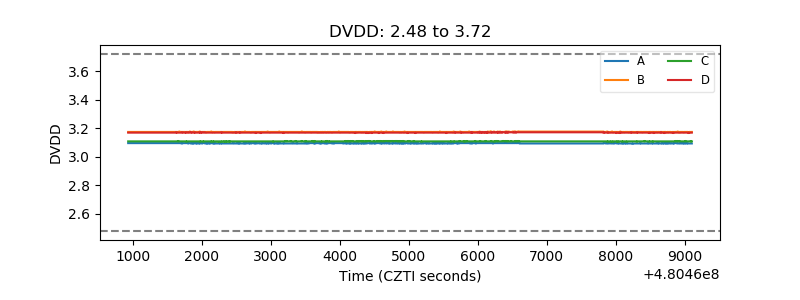 |
| Temperature 1 | 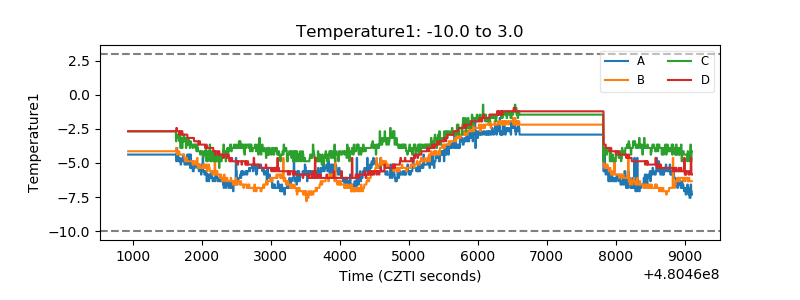 |
| Veto HV Monitor | 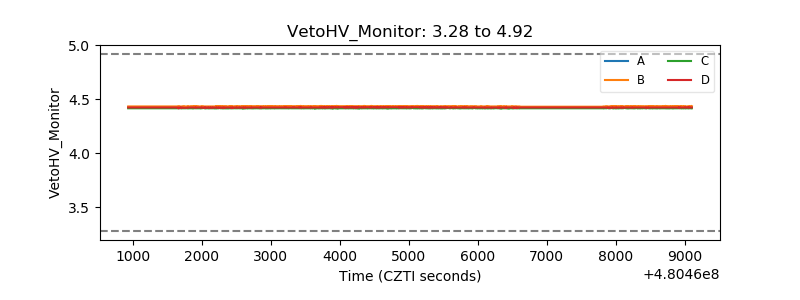 |
| Veto LLD | 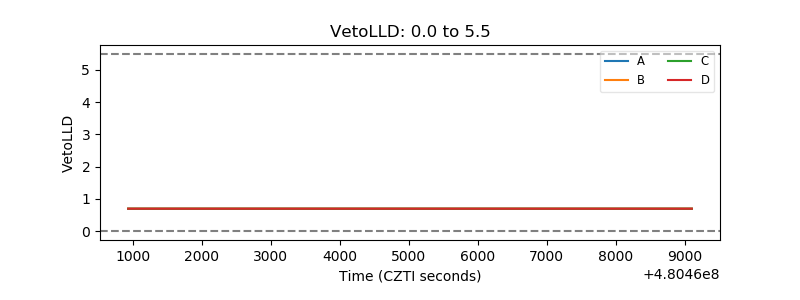 |
| Alpha Counter | 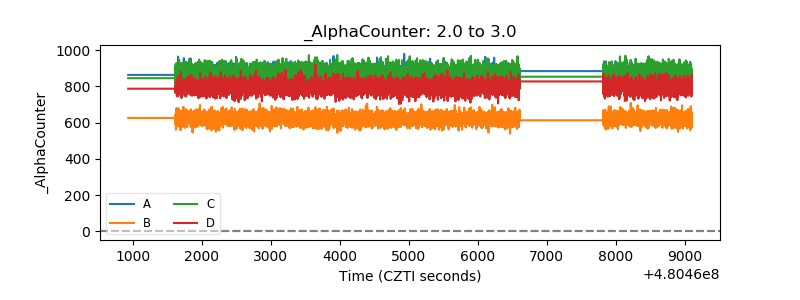 |
| _CPM_Rate | 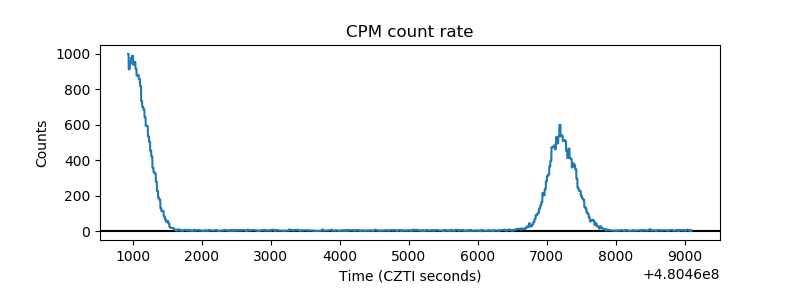 |
| CZT Counter | 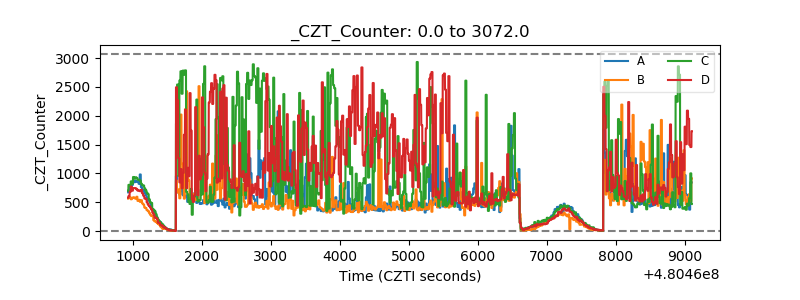 |
| +2.5 Volts monitor | 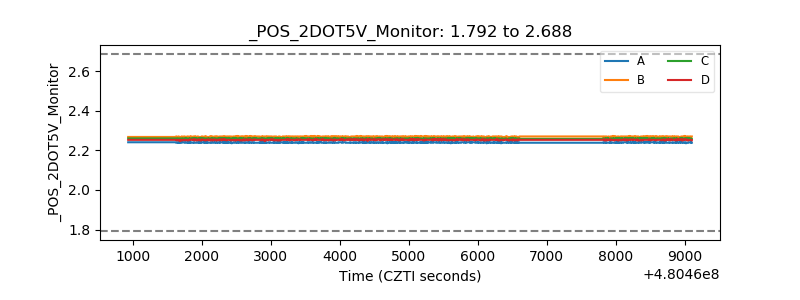 |
| +5 Volts monitor | 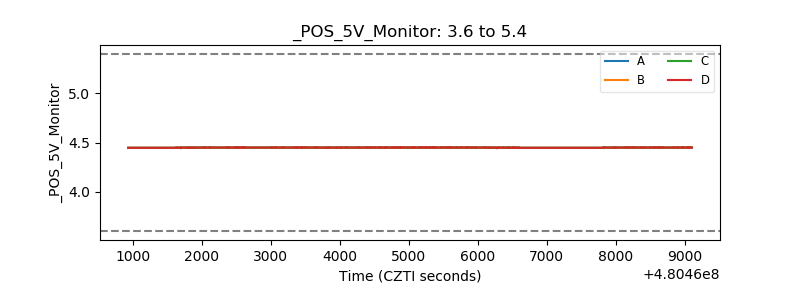 |
| _ROLL_ROT | 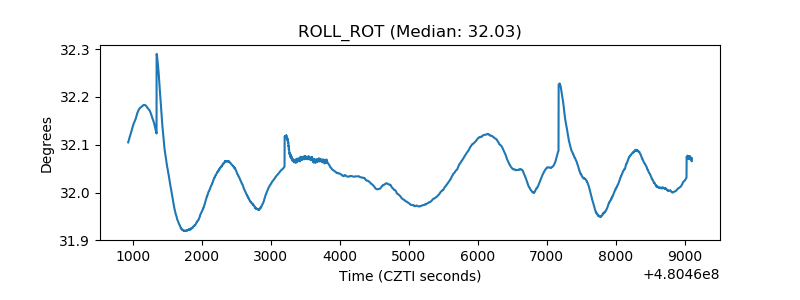 |
| _Roll_DEC | 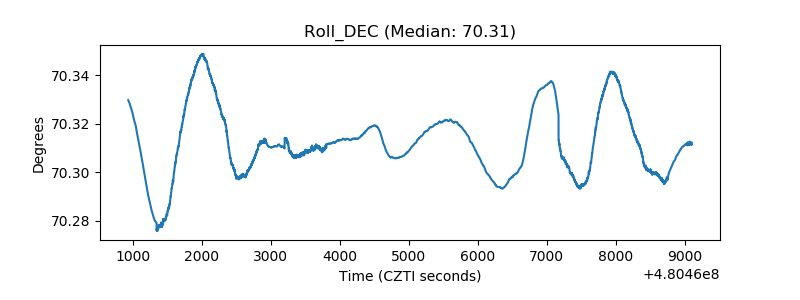 |
| _Roll_RA | 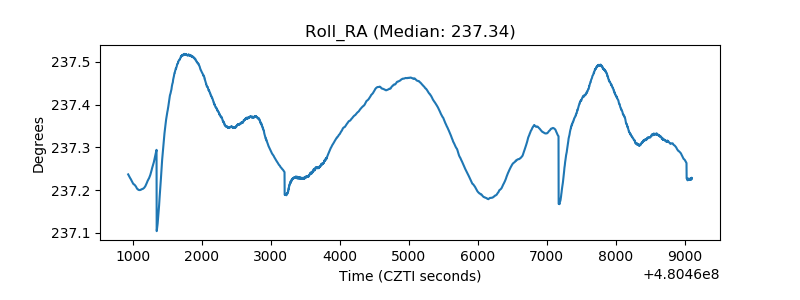 |
| Veto Counter | 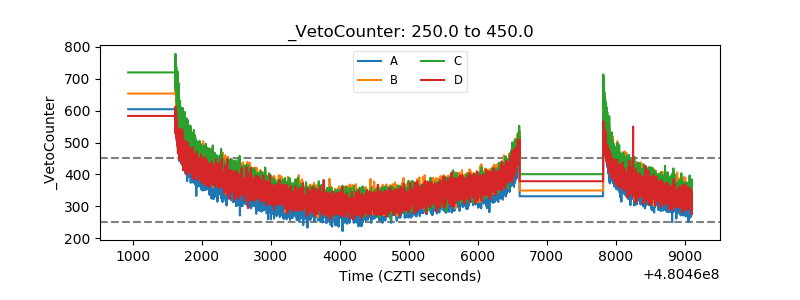 |