| Param | Original file | Final file |
|---|---|---|
| Filename | modeM0/AS1C07_001T03_9000006456_51308cztM0_level2.fits | modeM0/AS1C07_001T03_9000006456_51308cztM0_level2_quad_clean.evt |
| Size (bytes) | 727,341,120 | 103,276,800 |
| Size | 693.6 MB | 98.5 MB |
| Events in quadrant A | 5,371,180 | 685,365 |
| Events in quadrant B | 4,475,341 | 757,572 |
| Events in quadrant C | 6,812,539 | 624,587 |
| Events in quadrant D | 9,704,634 | 554,383 |
| Mode SS | |||
|---|---|---|---|
| Quadrant | BADHDUFLAG | Total packets | Discarded packets |
| A | 0 | 150 | 0 |
| B | 0 | 150 | 0 |
| C | 0 | 150 | 0 |
| D | 0 | 150 | 0 |
| Mode M0 | |||
|---|---|---|---|
| Quadrant | BADHDUFLAG | Total packets | Discarded packets |
| A | 0 | 21003 | 2 |
| B | 0 | 18445 | 2 |
| C | 0 | 25277 | 2 |
| D | 0 | 33884 | 2 |
| Mode M9 | |||
|---|---|---|---|
| Quadrant | BADHDUFLAG | Total packets | Discarded packets |
| A | 0 | 22 | 0 |
| B | 0 | 22 | 0 |
| C | 0 | 22 | 0 |
| D | 0 | 22 | 0 |
| Quadrant | Total seconds | Saturated seconds | Saturation percentage |
|---|---|---|---|
| A | 7252 | 142 | 1.958081% |
| B | 7251 | 172 | 2.372087% |
| C | 7251 | 945 | 13.032685% |
| D | 7251 | 1176 | 16.218453% |
Noise dominated data is calculated using 1-second bins in cleaned event files. If a bin has >2000 counts, and if more than 50% of those come from <1% of pixels, then it is considered to be noise-dominated and hence unusable.
| Quadrant | # 1 sec bins | Bins with >0 counts | Bins with >2000 counts | High rate bins dominated by noise | Noise dominated (total time) | Noise dominated (detector-on time) | Marked lightcurve |
|---|---|---|---|---|---|---|---|
| A | 9477 | 7254 | 35 | 35 | 0.37% | 0.48% | 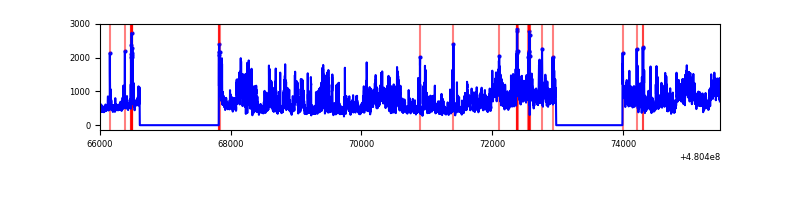 |
| B | 9476 | 7253 | 73 | 73 | 0.77% | 1.01% | 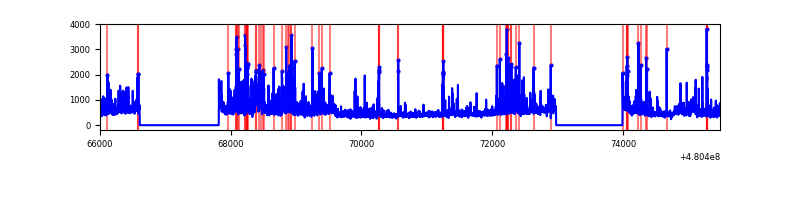 |
| C | 9476 | 7253 | 757 | 757 | 7.99% | 10.44% | 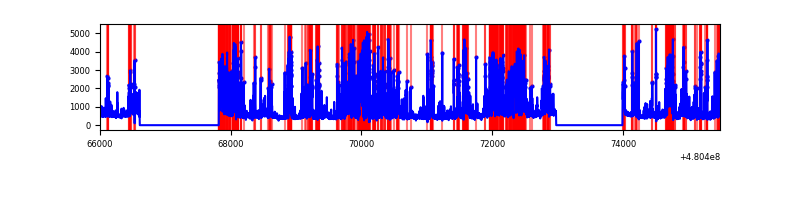 |
| D | 9476 | 7253 | 1322 | 1322 | 13.95% | 18.23% | 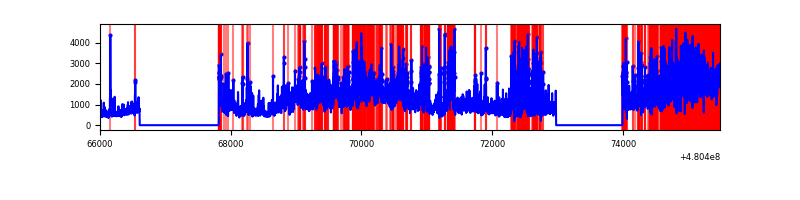 |
Top three noisy pixels from each quadrant. If the there are fewer than three noisy pixels in the level2.evt file, extra rows are filled as -1
| Pixel properties | Quadrant properties | ||||||
|---|---|---|---|---|---|---|---|
| Quadrant | DetID | PixID | Counts | Sigma | Mean | Median | Sigma |
| A | 12 | 3 | 1436724 | 7696.69 | 758 | 740 | 186.6 |
| A | 4 | 3 | 234840 | 1254.75 | 758 | 740 | 186.6 |
| A | 9 | 191 | 191541 | 1022.67 | 758 | 740 | 186.6 |
| B | 10 | 254 | 391337 | 2410.58 | 766 | 739 | 162.0 |
| B | 5 | 185 | 285223 | 1755.69 | 766 | 739 | 162.0 |
| B | 5 | 172 | 135393 | 831.02 | 766 | 739 | 162.0 |
| C | 4 | 12 | 3108303 | 15673.23 | 718 | 713 | 198.3 |
| C | 13 | 3 | 181378 | 911.19 | 718 | 713 | 198.3 |
| C | 12 | 252 | 140444 | 704.74 | 718 | 713 | 198.3 |
| D | 8 | 176 | 3923731 | 20059.15 | 700 | 675 | 195.6 |
| D | 12 | 2 | 1093797 | 5589.29 | 700 | 675 | 195.6 |
| D | 3 | 12 | 479885 | 2450.27 | 700 | 675 | 195.6 |
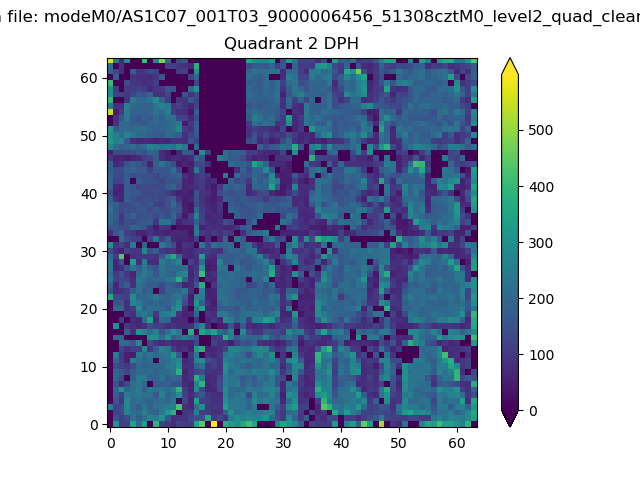
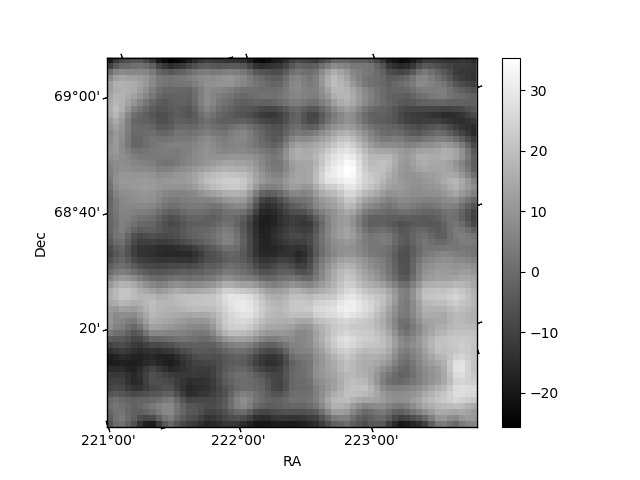
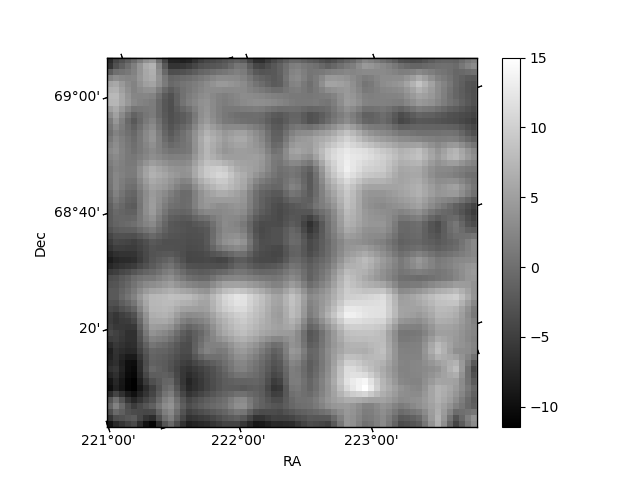
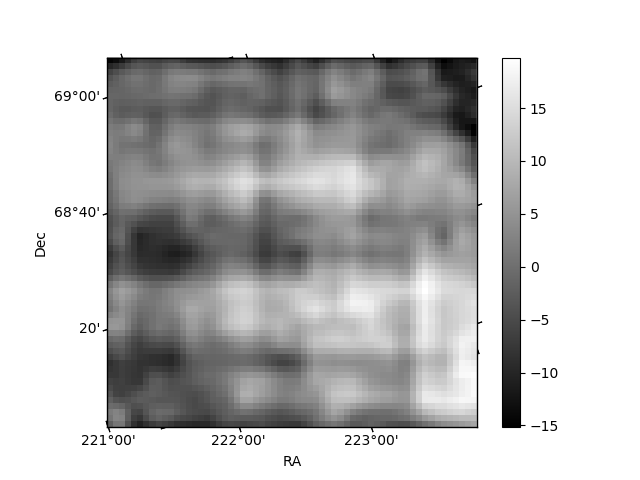
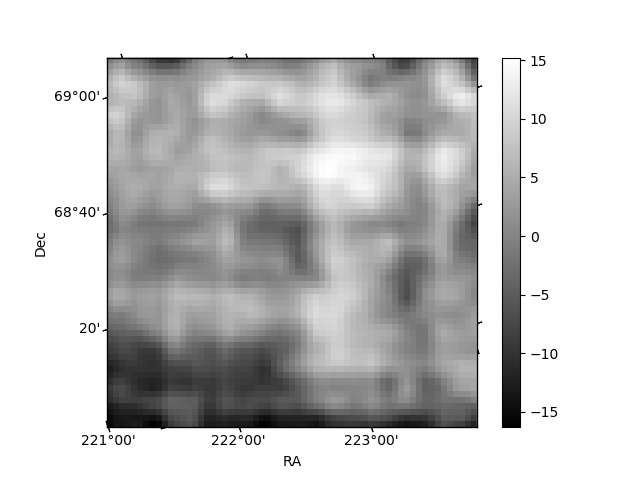
Histogram calculated using DETX and DETY for each event in the final _common_clean file
| Quadrant A | 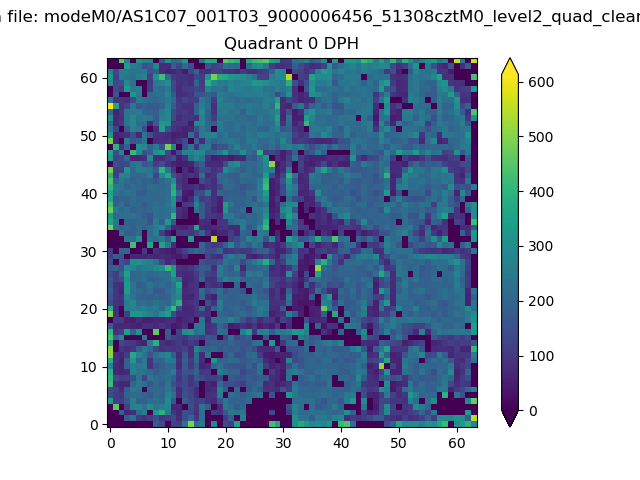 |
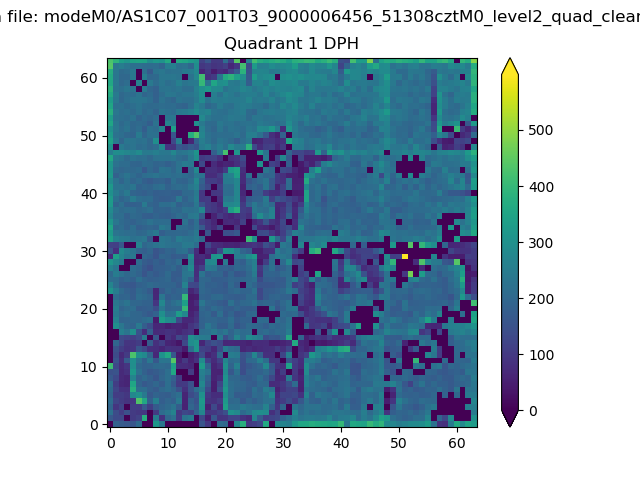 |
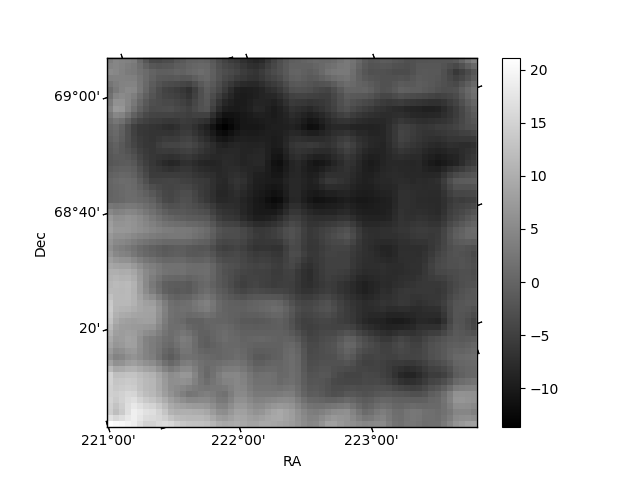
Quadrant B |
|---|---|---|---|
| Quadrant D | 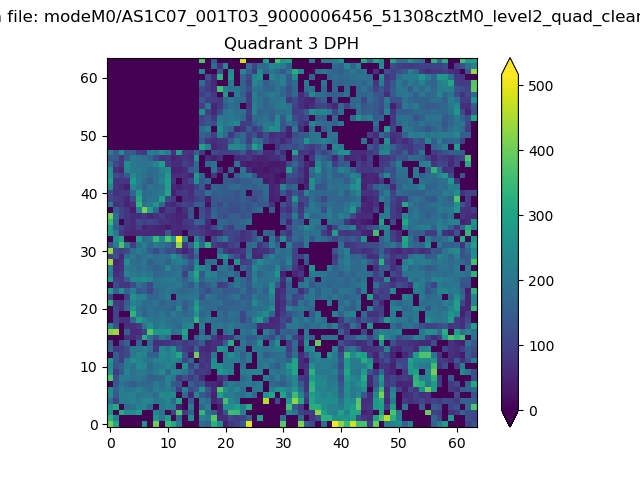 |
 |
Quadrant C |
| Plot type | Count rate plots | Images |
|---|---|---|
| Comparison with Poisson distribution Blue bars denote a histogram of data divided into 1 sec bins. Red curve is a Poisson curve with rate = median count rate of data. |
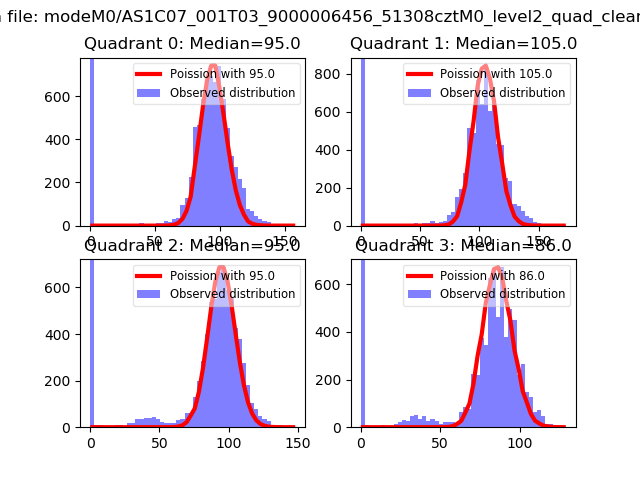 |
 |
| Quadrant-wise count rates Data is divided into 100 sec bins |
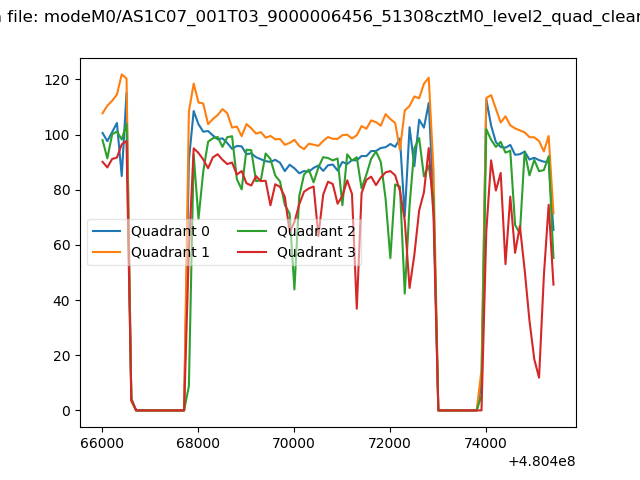 |
|
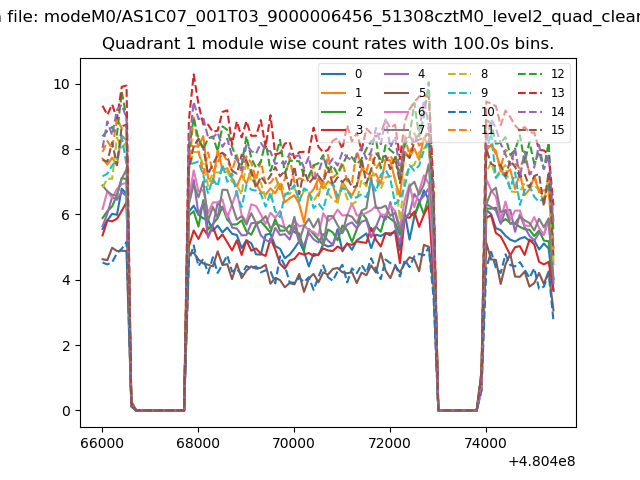
| Module-wise count rates for Quadrant A Data is divided into 100 sec bins |
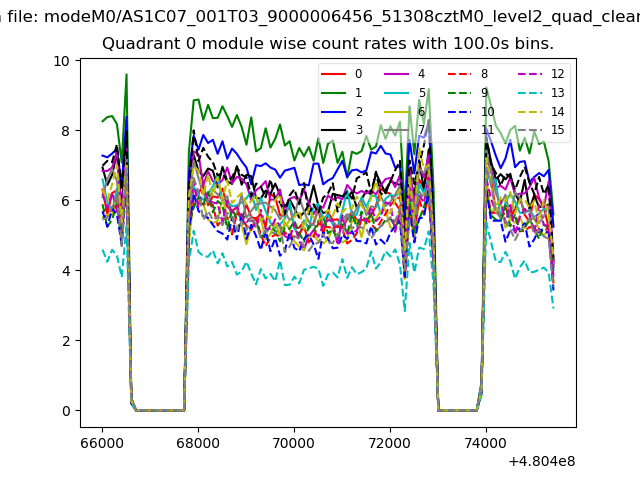 |
 |
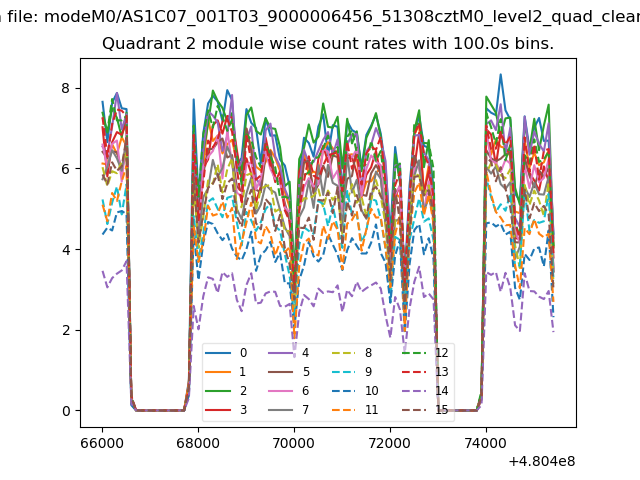
| Module-wise count rates for Quadrant B Data is divided into 100 sec bins |
 |
 |
| Module-wise count rates for Quadrant C Data is divided into 100 sec bins |
 |
 |
| Module-wise count rates for Quadrant D Data is divided into 100 sec bins |
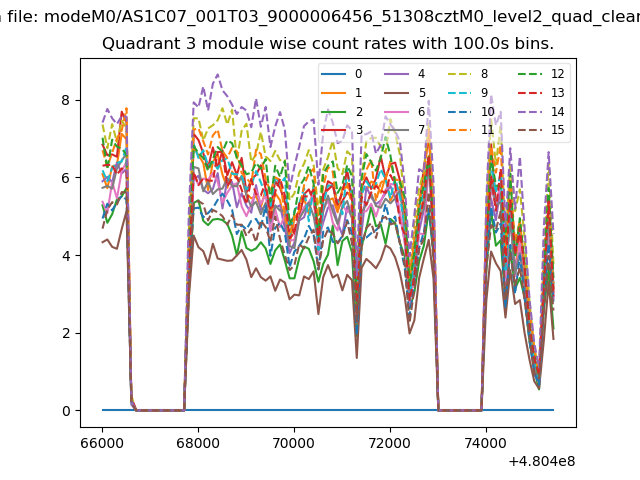 |
 |
| Parameter | Plot |
|---|---|
| CZT HV Monitor | 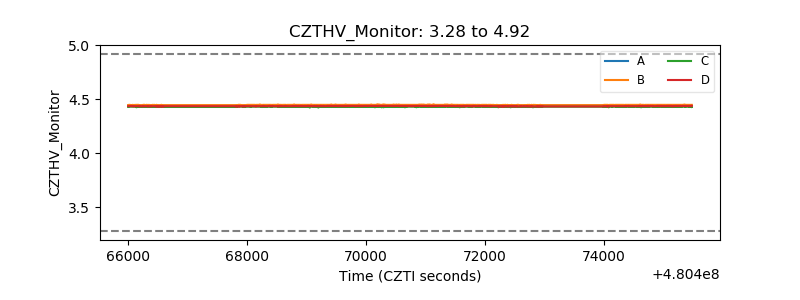 |
| D_VDD | 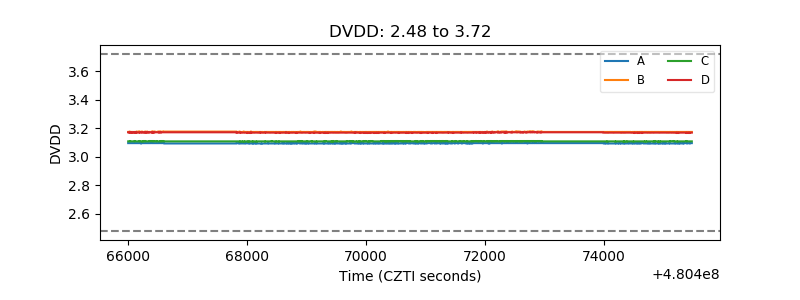 |
| Temperature 1 | 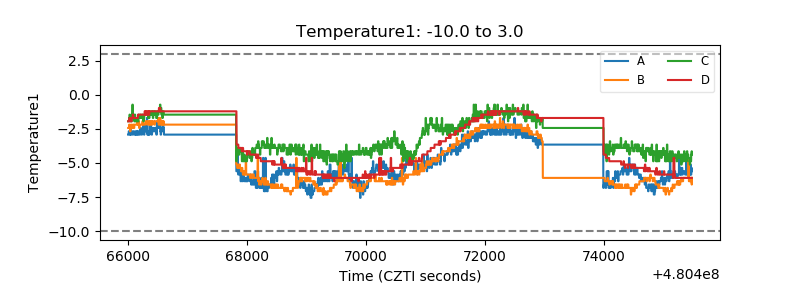 |
| Veto HV Monitor | 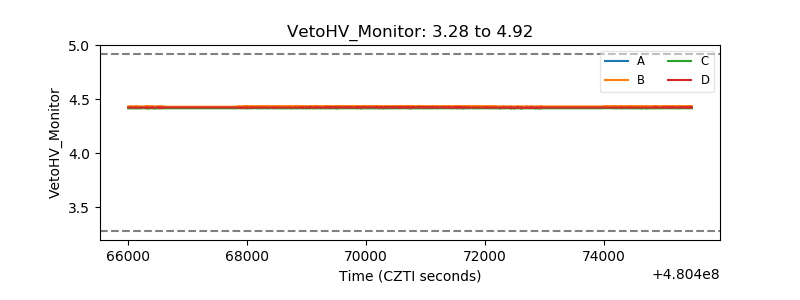 |
| Veto LLD | 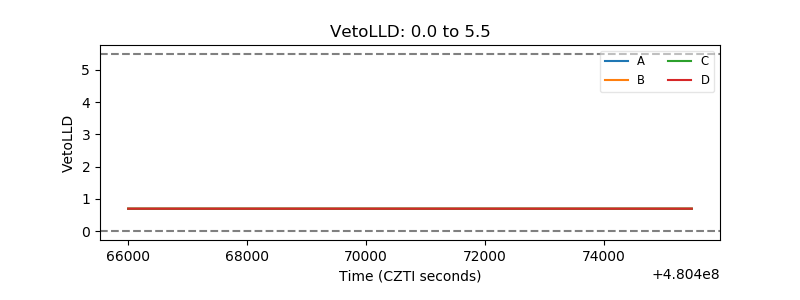 |
| Alpha Counter | 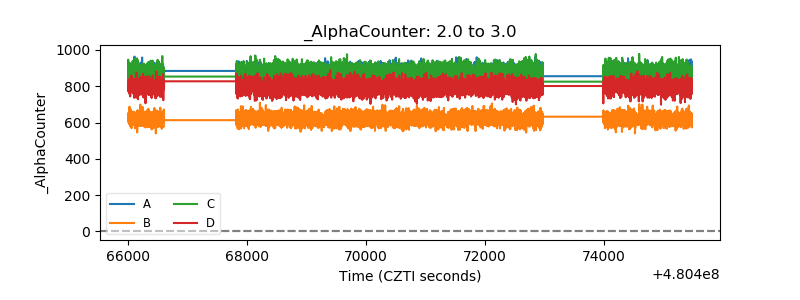 |
| _CPM_Rate | 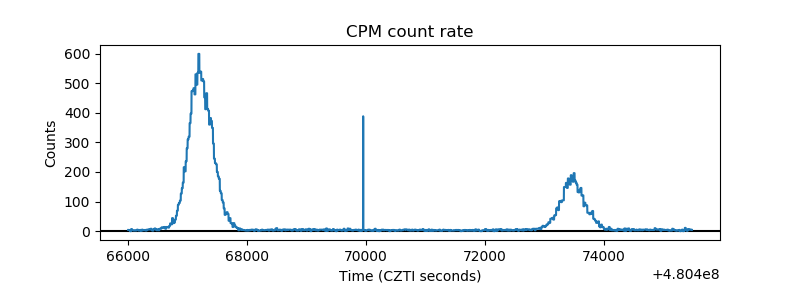 |
| CZT Counter | 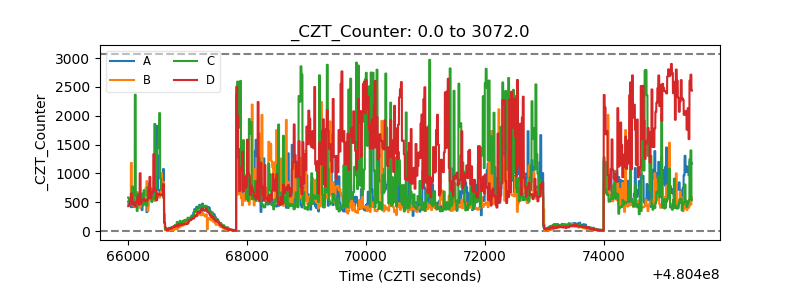 |
| +2.5 Volts monitor | 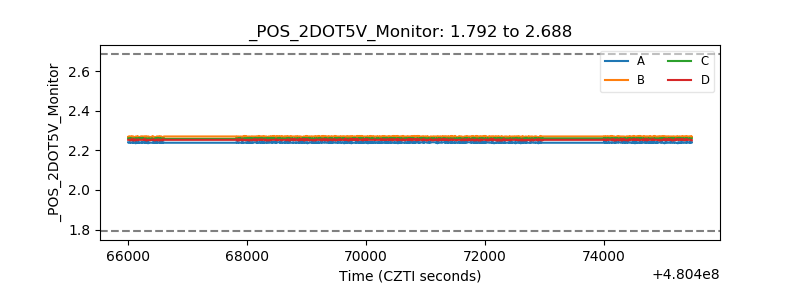 |
| +5 Volts monitor |  |
| _ROLL_ROT | 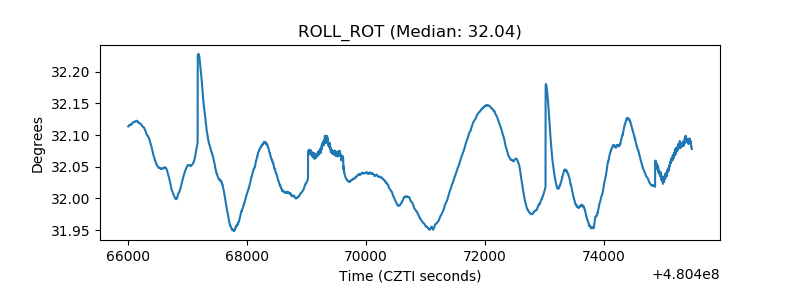 |
| _Roll_DEC | 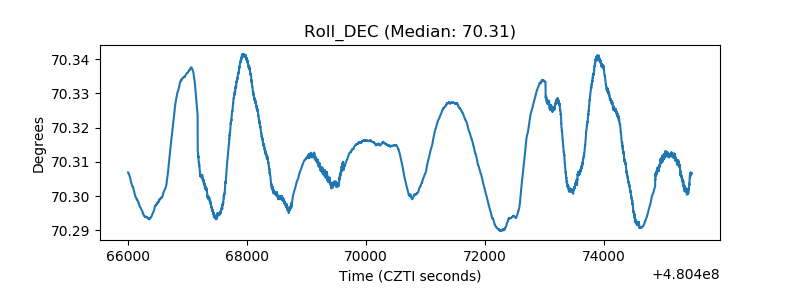 |
| _Roll_RA | 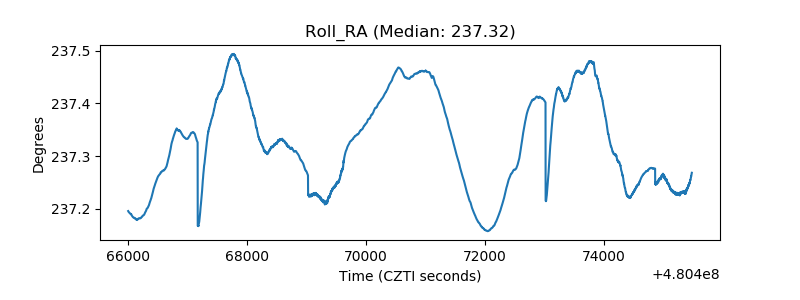 |
| Veto Counter | 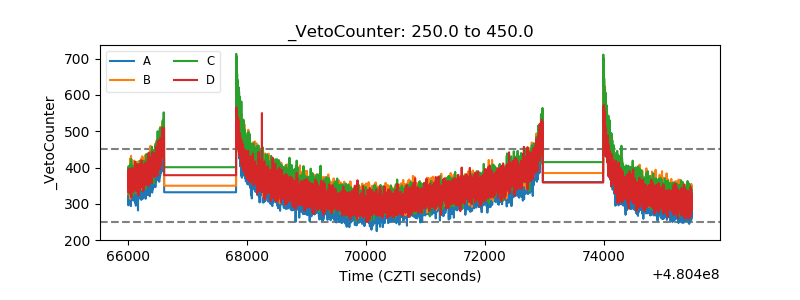 |