| Param | Original file | Final file |
|---|---|---|
| Filename | modeM0/AS1C07_001T03_9000006456_51309cztM0_level2.fits | modeM0/AS1C07_001T03_9000006456_51309cztM0_level2_quad_clean.evt |
| Size (bytes) | 766,071,360 | 98,435,520 |
| Size | 730.6 MB | 93.9 MB |
| Events in quadrant A | 7,696,729 | 645,251 |
| Events in quadrant B | 4,765,298 | 710,814 |
| Events in quadrant C | 6,510,998 | 594,830 |
| Events in quadrant D | 8,823,622 | 523,848 |
| Mode SS | |||
|---|---|---|---|
| Quadrant | BADHDUFLAG | Total packets | Discarded packets |
| A | 0 | 150 | 0 |
| B | 0 | 150 | 0 |
| C | 0 | 150 | 0 |
| D | 0 | 150 | 0 |
| Mode M0 | |||
|---|---|---|---|
| Quadrant | BADHDUFLAG | Total packets | Discarded packets |
| A | 0 | 28078 | 44 |
| B | 0 | 19210 | 28 |
| C | 0 | 24450 | 40 |
| D | 0 | 31434 | 30 |
| Mode M9 | |||
|---|---|---|---|
| Quadrant | BADHDUFLAG | Total packets | Discarded packets |
| A | 0 | 16 | 0 |
| B | 0 | 16 | 0 |
| C | 0 | 16 | 0 |
| D | 0 | 16 | 0 |
| Quadrant | Total seconds | Saturated seconds | Saturation percentage |
|---|---|---|---|
| A | 7259 | 511 | 7.039537% |
| B | 7260 | 401 | 5.523416% |
| C | 7260 | 1014 | 13.966942% |
| D | 7260 | 1422 | 19.586777% |
Noise dominated data is calculated using 1-second bins in cleaned event files. If a bin has >2000 counts, and if more than 50% of those come from <1% of pixels, then it is considered to be noise-dominated and hence unusable.
| Quadrant | # 1 sec bins | Bins with >0 counts | Bins with >2000 counts | High rate bins dominated by noise | Noise dominated (total time) | Noise dominated (detector-on time) | Marked lightcurve |
|---|---|---|---|---|---|---|---|
| A | 8914 | 7261 | 329 | 329 | 3.69% | 4.53% | 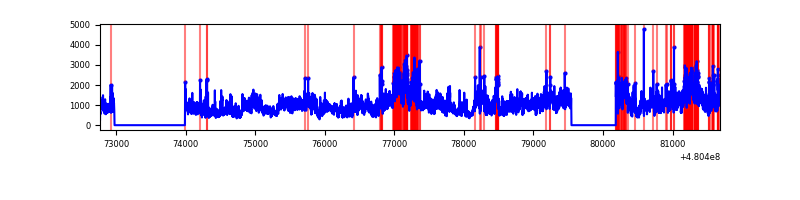 |
| B | 8915 | 7262 | 215 | 215 | 2.41% | 2.96% | 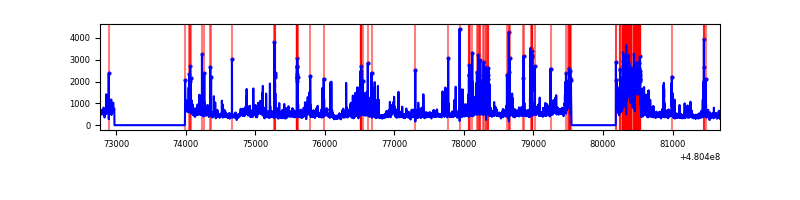 |
| C | 8915 | 7262 | 806 | 806 | 9.04% | 11.10% | 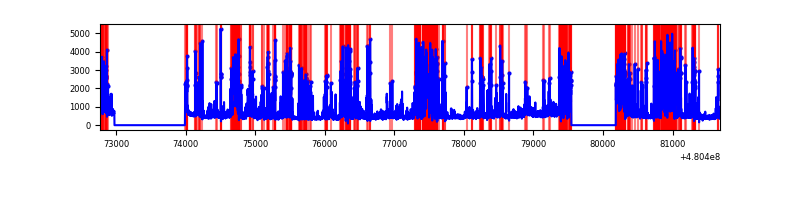 |
| D | 8915 | 7262 | 1520 | 1520 | 17.05% | 20.93% | 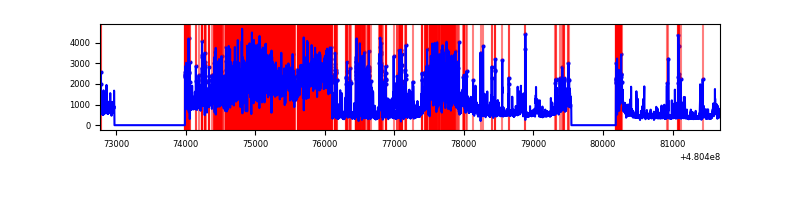 |
Top three noisy pixels from each quadrant. If the there are fewer than three noisy pixels in the level2.evt file, extra rows are filled as -1
| Pixel properties | Quadrant properties | ||||||
|---|---|---|---|---|---|---|---|
| Quadrant | DetID | PixID | Counts | Sigma | Mean | Median | Sigma |
| A | 12 | 3 | 2808520 | 15156.11 | 747 | 727 | 185.3 |
| A | 12 | 250 | 927297 | 5001.51 | 747 | 727 | 185.3 |
| A | 12 | 194 | 329030 | 1772.14 | 747 | 727 | 185.3 |
| B | 5 | 172 | 595776 | 3724.43 | 752 | 726 | 159.8 |
| B | 10 | 254 | 271895 | 1697.25 | 752 | 726 | 159.8 |
| B | 5 | 185 | 216177 | 1348.51 | 752 | 726 | 159.8 |
| C | 4 | 12 | 2746446 | 14132.67 | 703 | 698 | 194.3 |
| C | 10 | 252 | 237214 | 1217.37 | 703 | 698 | 194.3 |
| C | 13 | 3 | 138593 | 709.76 | 703 | 698 | 194.3 |
| D | 8 | 176 | 2934442 | 15206.6 | 691 | 664 | 192.9 |
| D | 12 | 2 | 1019839 | 5282.67 | 691 | 664 | 192.9 |
| D | 6 | 42 | 495375 | 2564.23 | 691 | 664 | 192.9 |
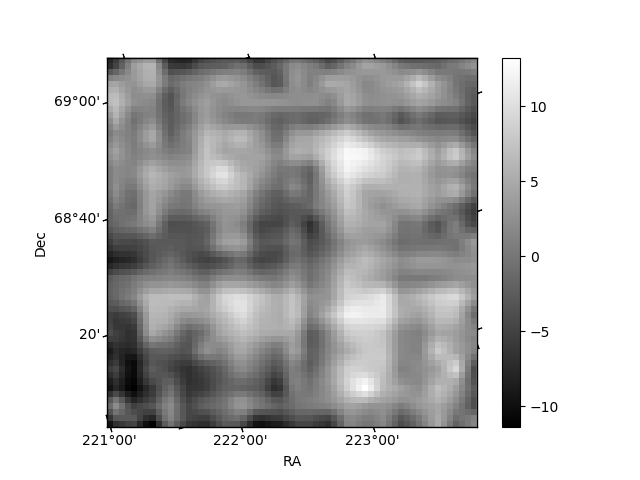
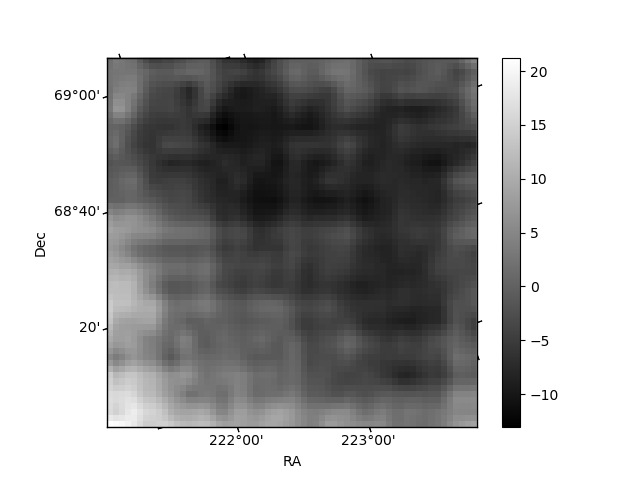
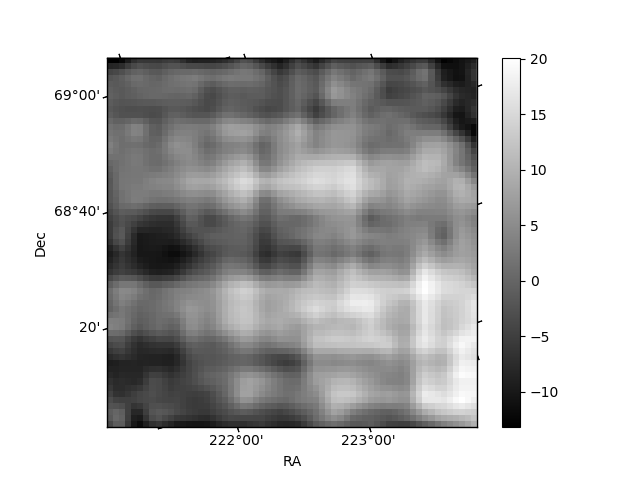
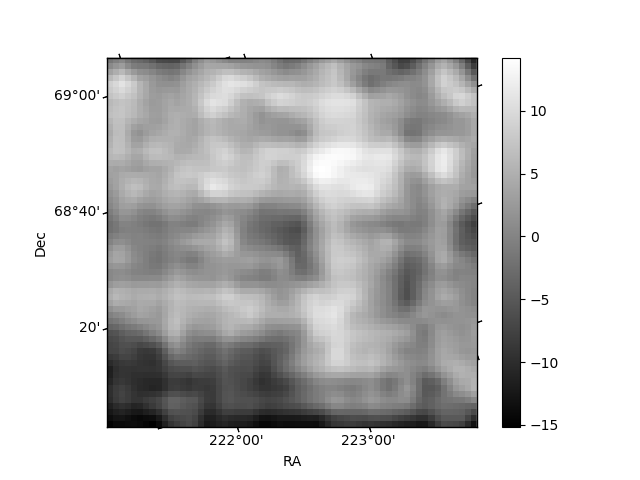
Histogram calculated using DETX and DETY for each event in the final _common_clean file
| Quadrant A | 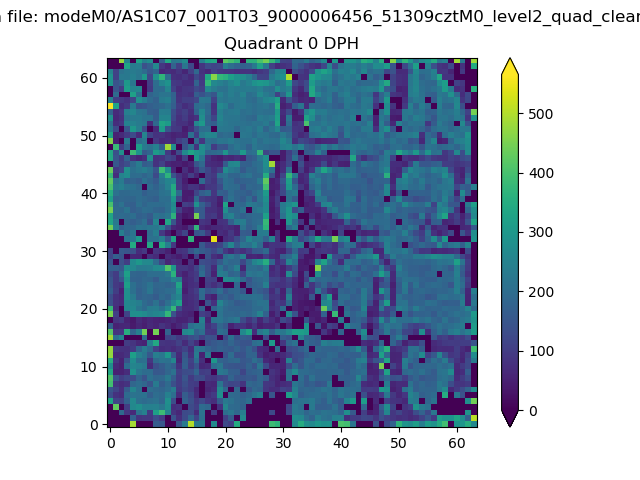 |
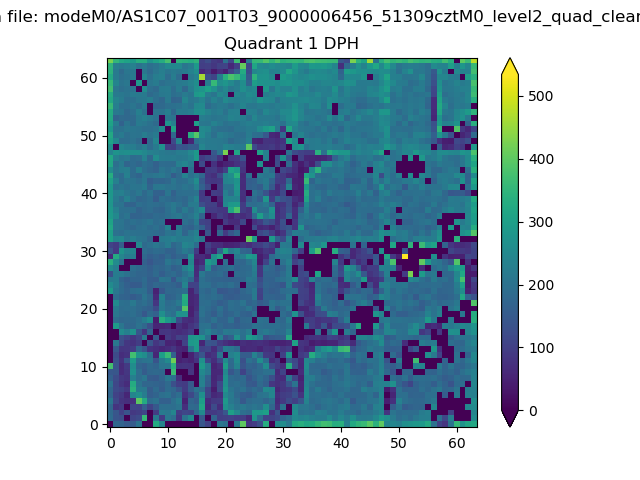 |
Quadrant B |
|---|---|---|---|
| Quadrant D | 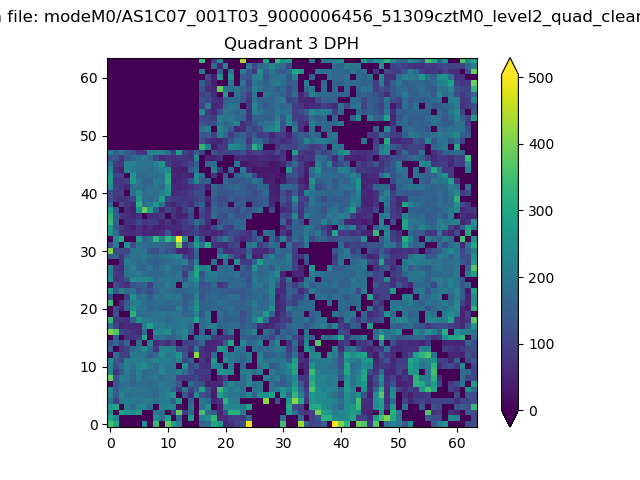 |
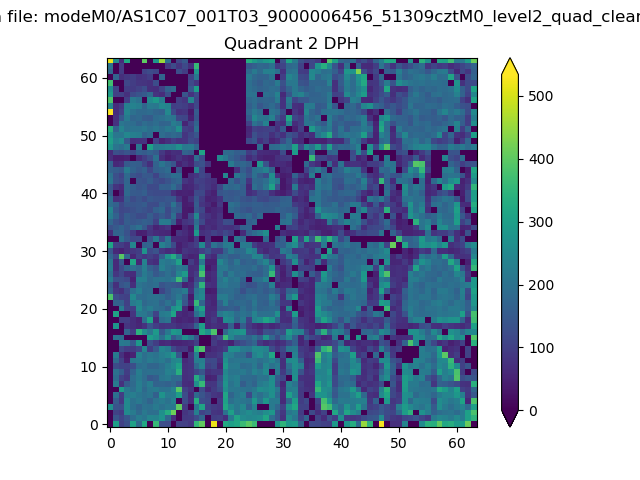 |
Quadrant C |
| Plot type | Count rate plots | Images |
|---|---|---|
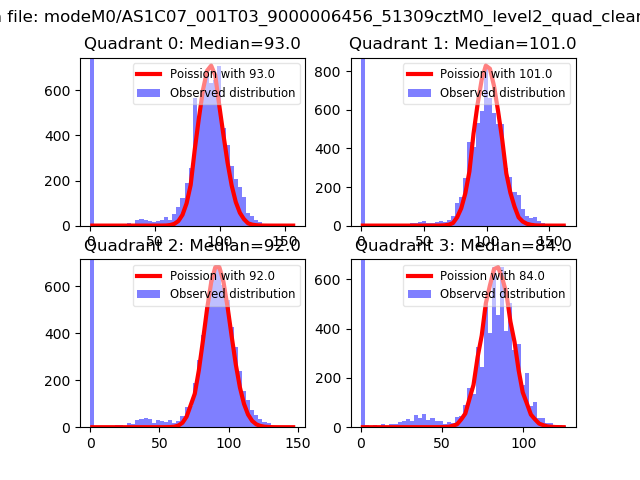
| Comparison with Poisson distribution Blue bars denote a histogram of data divided into 1 sec bins. Red curve is a Poisson curve with rate = median count rate of data. |
 |
 |
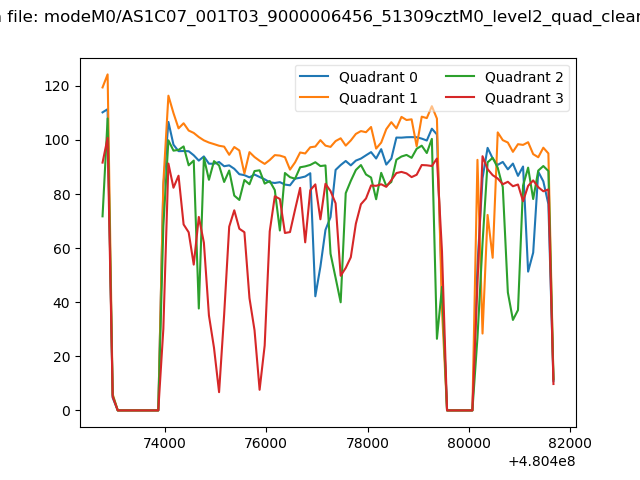
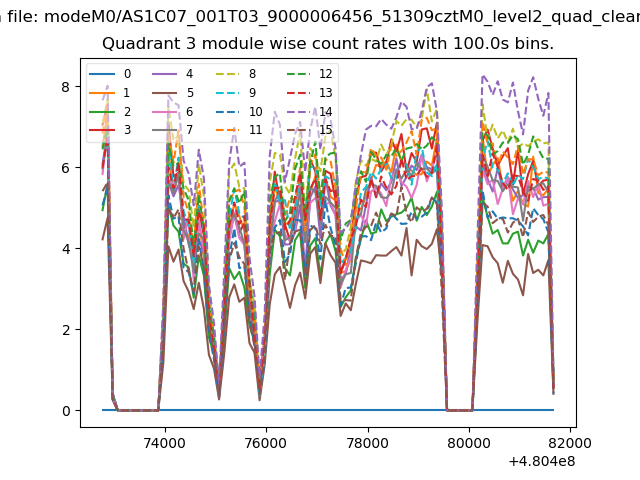
| Quadrant-wise count rates Data is divided into 100 sec bins |
 |
|
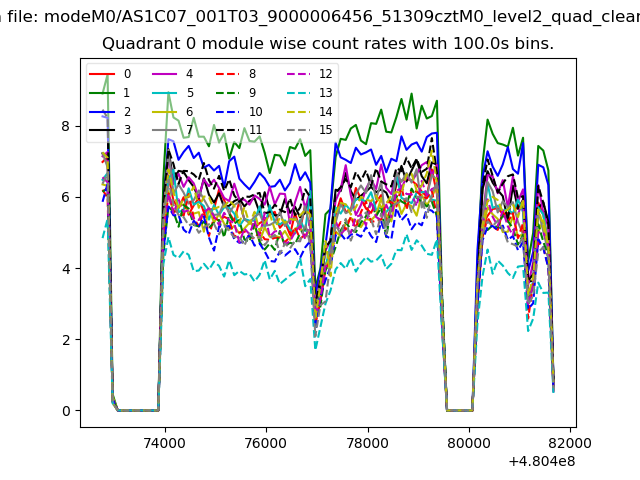
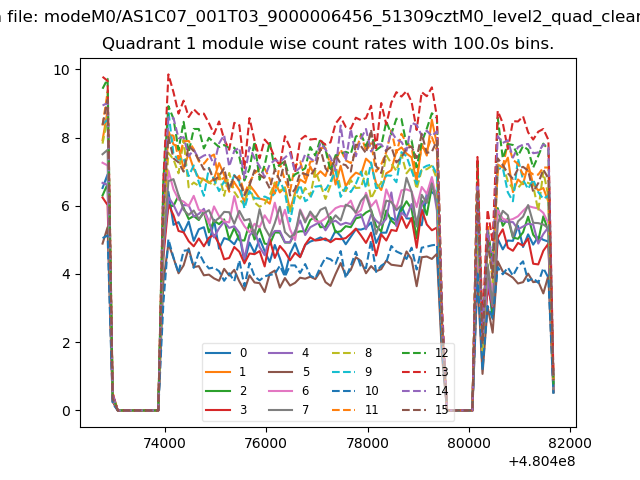
| Module-wise count rates for Quadrant A Data is divided into 100 sec bins |
 |
 |
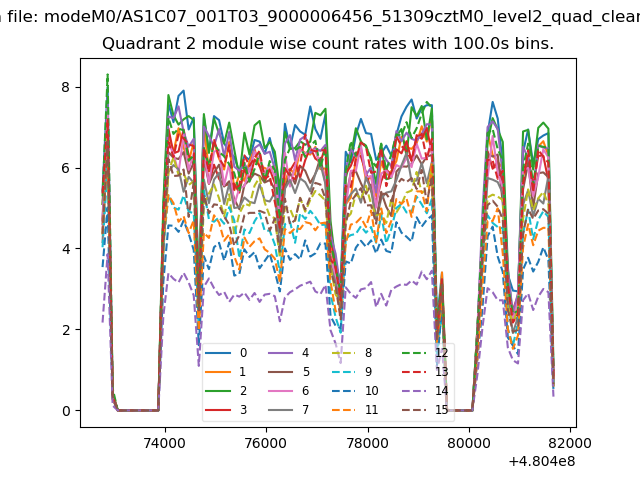
| Module-wise count rates for Quadrant B Data is divided into 100 sec bins |
 |
 |
| Module-wise count rates for Quadrant C Data is divided into 100 sec bins |
 |
 |
| Module-wise count rates for Quadrant D Data is divided into 100 sec bins |
 |
 |
| Parameter | Plot |
|---|---|
| CZT HV Monitor |  |
| D_VDD | 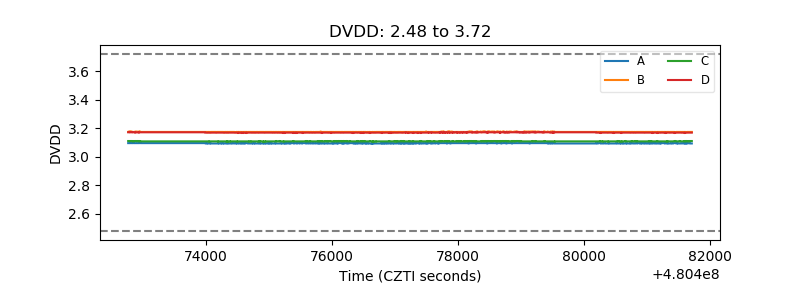 |
| Temperature 1 | 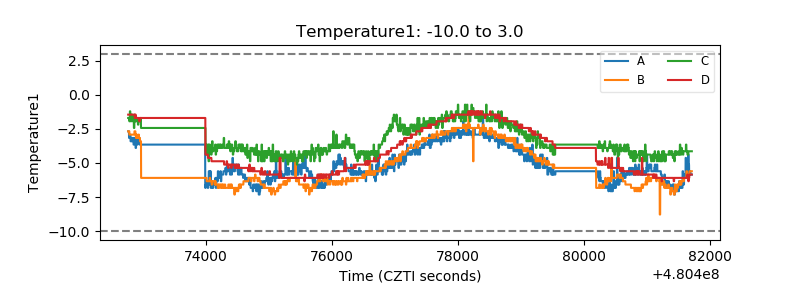 |
| Veto HV Monitor | 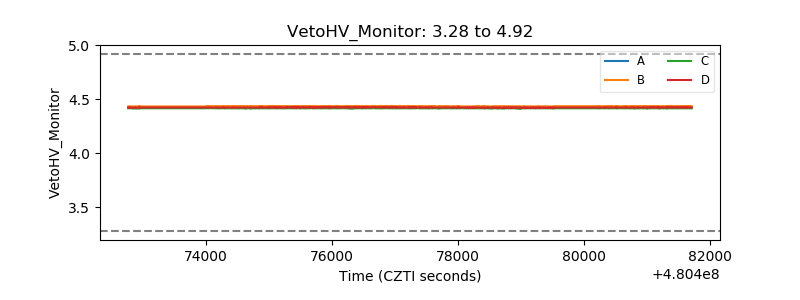 |
| Veto LLD | 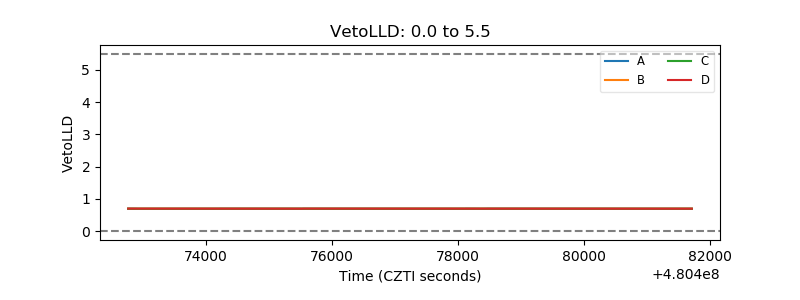 |
| Alpha Counter | 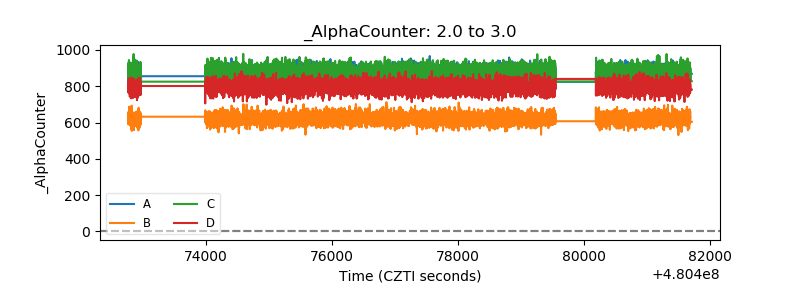 |
| _CPM_Rate | 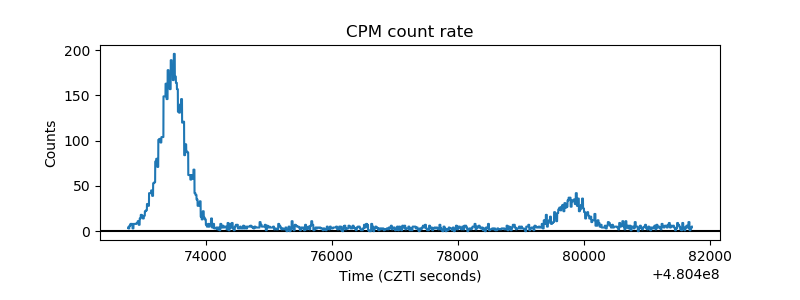 |
| CZT Counter | 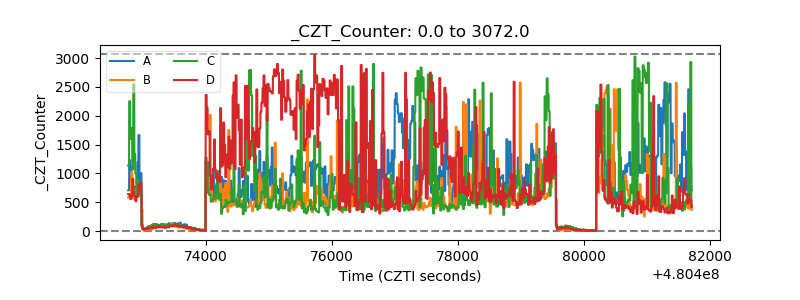 |
| +2.5 Volts monitor | 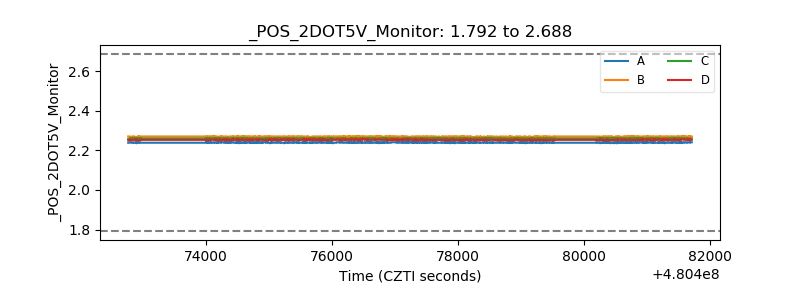 |
| +5 Volts monitor | 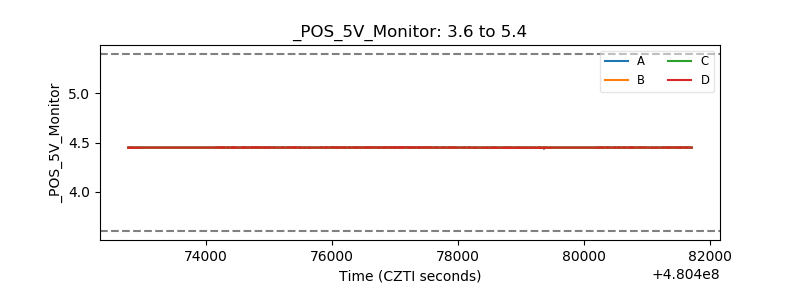 |
| _ROLL_ROT | 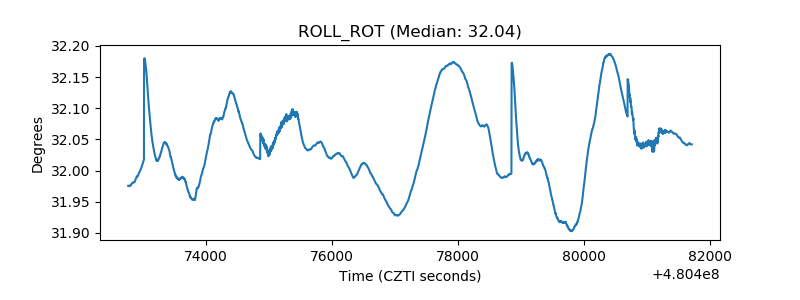 |
| _Roll_DEC | 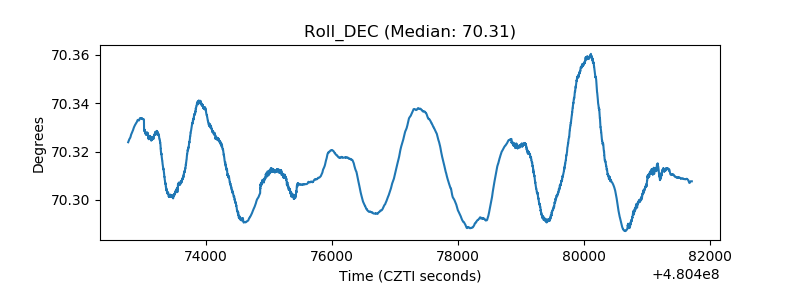 |
| _Roll_RA | 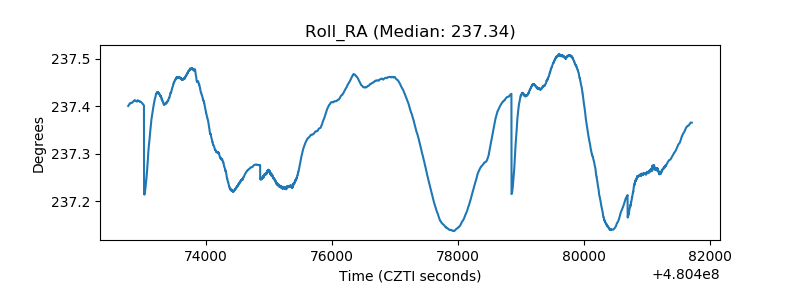 |
| Veto Counter | 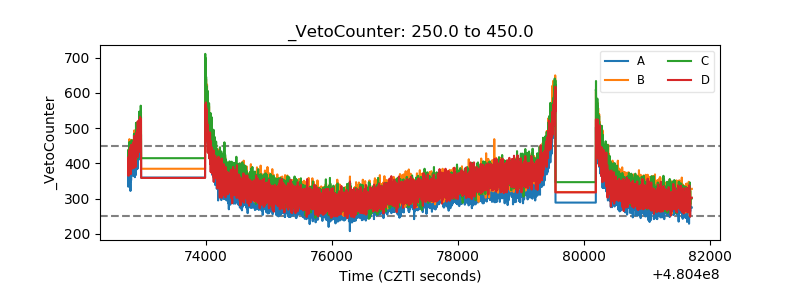 |