| Param | Original file | Final file |
|---|---|---|
| Filename | modeM0/AS1C07_001T03_9000006456_51310cztM0_level2.fits | modeM0/AS1C07_001T03_9000006456_51310cztM0_level2_quad_clean.evt |
| Size (bytes) | 825,739,200 | 92,733,120 |
| Size | 787.5 MB | 88.4 MB |
| Events in quadrant A | 8,491,615 | 614,182 |
| Events in quadrant B | 4,191,602 | 714,373 |
| Events in quadrant C | 8,343,029 | 534,623 |
| Events in quadrant D | 8,982,339 | 441,876 |
| Mode SS | |||
|---|---|---|---|
| Quadrant | BADHDUFLAG | Total packets | Discarded packets |
| A | 0 | 144 | 0 |
| B | 0 | 144 | 0 |
| C | 0 | 144 | 0 |
| D | 0 | 144 | 0 |
| Mode M0 | |||
|---|---|---|---|
| Quadrant | BADHDUFLAG | Total packets | Discarded packets |
| A | 0 | 30363 | 1 |
| B | 0 | 17557 | 1 |
| C | 0 | 29749 | 1 |
| D | 0 | 32002 | 1 |
| Quadrant | Total seconds | Saturated seconds | Saturation percentage |
|---|---|---|---|
| A | 7217 | 712 | 9.865595% |
| B | 7217 | 194 | 2.688098% |
| C | 7217 | 1598 | 22.142164% |
| D | 7217 | 2068 | 28.654566% |
Noise dominated data is calculated using 1-second bins in cleaned event files. If a bin has >2000 counts, and if more than 50% of those come from <1% of pixels, then it is considered to be noise-dominated and hence unusable.
| Quadrant | # 1 sec bins | Bins with >0 counts | Bins with >2000 counts | High rate bins dominated by noise | Noise dominated (total time) | Noise dominated (detector-on time) | Marked lightcurve |
|---|---|---|---|---|---|---|---|
| A | 7232 | 7218 | 558 | 558 | 7.72% | 7.73% | 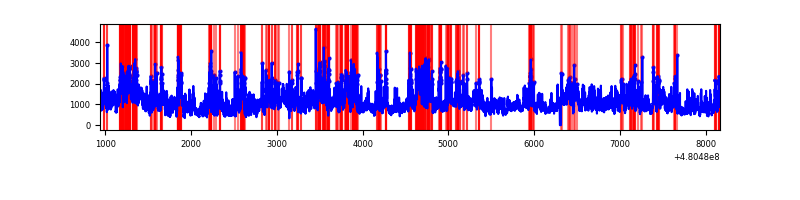 |
| B | 7232 | 7218 | 115 | 115 | 1.59% | 1.59% | 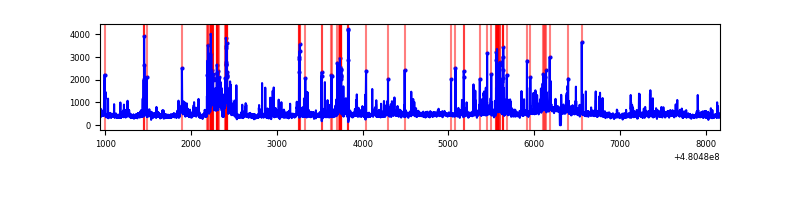 |
| C | 7232 | 7218 | 1385 | 1385 | 19.15% | 19.19% | 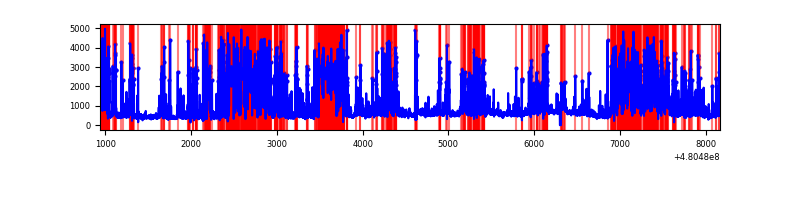 |
| D | 7232 | 7218 | 1816 | 1816 | 25.11% | 25.16% | 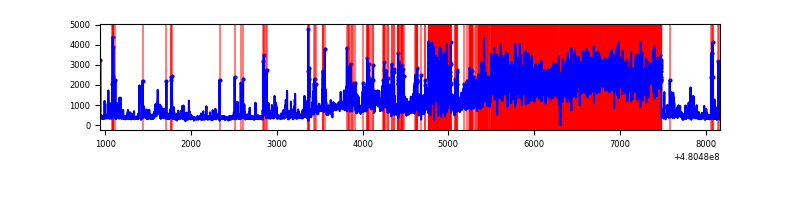 |
Top three noisy pixels from each quadrant. If the there are fewer than three noisy pixels in the level2.evt file, extra rows are filled as -1
| Pixel properties | Quadrant properties | ||||||
|---|---|---|---|---|---|---|---|
| Quadrant | DetID | PixID | Counts | Sigma | Mean | Median | Sigma |
| A | 12 | 3 | 2961287 | 16661.77 | 723 | 706 | 177.7 |
| A | 12 | 250 | 1540994 | 8668.54 | 723 | 706 | 177.7 |
| A | 12 | 194 | 339846 | 1908.64 | 723 | 706 | 177.7 |
| B | 7 | 252 | 360008 | 2282.98 | 741 | 715 | 157.4 |
| B | 5 | 185 | 255891 | 1621.41 | 741 | 715 | 157.4 |
| B | 10 | 254 | 133157 | 841.55 | 741 | 715 | 157.4 |
| C | 4 | 12 | 4004253 | 21979.88 | 655 | 650 | 182.1 |
| C | 14 | 242 | 575710 | 3157.09 | 655 | 650 | 182.1 |
| C | 3 | 233 | 351110 | 1924.03 | 655 | 650 | 182.1 |
| D | 8 | 176 | 4710085 | 26351.13 | 639 | 613 | 178.7 |
| D | 12 | 2 | 489997 | 2738.27 | 639 | 613 | 178.7 |
| D | 10 | 181 | 416772 | 2328.55 | 639 | 613 | 178.7 |
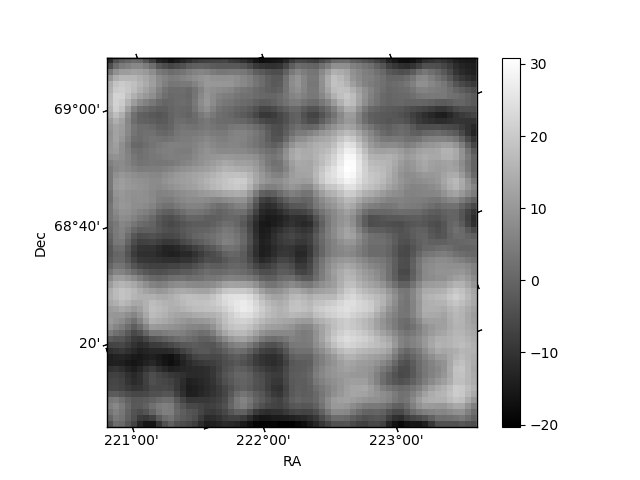
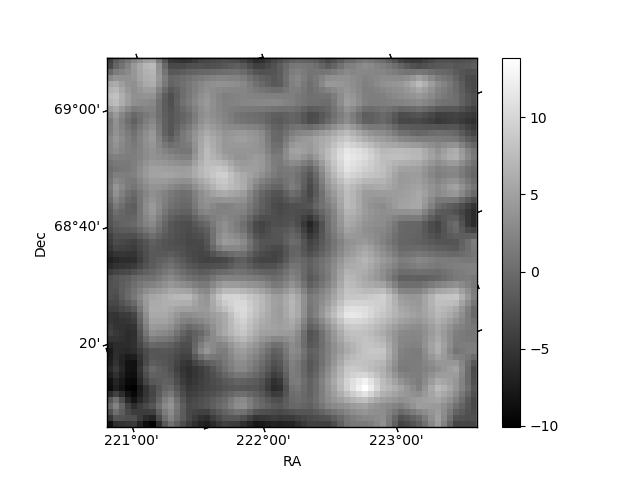
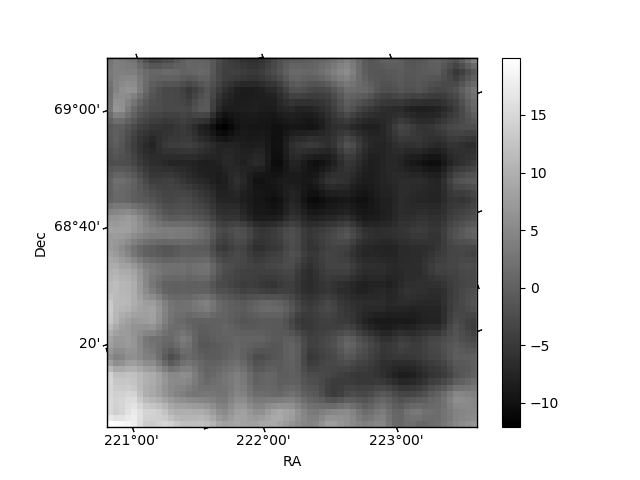
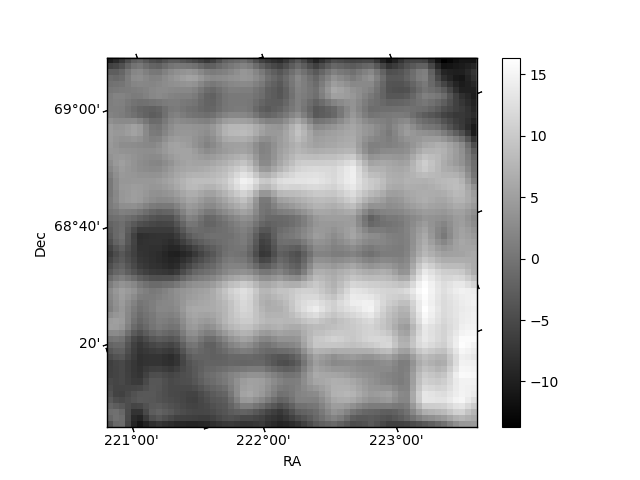
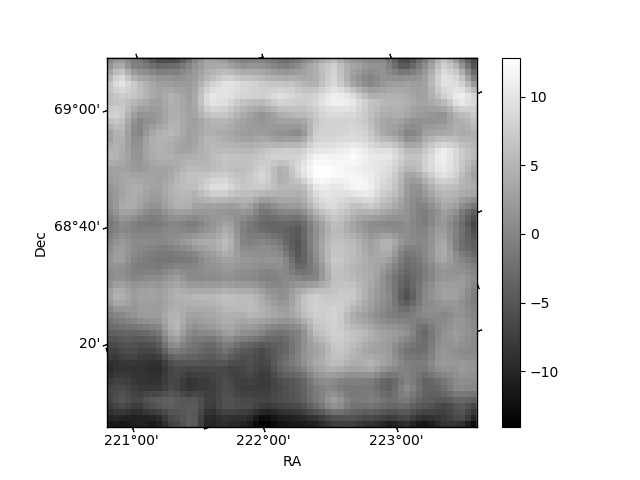
Histogram calculated using DETX and DETY for each event in the final _common_clean file
| Quadrant A | 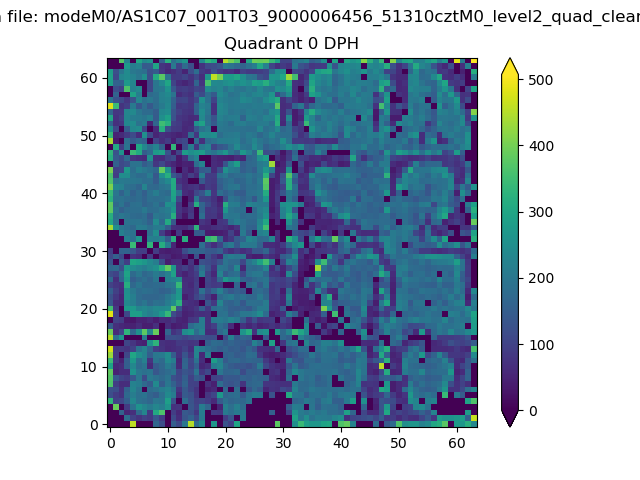 |
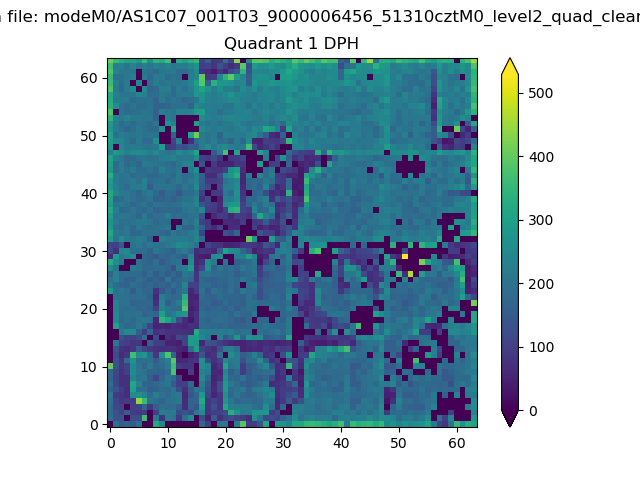 |
Quadrant B |
|---|---|---|---|
| Quadrant D | 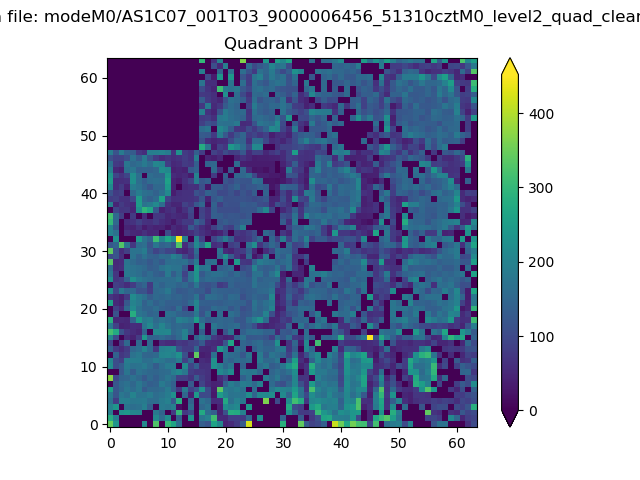 |
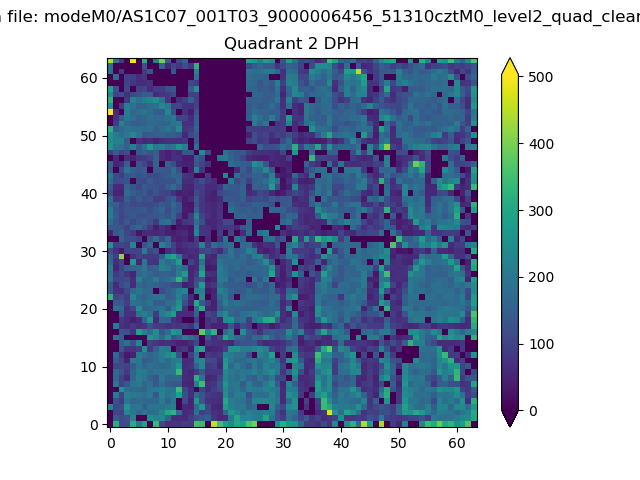 |
Quadrant C |
| Plot type | Count rate plots | Images |
|---|---|---|
| Comparison with Poisson distribution Blue bars denote a histogram of data divided into 1 sec bins. Red curve is a Poisson curve with rate = median count rate of data. |
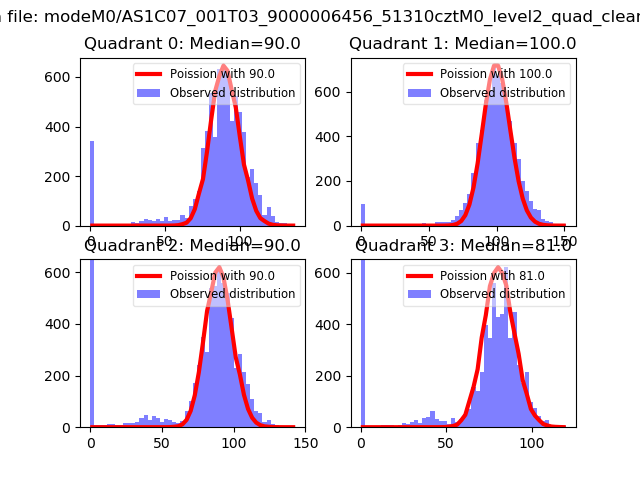 |
 |
| Quadrant-wise count rates Data is divided into 100 sec bins |
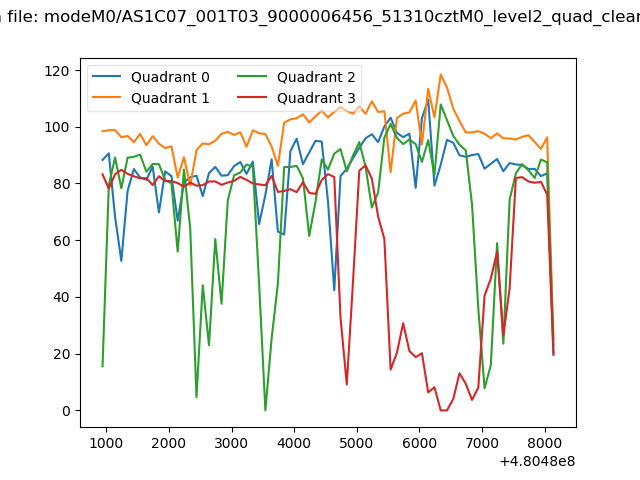 |
|
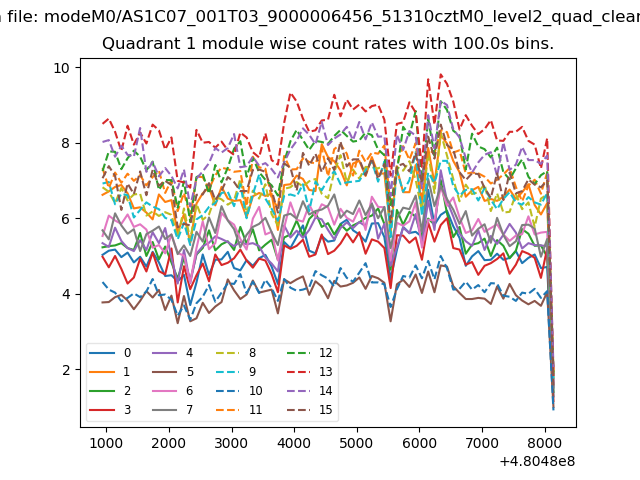
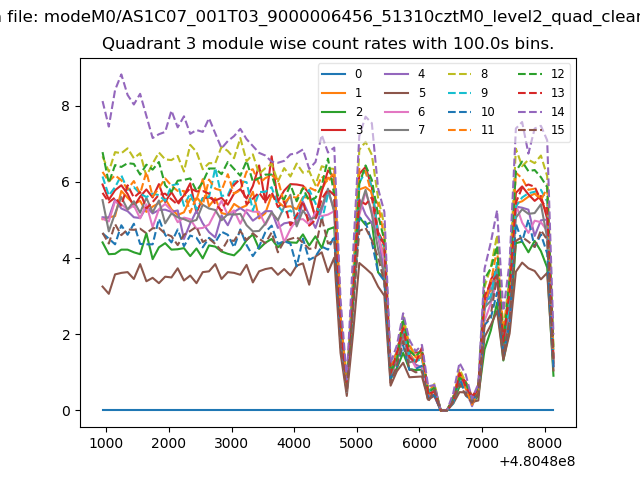
| Module-wise count rates for Quadrant A Data is divided into 100 sec bins |
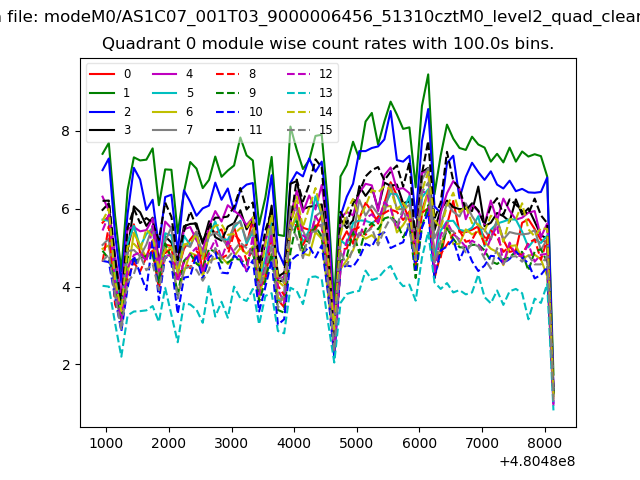 |
 |
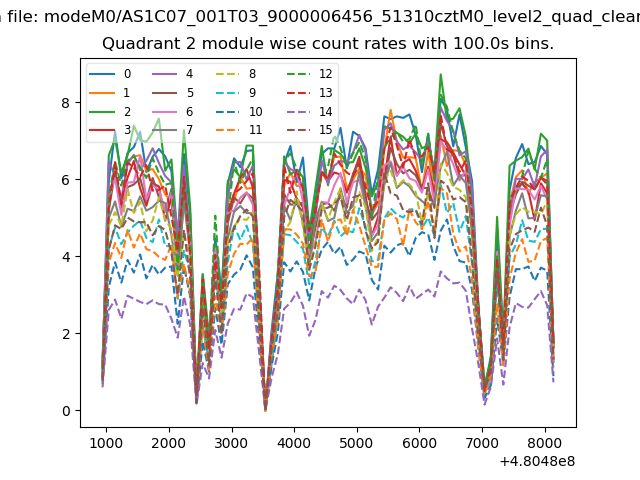
| Module-wise count rates for Quadrant B Data is divided into 100 sec bins |
 |
 |
| Module-wise count rates for Quadrant C Data is divided into 100 sec bins |
 |
 |
| Module-wise count rates for Quadrant D Data is divided into 100 sec bins |
 |
 |
| Parameter | Plot |
|---|---|
| CZT HV Monitor | 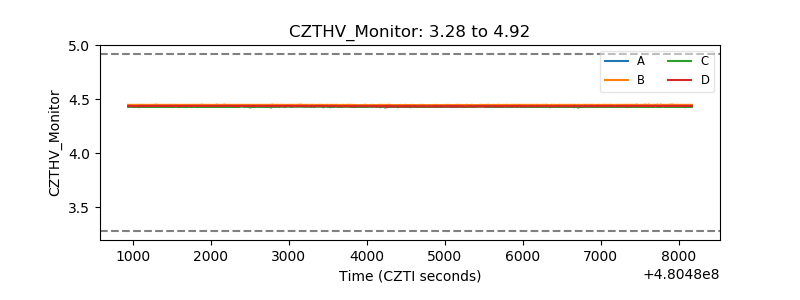 |
| D_VDD | 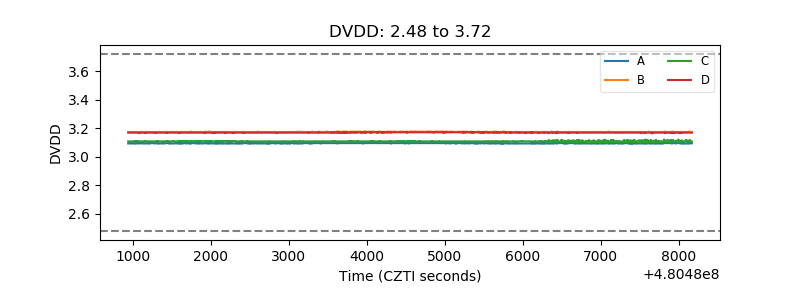 |
| Temperature 1 | 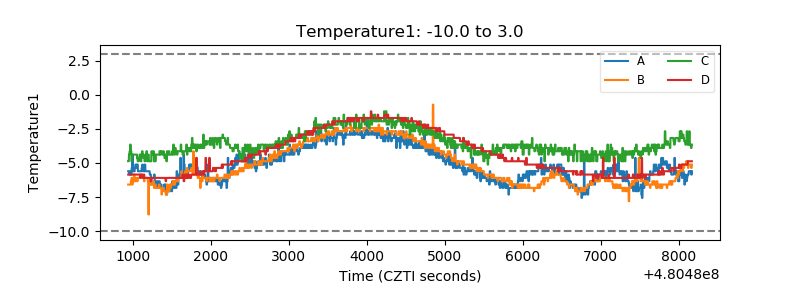 |
| Veto HV Monitor | 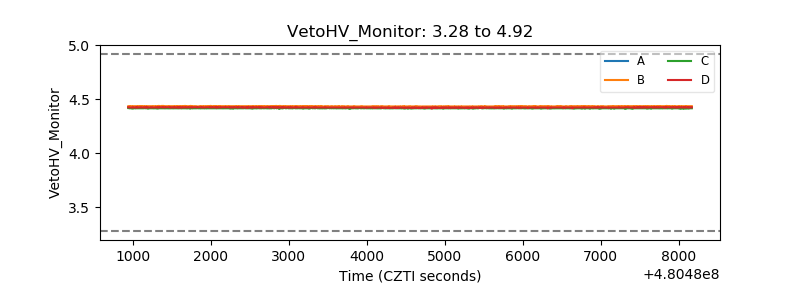 |
| Veto LLD | 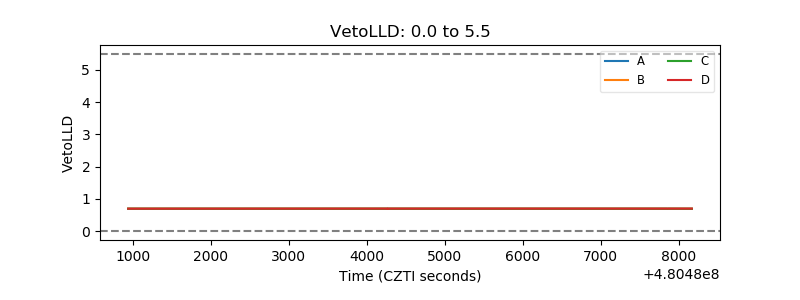 |
| Alpha Counter | 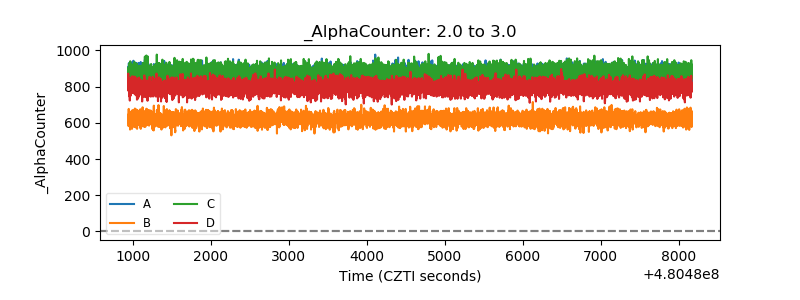 |
| _CPM_Rate | 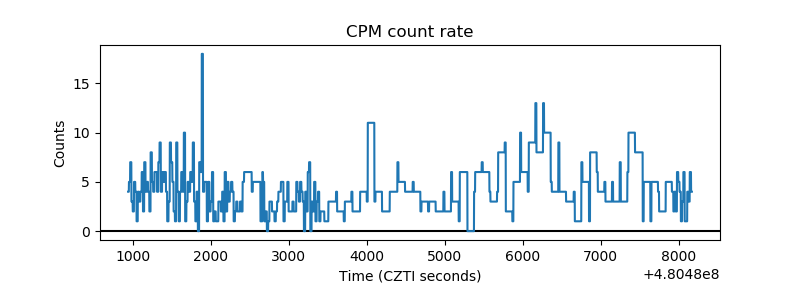 |
| CZT Counter | 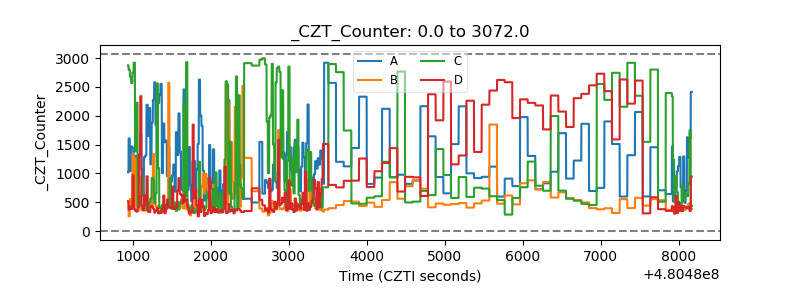 |
| +2.5 Volts monitor | 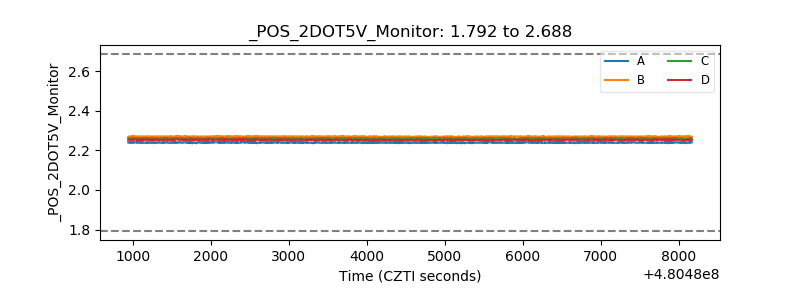 |
| +5 Volts monitor | 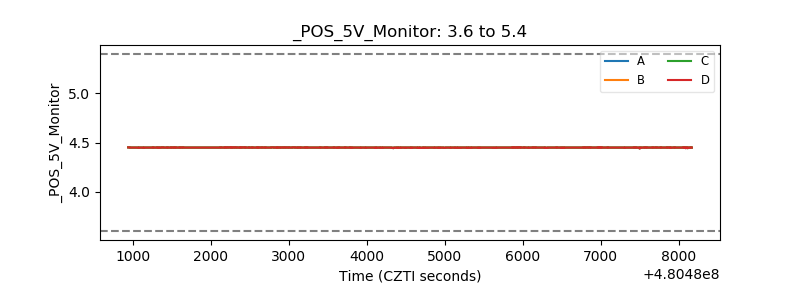 |
| _ROLL_ROT | 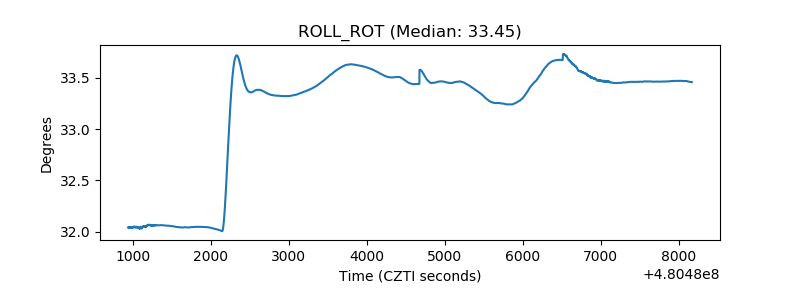 |
| _Roll_DEC | 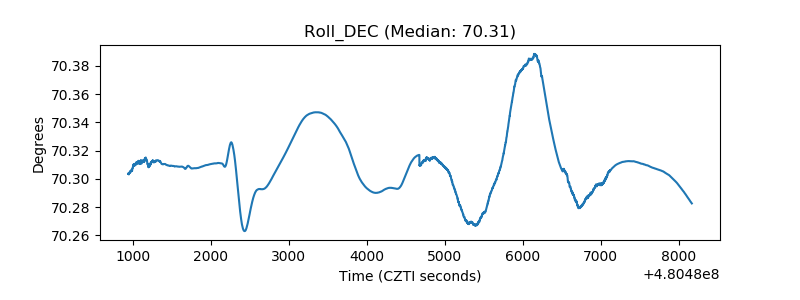 |
| _Roll_RA | 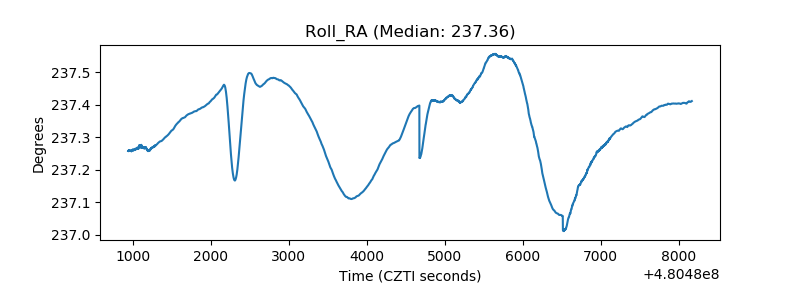 |
| Veto Counter | 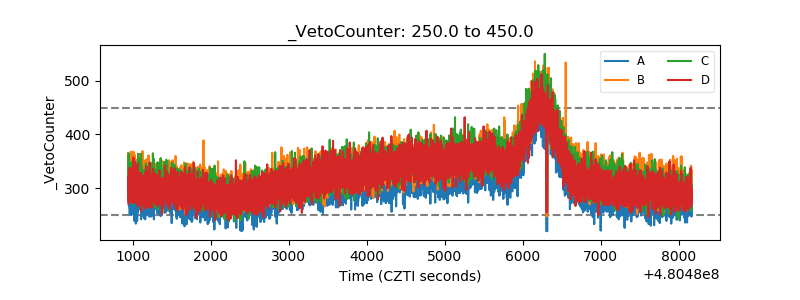 |