| Param | Original file | Final file |
|---|---|---|
| Filename | modeM0/AS1C07_001T03_9000006456_51311cztM0_level2.fits | modeM0/AS1C07_001T03_9000006456_51311cztM0_level2_quad_clean.evt |
| Size (bytes) | 957,697,920 | 94,032,000 |
| Size | 913.3 MB | 89.7 MB |
| Events in quadrant A | 7,020,752 | 681,975 |
| Events in quadrant B | 4,642,288 | 739,993 |
| Events in quadrant C | 14,415,838 | 332,257 |
| Events in quadrant D | 8,786,017 | 564,014 |
| Mode SS | |||
|---|---|---|---|
| Quadrant | BADHDUFLAG | Total packets | Discarded packets |
| A | 0 | 152 | 0 |
| B | 0 | 152 | 0 |
| C | 0 | 152 | 0 |
| D | 0 | 152 | 0 |
| Mode M0 | |||
|---|---|---|---|
| Quadrant | BADHDUFLAG | Total packets | Discarded packets |
| A | 0 | 26306 | 0 |
| B | 0 | 19245 | 0 |
| C | 0 | 47946 | 0 |
| D | 0 | 31556 | 0 |
| Quadrant | Total seconds | Saturated seconds | Saturation percentage |
|---|---|---|---|
| A | 7596 | 130 | 1.711427% |
| B | 7597 | 265 | 3.488219% |
| C | 7597 | 4242 | 55.837831% |
| D | 7597 | 1132 | 14.900619% |
Noise dominated data is calculated using 1-second bins in cleaned event files. If a bin has >2000 counts, and if more than 50% of those come from <1% of pixels, then it is considered to be noise-dominated and hence unusable.
| Quadrant | # 1 sec bins | Bins with >0 counts | Bins with >2000 counts | High rate bins dominated by noise | Noise dominated (total time) | Noise dominated (detector-on time) | Marked lightcurve |
|---|---|---|---|---|---|---|---|
| A | 7596 | 7596 | 123 | 123 | 1.62% | 1.62% | 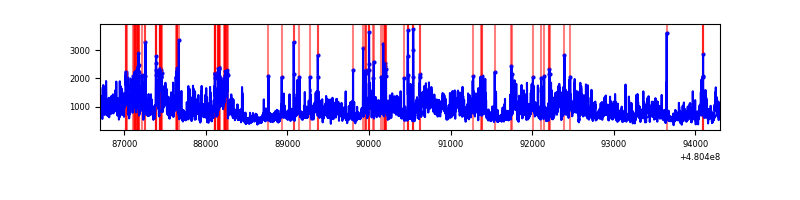 |
| B | 7597 | 7597 | 173 | 173 | 2.28% | 2.28% | 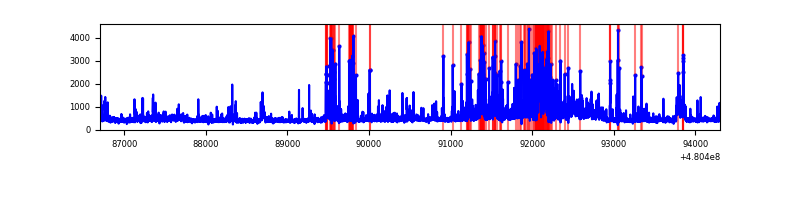 |
| C | 7597 | 7597 | 3899 | 3899 | 51.32% | 51.32% | 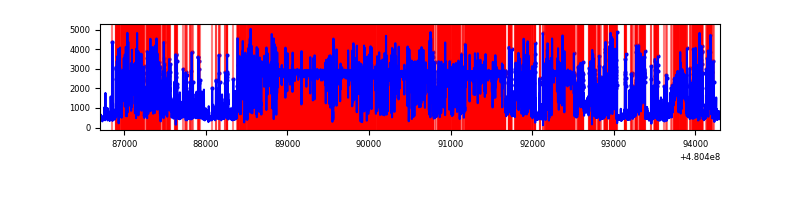 |
| D | 7597 | 7597 | 1220 | 1220 | 16.06% | 16.06% | 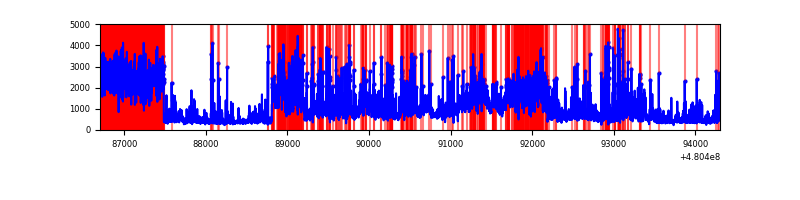 |
Top three noisy pixels from each quadrant. If the there are fewer than three noisy pixels in the level2.evt file, extra rows are filled as -1
| Pixel properties | Quadrant properties | ||||||
|---|---|---|---|---|---|---|---|
| Quadrant | DetID | PixID | Counts | Sigma | Mean | Median | Sigma |
| A | 12 | 3 | 3025021 | 16034.31 | 759 | 740 | 188.6 |
| A | 12 | 194 | 344450 | 1822.3 | 759 | 740 | 188.6 |
| A | 9 | 191 | 253187 | 1338.44 | 759 | 740 | 188.6 |
| B | 5 | 172 | 626334 | 3813.58 | 760 | 732 | 164.0 |
| B | 5 | 185 | 307250 | 1868.49 | 760 | 732 | 164.0 |
| B | 7 | 252 | 215348 | 1308.27 | 760 | 732 | 164.0 |
| C | 4 | 12 | 10651088 | 76971.39 | 493 | 489 | 138.4 |
| C | 14 | 242 | 461206 | 3329.58 | 493 | 489 | 138.4 |
| C | 15 | 206 | 281507 | 2030.9 | 493 | 489 | 138.4 |
| D | 8 | 176 | 3645198 | 18406.2 | 708 | 683 | 198.0 |
| D | 12 | 2 | 701728 | 3540.54 | 708 | 683 | 198.0 |
| D | 6 | 42 | 328697 | 1656.59 | 708 | 683 | 198.0 |
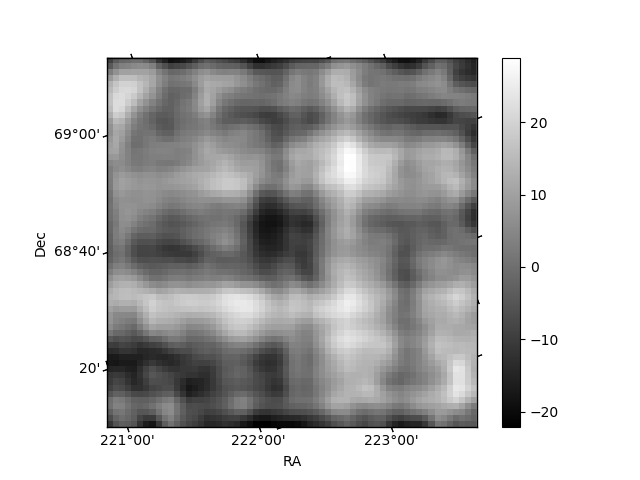
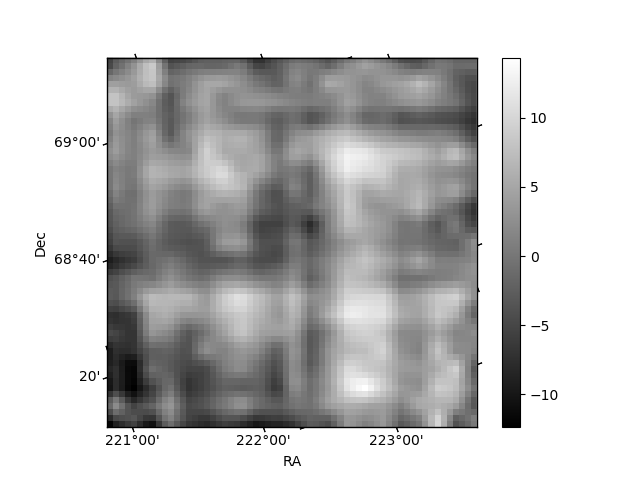
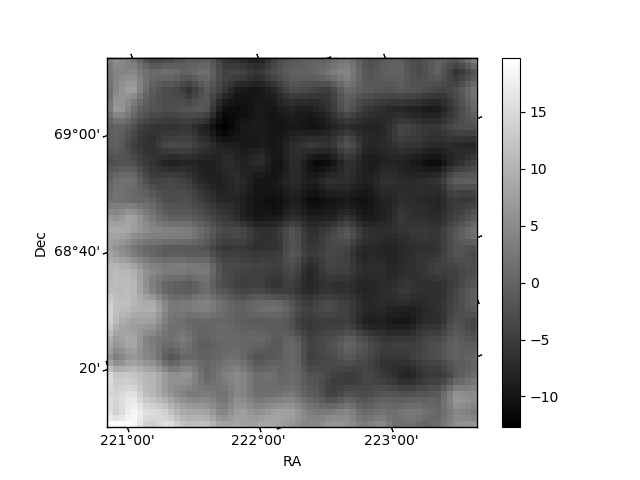
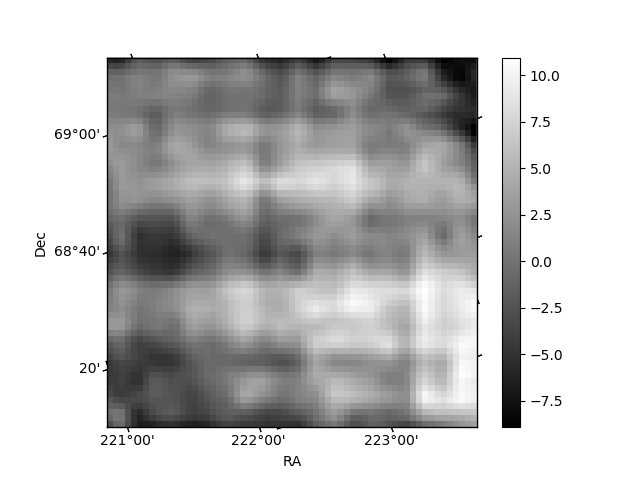
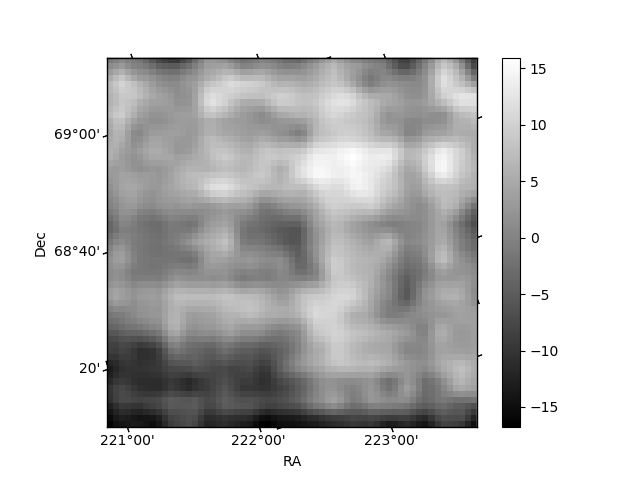
Histogram calculated using DETX and DETY for each event in the final _common_clean file
| Quadrant A | 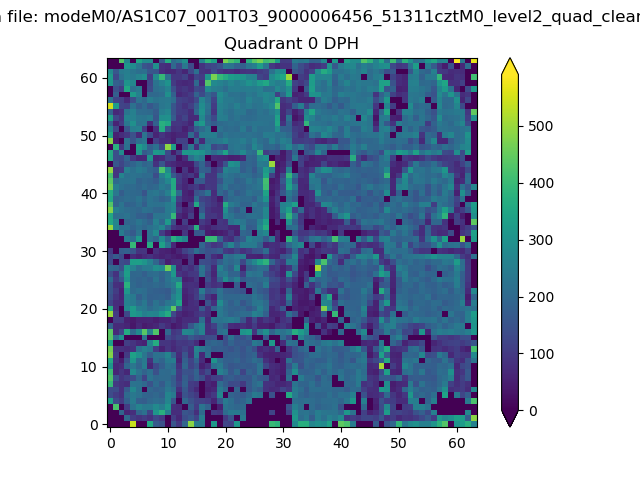 |
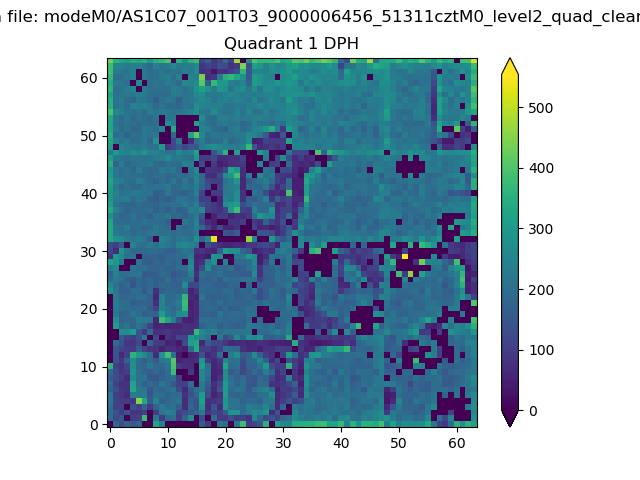 |
Quadrant B |
|---|---|---|---|
| Quadrant D | 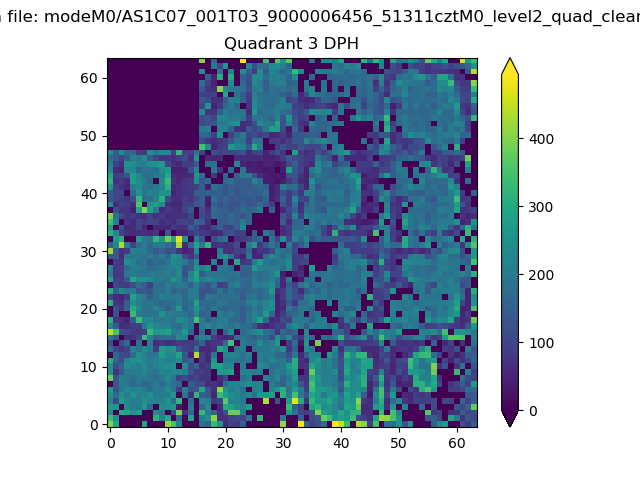 |
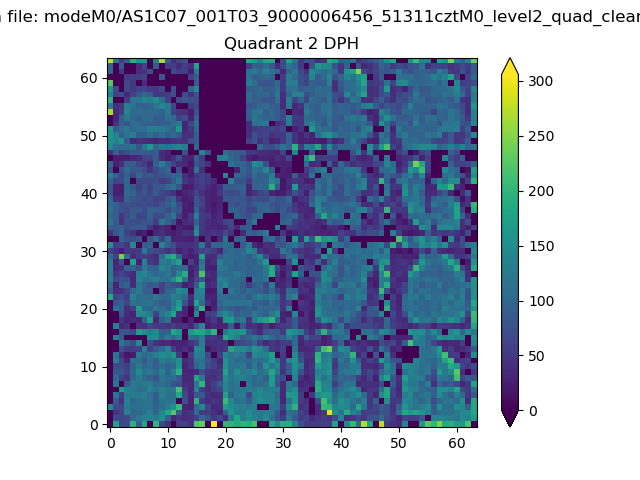 |
Quadrant C |
| Plot type | Count rate plots | Images |
|---|---|---|
| Comparison with Poisson distribution Blue bars denote a histogram of data divided into 1 sec bins. Red curve is a Poisson curve with rate = median count rate of data. |
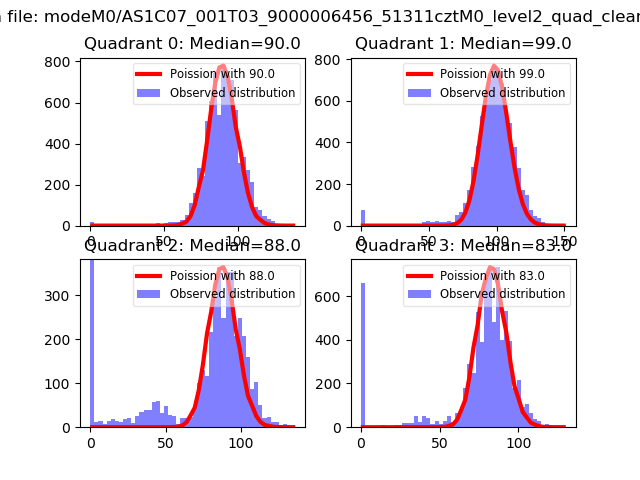 |
 |
| Quadrant-wise count rates Data is divided into 100 sec bins |
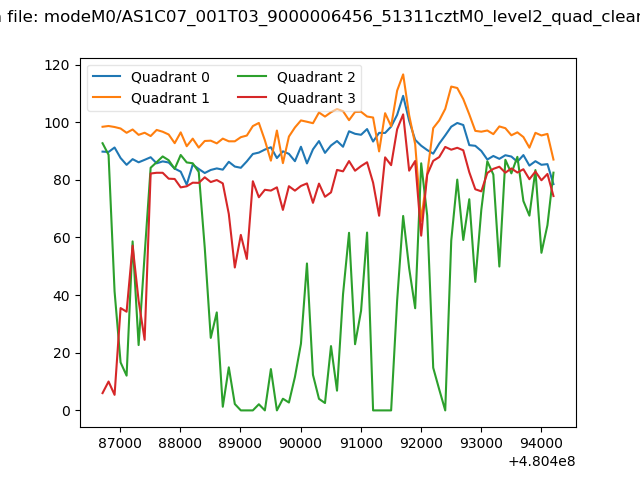 |
|
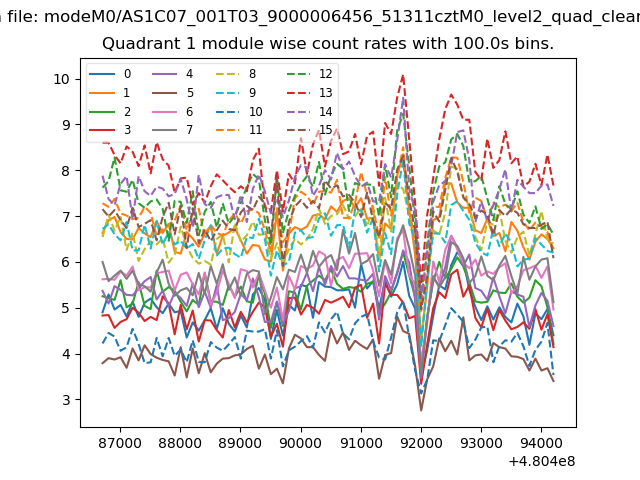
| Module-wise count rates for Quadrant A Data is divided into 100 sec bins |
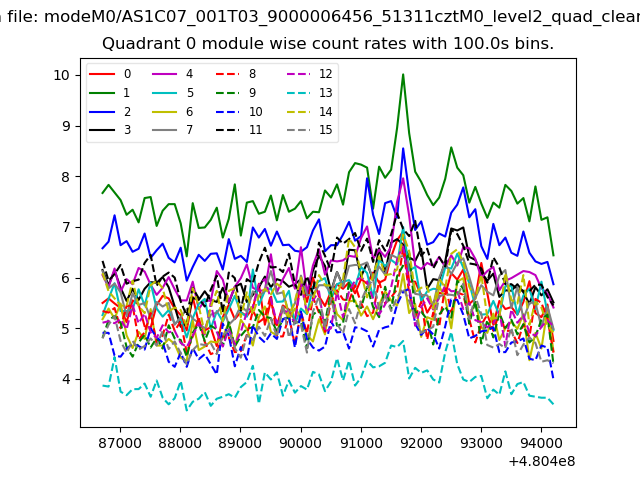 |
 |
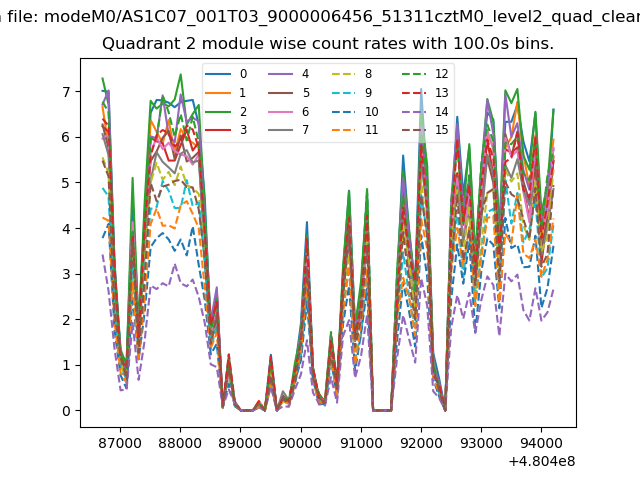
| Module-wise count rates for Quadrant B Data is divided into 100 sec bins |
 |
 |
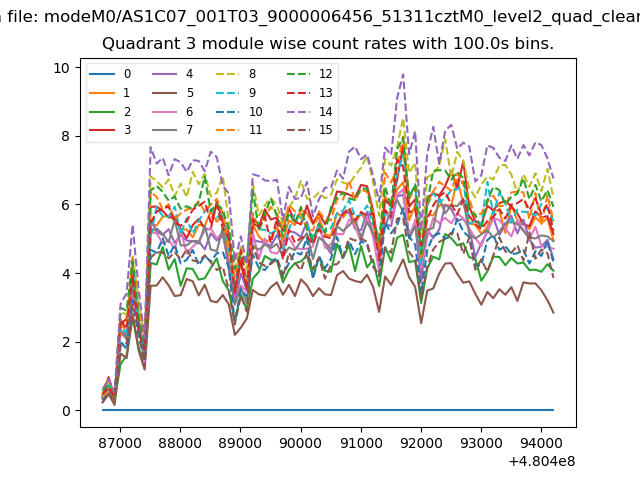
| Module-wise count rates for Quadrant C Data is divided into 100 sec bins |
 |
 |
| Module-wise count rates for Quadrant D Data is divided into 100 sec bins |
 |
 |
| Parameter | Plot |
|---|---|
| CZT HV Monitor |  |
| D_VDD | 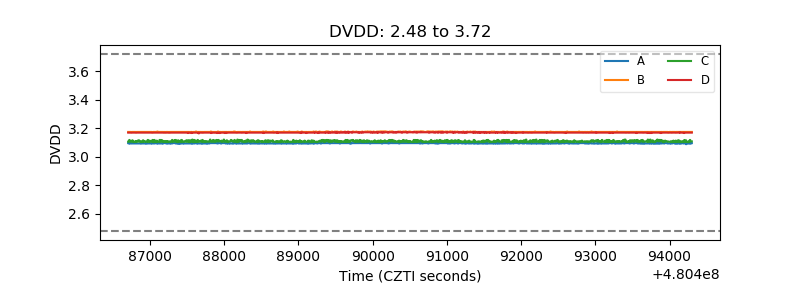 |
| Temperature 1 | 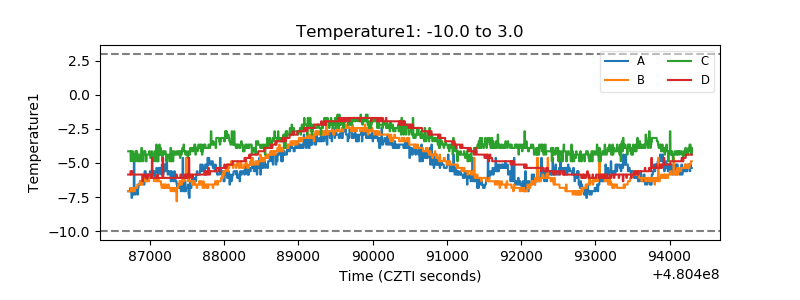 |
| Veto HV Monitor | 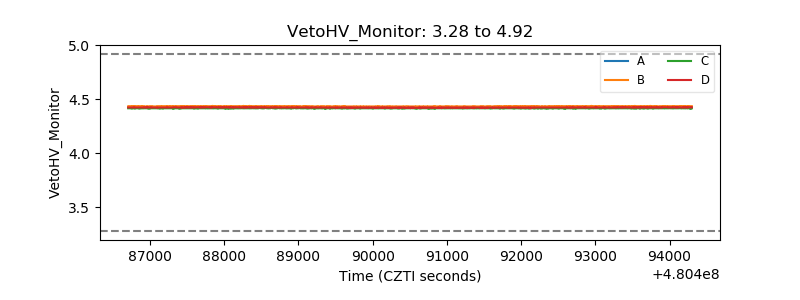 |
| Veto LLD | 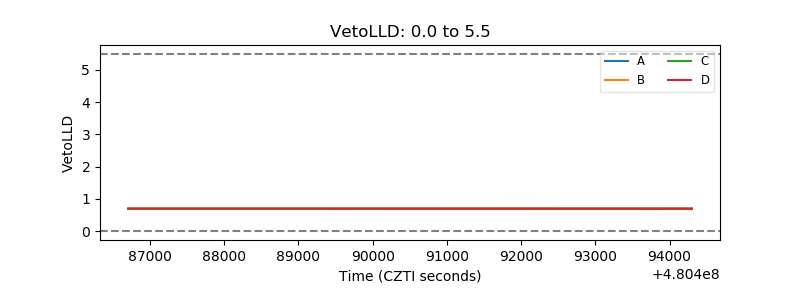 |
| Alpha Counter | 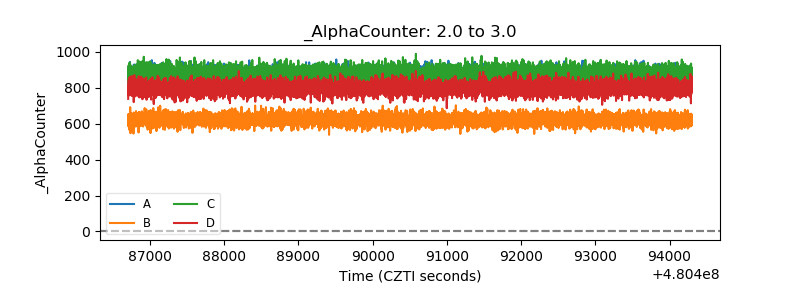 |
| _CPM_Rate | 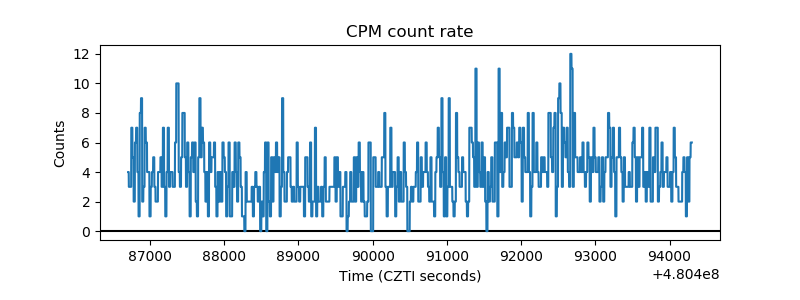 |
| CZT Counter | 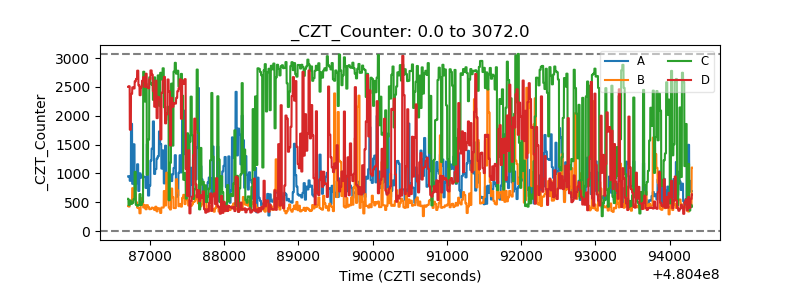 |
| +2.5 Volts monitor |  |
| +5 Volts monitor | 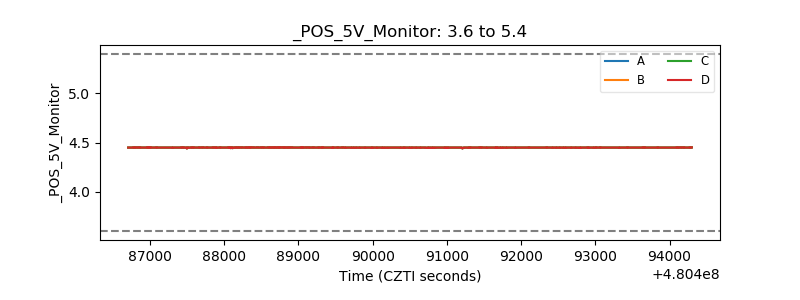 |
| _ROLL_ROT | 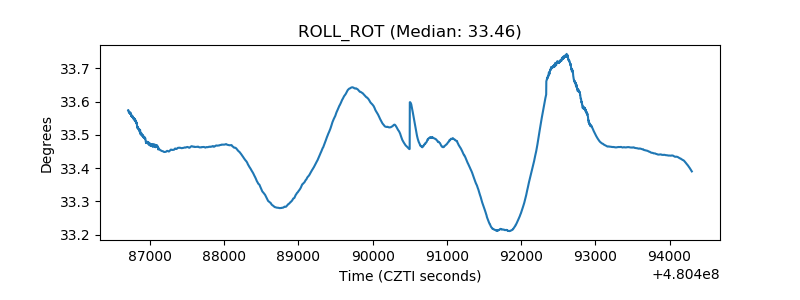 |
| _Roll_DEC | 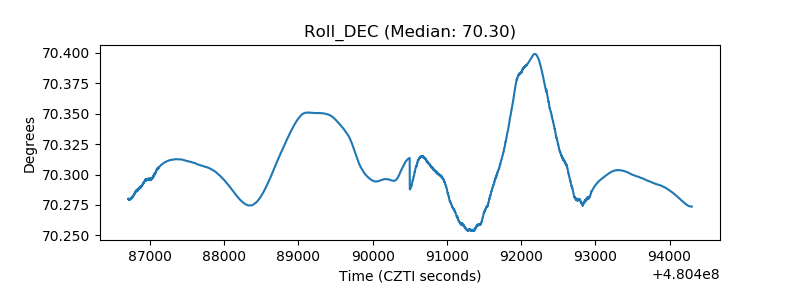 |
| _Roll_RA | 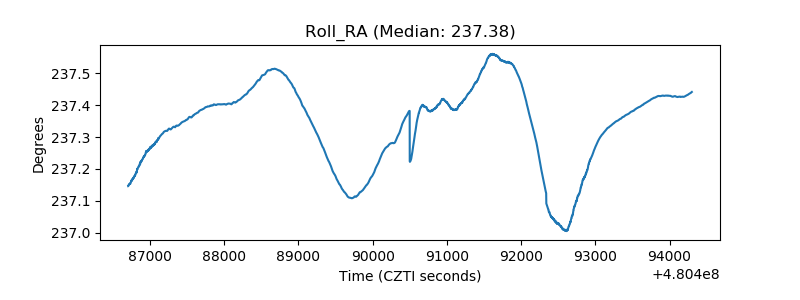 |
| Veto Counter | 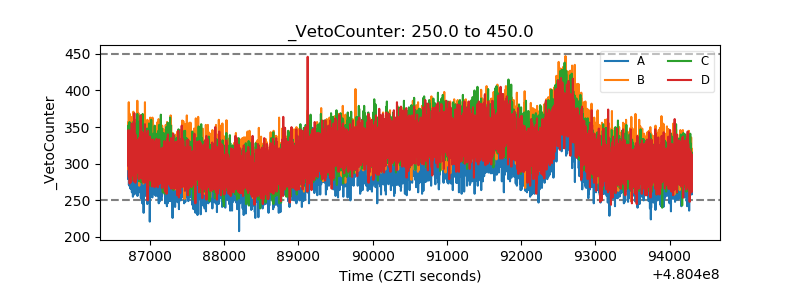 |