| Param | Original file | Final file |
|---|---|---|
| Filename | modeM0/AS1C07_001T03_9000006456_51312cztM0_level2.fits | modeM0/AS1C07_001T03_9000006456_51312cztM0_level2_quad_clean.evt |
| Size (bytes) | 886,988,160 | 92,681,280 |
| Size | 845.9 MB | 88.4 MB |
| Events in quadrant A | 6,897,557 | 655,352 |
| Events in quadrant B | 4,228,128 | 743,876 |
| Events in quadrant C | 14,487,709 | 290,449 |
| Events in quadrant D | 6,633,599 | 588,560 |
| Mode SS | |||
|---|---|---|---|
| Quadrant | BADHDUFLAG | Total packets | Discarded packets |
| A | 0 | 152 | 0 |
| B | 0 | 152 | 0 |
| C | 0 | 152 | 0 |
| D | 0 | 152 | 0 |
| Mode M0 | |||
|---|---|---|---|
| Quadrant | BADHDUFLAG | Total packets | Discarded packets |
| A | 0 | 25880 | 0 |
| B | 0 | 17824 | 0 |
| C | 0 | 48186 | 0 |
| D | 0 | 25013 | 0 |
| Quadrant | Total seconds | Saturated seconds | Saturation percentage |
|---|---|---|---|
| A | 7582 | 395 | 5.209707% |
| B | 7583 | 168 | 2.215482% |
| C | 7583 | 4605 | 60.727944% |
| D | 7583 | 615 | 8.110247% |
Noise dominated data is calculated using 1-second bins in cleaned event files. If a bin has >2000 counts, and if more than 50% of those come from <1% of pixels, then it is considered to be noise-dominated and hence unusable.
| Quadrant | # 1 sec bins | Bins with >0 counts | Bins with >2000 counts | High rate bins dominated by noise | Noise dominated (total time) | Noise dominated (detector-on time) | Marked lightcurve |
|---|---|---|---|---|---|---|---|
| A | 7582 | 7582 | 281 | 281 | 3.71% | 3.71% | 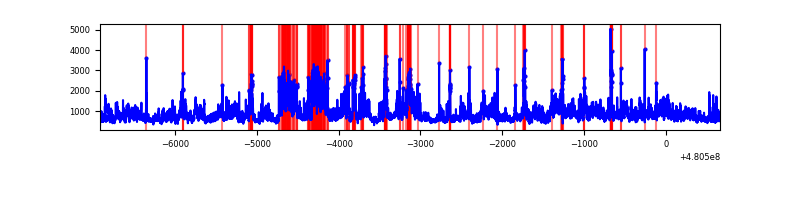 |
| B | 7583 | 7583 | 113 | 113 | 1.49% | 1.49% | 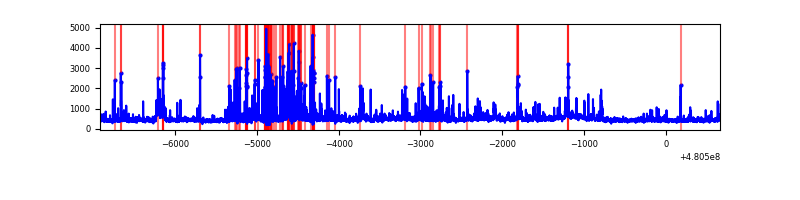 |
| C | 7583 | 7583 | 4113 | 4113 | 54.24% | 54.24% | 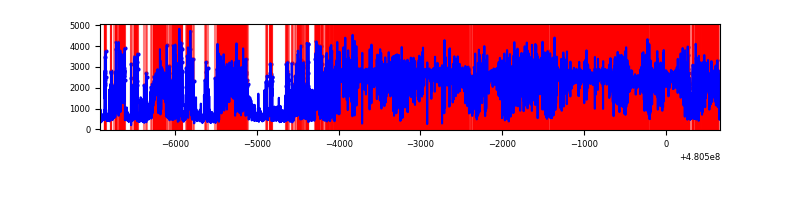 |
| D | 7583 | 7583 | 600 | 600 | 7.91% | 7.91% | 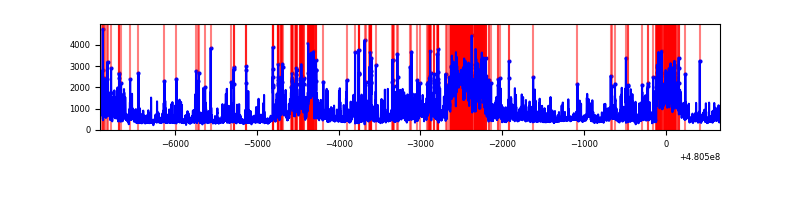 |
Top three noisy pixels from each quadrant. If the there are fewer than three noisy pixels in the level2.evt file, extra rows are filled as -1
| Pixel properties | Quadrant properties | ||||||
|---|---|---|---|---|---|---|---|
| Quadrant | DetID | PixID | Counts | Sigma | Mean | Median | Sigma |
| A | 12 | 3 | 1893868 | 10162.7 | 752 | 735 | 186.3 |
| A | 12 | 250 | 1124114 | 6030.52 | 752 | 735 | 186.3 |
| A | 12 | 194 | 219168 | 1172.59 | 752 | 735 | 186.3 |
| B | 5 | 172 | 389796 | 2357.01 | 764 | 736 | 165.1 |
| B | 7 | 252 | 145853 | 879.15 | 764 | 736 | 165.1 |
| B | 5 | 185 | 129454 | 779.8 | 764 | 736 | 165.1 |
| C | 4 | 12 | 7345825 | 54266.04 | 488 | 485 | 135.4 |
| C | 13 | 49 | 2247653 | 16601.67 | 488 | 485 | 135.4 |
| C | 15 | 179 | 1503108 | 11101.11 | 488 | 485 | 135.4 |
| D | 7 | 60 | 1105052 | 5497.07 | 718 | 692 | 200.9 |
| D | 6 | 42 | 553513 | 2751.73 | 718 | 692 | 200.9 |
| D | 7 | 80 | 438133 | 2177.41 | 718 | 692 | 200.9 |
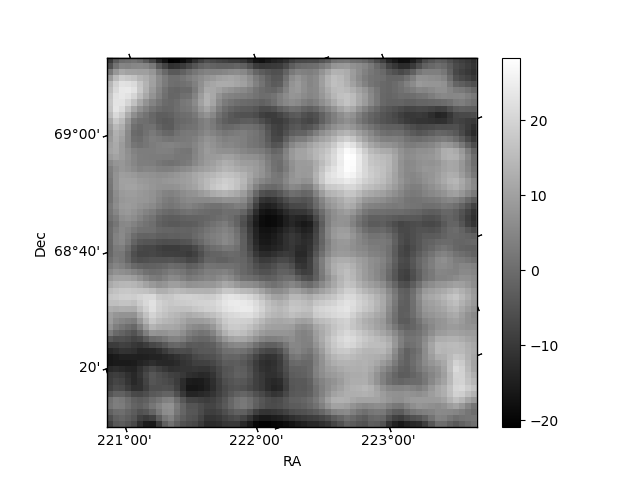
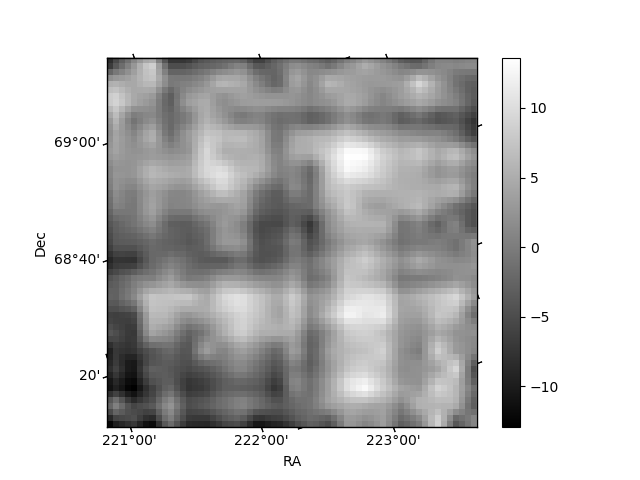
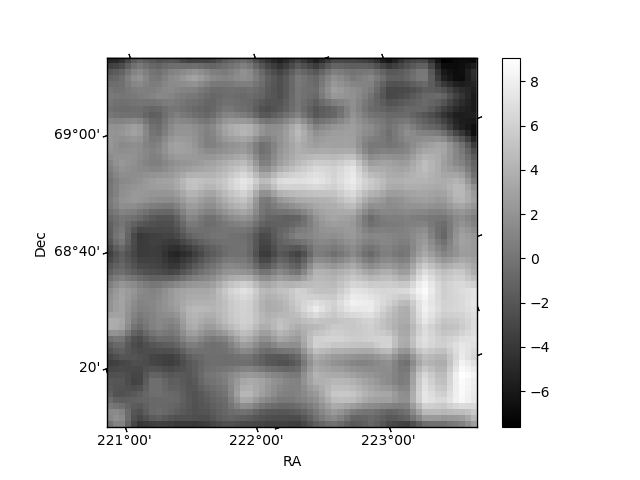
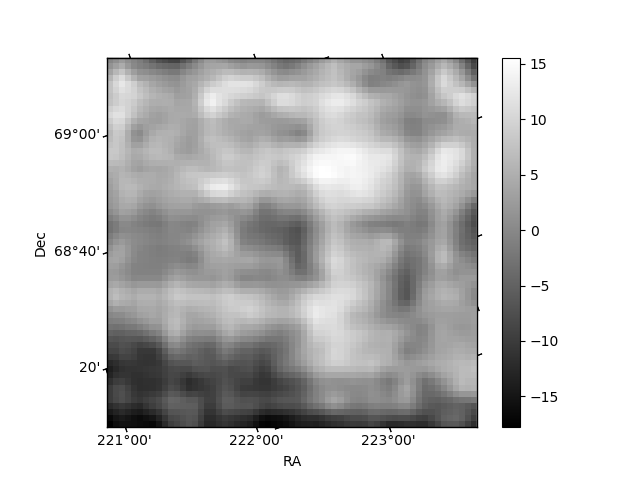
Histogram calculated using DETX and DETY for each event in the final _common_clean file
| Quadrant A | 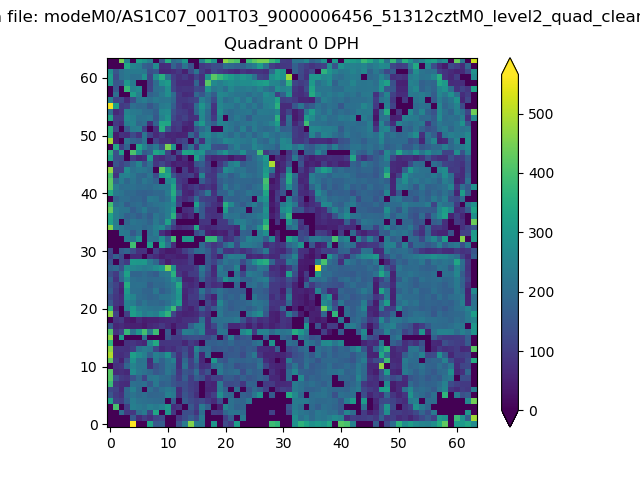 |
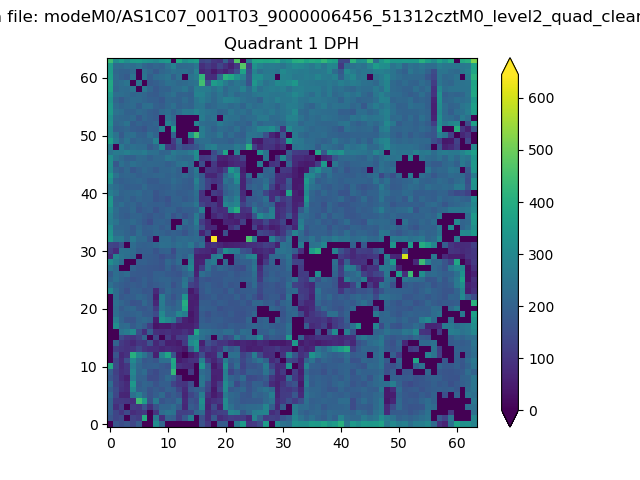 |
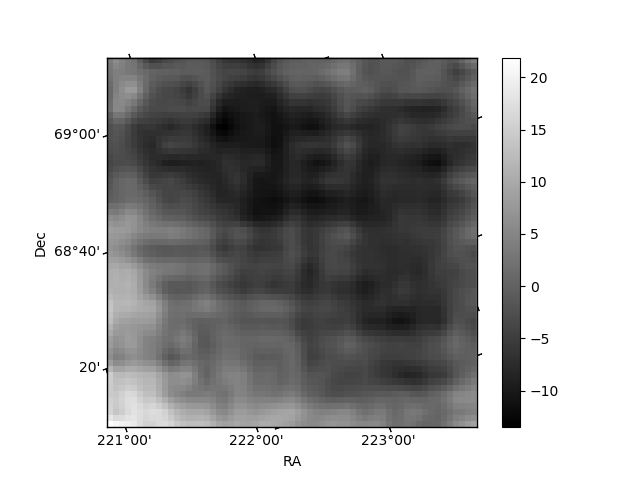
Quadrant B |
|---|---|---|---|
| Quadrant D | 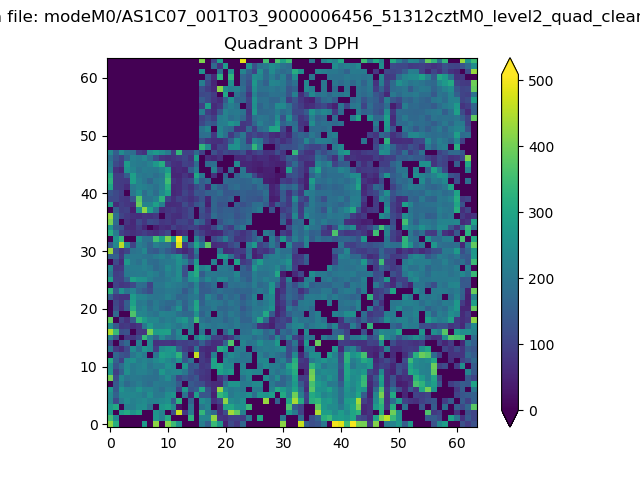 |
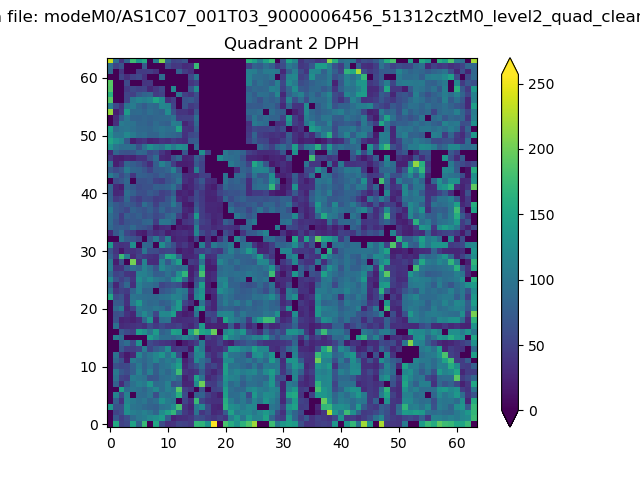 |
Quadrant C |
| Plot type | Count rate plots | Images |
|---|---|---|
| Comparison with Poisson distribution Blue bars denote a histogram of data divided into 1 sec bins. Red curve is a Poisson curve with rate = median count rate of data. |
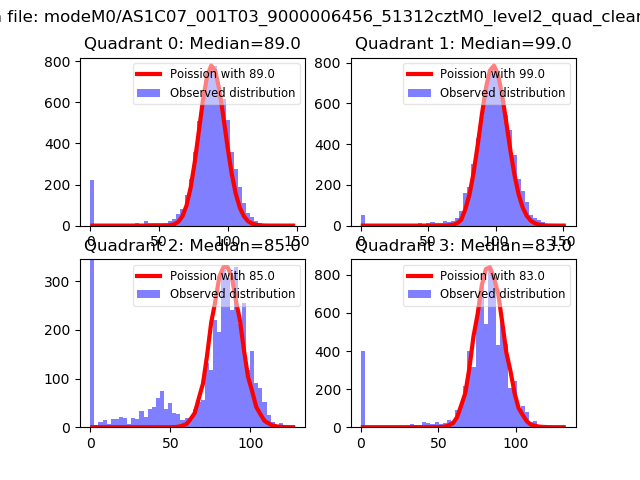 |
 |
| Quadrant-wise count rates Data is divided into 100 sec bins |
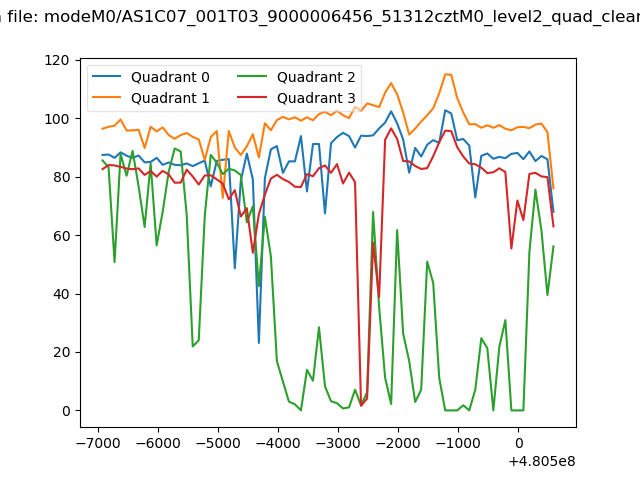 |
|
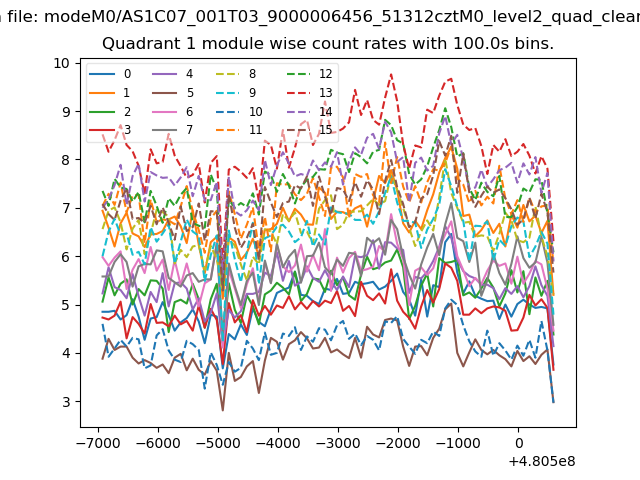
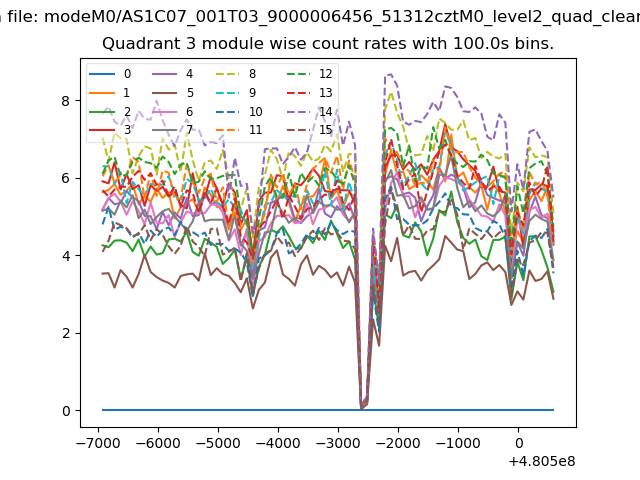
| Module-wise count rates for Quadrant A Data is divided into 100 sec bins |
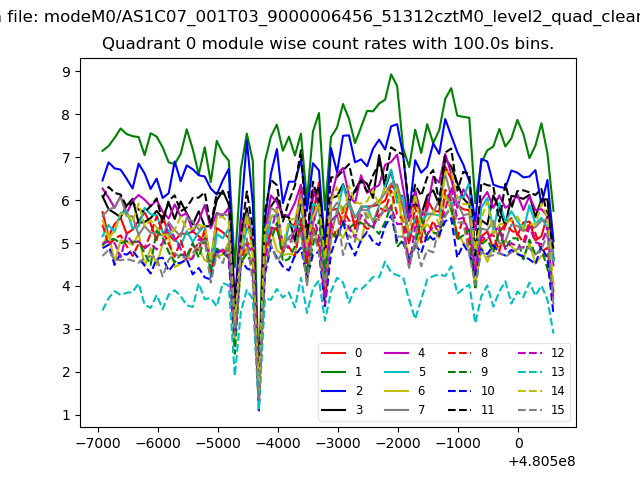 |
 |
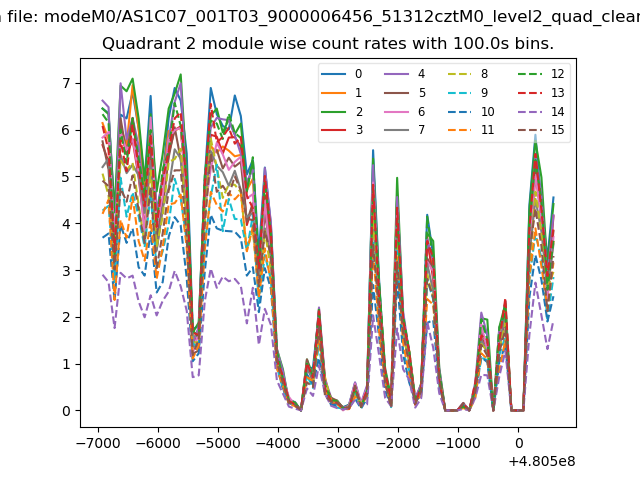
| Module-wise count rates for Quadrant B Data is divided into 100 sec bins |
 |
 |
| Module-wise count rates for Quadrant C Data is divided into 100 sec bins |
 |
 |
| Module-wise count rates for Quadrant D Data is divided into 100 sec bins |
 |
 |
| Parameter | Plot |
|---|---|
| CZT HV Monitor | 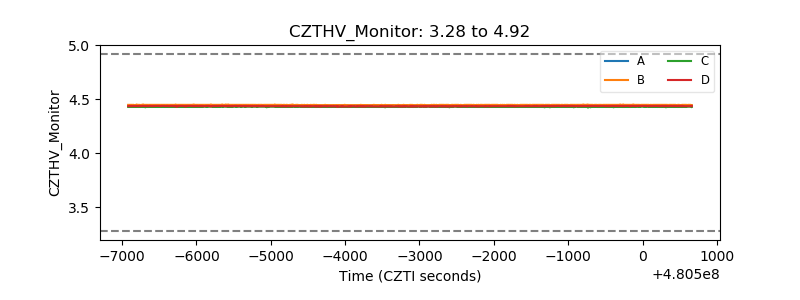 |
| D_VDD | 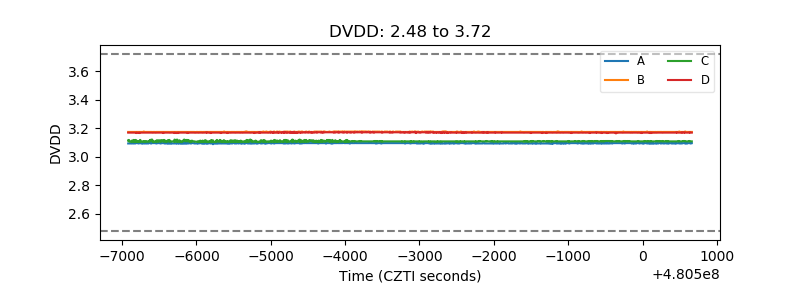 |
| Temperature 1 | 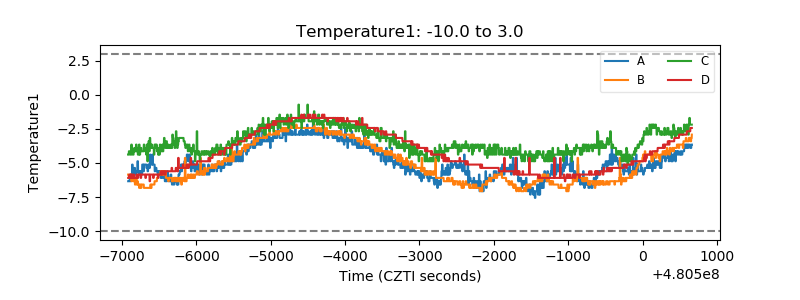 |
| Veto HV Monitor |  |
| Veto LLD | 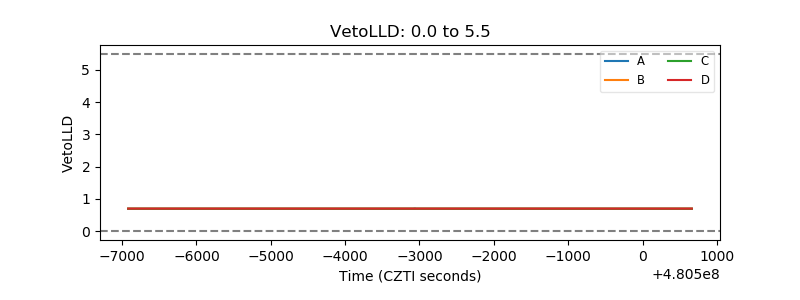 |
| Alpha Counter | 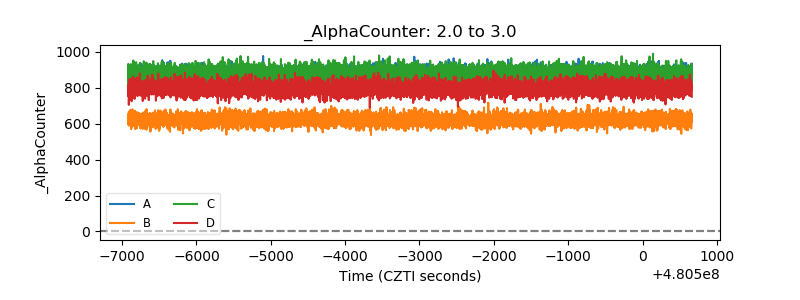 |
| _CPM_Rate | 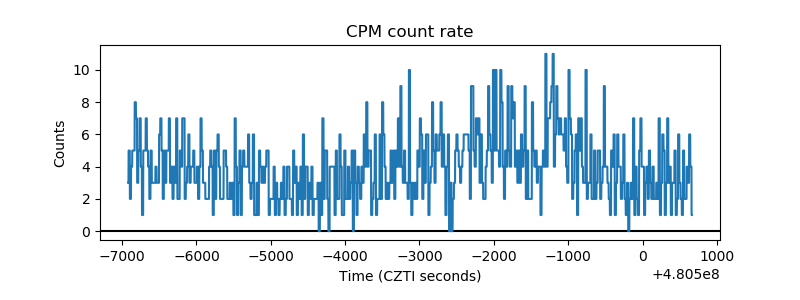 |
| CZT Counter | 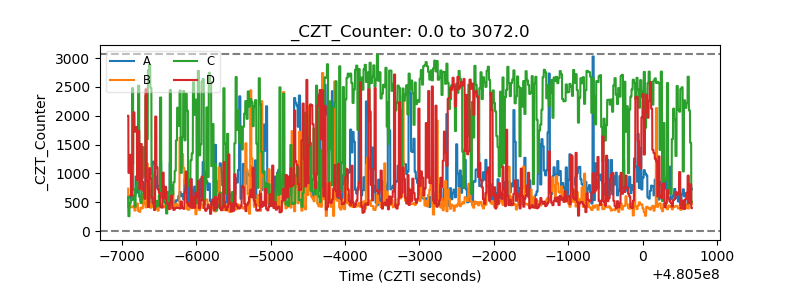 |
| +2.5 Volts monitor | 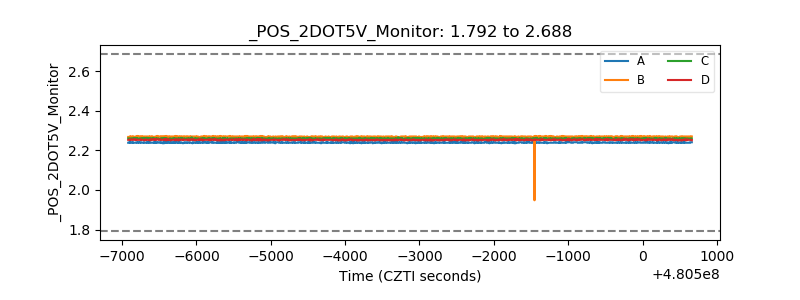 |
| +5 Volts monitor | 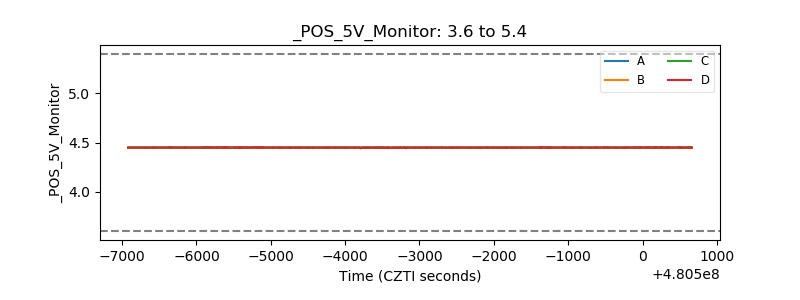 |
| _ROLL_ROT |  |
| _Roll_DEC | 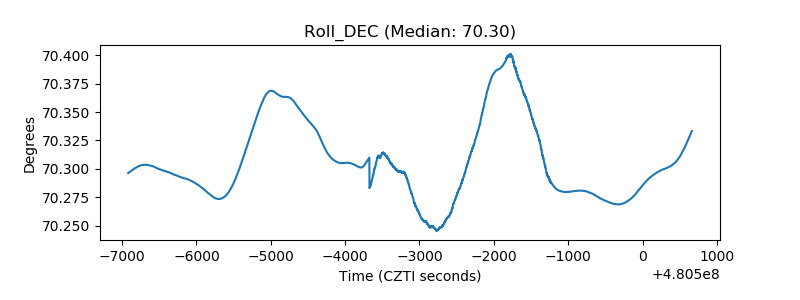 |
| _Roll_RA | 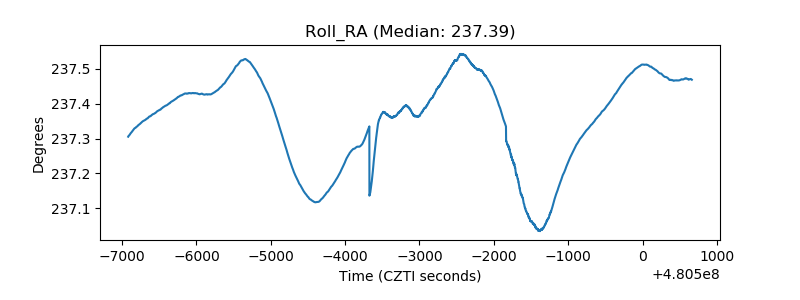 |
| Veto Counter | 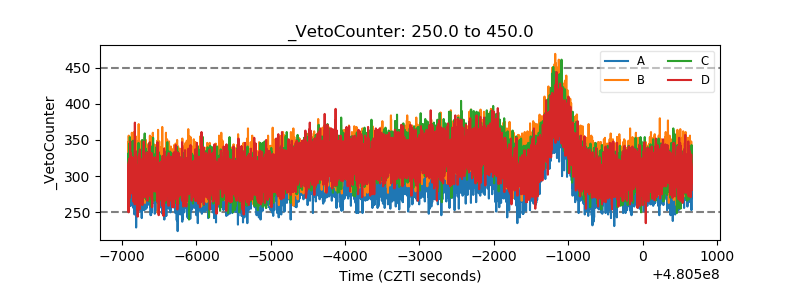 |