| Param | Original file | Final file |
|---|---|---|
| Filename | modeM0/AS1C07_001T03_9000006456_51316cztM0_level2.fits | modeM0/AS1C07_001T03_9000006456_51316cztM0_level2_quad_clean.evt |
| Size (bytes) | 718,879,680 | 81,771,840 |
| Size | 685.6 MB | 78.0 MB |
| Events in quadrant A | 7,001,853 | 540,809 |
| Events in quadrant B | 3,898,351 | 635,080 |
| Events in quadrant C | 10,250,928 | 343,872 |
| Events in quadrant D | 4,962,176 | 507,685 |
| Mode SS | |||
|---|---|---|---|
| Quadrant | BADHDUFLAG | Total packets | Discarded packets |
| A | 0 | 132 | 0 |
| B | 0 | 132 | 0 |
| C | 0 | 132 | 0 |
| D | 0 | 132 | 0 |
| Mode M0 | |||
|---|---|---|---|
| Quadrant | BADHDUFLAG | Total packets | Discarded packets |
| A | 0 | 25344 | 1 |
| B | 0 | 15944 | 1 |
| C | 0 | 34876 | 7 |
| D | 0 | 19267 | 1 |
| Mode M9 | |||
|---|---|---|---|
| Quadrant | BADHDUFLAG | Total packets | Discarded packets |
| A | 0 | 8 | 0 |
| B | 0 | 8 | 0 |
| C | 0 | 8 | 0 |
| D | 0 | 8 | 0 |
| Quadrant | Total seconds | Saturated seconds | Saturation percentage |
|---|---|---|---|
| A | 6421 | 773 | 12.038623% |
| B | 6422 | 211 | 3.285581% |
| C | 6421 | 2828 | 44.042984% |
| D | 6421 | 483 | 7.522193% |
Noise dominated data is calculated using 1-second bins in cleaned event files. If a bin has >2000 counts, and if more than 50% of those come from <1% of pixels, then it is considered to be noise-dominated and hence unusable.
| Quadrant | # 1 sec bins | Bins with >0 counts | Bins with >2000 counts | High rate bins dominated by noise | Noise dominated (total time) | Noise dominated (detector-on time) | Marked lightcurve |
|---|---|---|---|---|---|---|---|
| A | 7251 | 6421 | 390 | 390 | 5.38% | 6.07% | 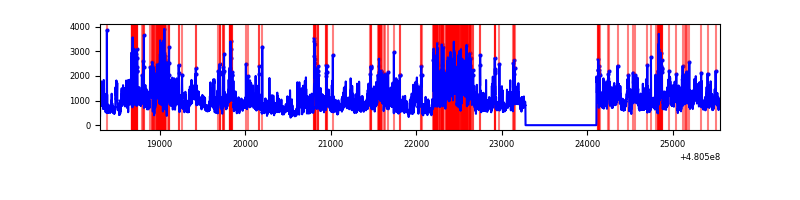 |
| B | 7252 | 6422 | 108 | 108 | 1.49% | 1.68% | 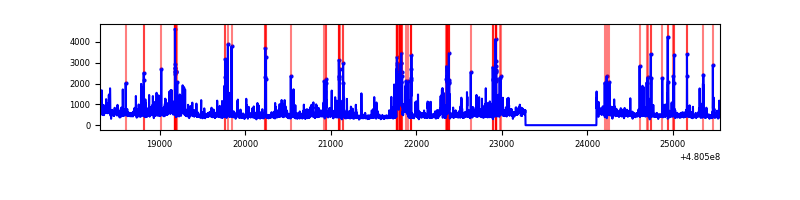 |
| C | 7250 | 6420 | 2594 | 2594 | 35.78% | 40.40% | 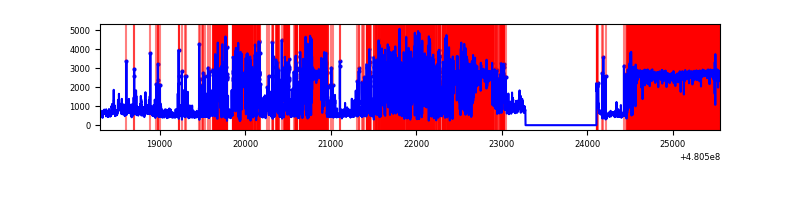 |
| D | 7250 | 6420 | 365 | 365 | 5.03% | 5.69% | 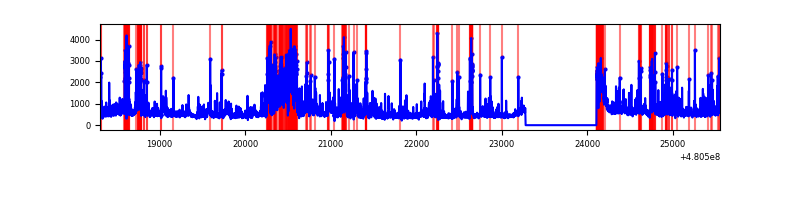 |
Top three noisy pixels from each quadrant. If the there are fewer than three noisy pixels in the level2.evt file, extra rows are filled as -1
| Pixel properties | Quadrant properties | ||||||
|---|---|---|---|---|---|---|---|
| Quadrant | DetID | PixID | Counts | Sigma | Mean | Median | Sigma |
| A | 12 | 3 | 2470781 | 15459.68 | 645 | 629 | 159.8 |
| A | 12 | 250 | 905181 | 5661.23 | 645 | 629 | 159.8 |
| A | 12 | 194 | 282785 | 1765.9 | 645 | 629 | 159.8 |
| B | 5 | 172 | 628589 | 4428.55 | 667 | 644 | 141.8 |
| B | 10 | 247 | 120449 | 844.92 | 667 | 644 | 141.8 |
| B | 5 | 185 | 108308 | 759.29 | 667 | 644 | 141.8 |
| C | 4 | 12 | 6804951 | 52774.79 | 464 | 460 | 128.9 |
| C | 15 | 179 | 282525 | 2187.66 | 464 | 460 | 128.9 |
| C | 3 | 233 | 267298 | 2069.56 | 464 | 460 | 128.9 |
| D | 8 | 176 | 1137135 | 6473.71 | 637 | 614 | 175.6 |
| D | 6 | 42 | 283824 | 1613.18 | 637 | 614 | 175.6 |
| D | 2 | 216 | 237489 | 1349.25 | 637 | 614 | 175.6 |
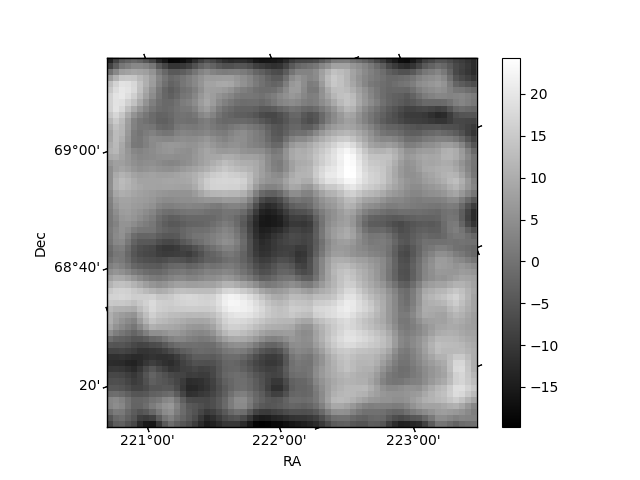
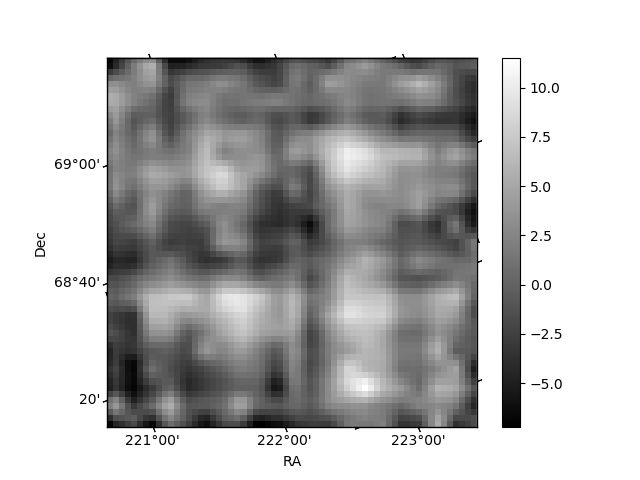
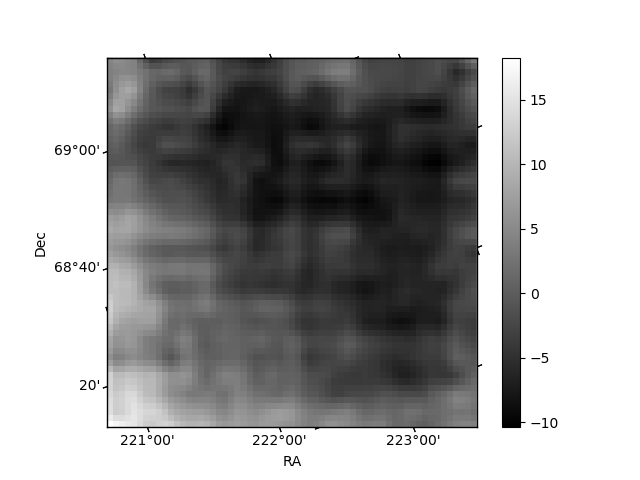
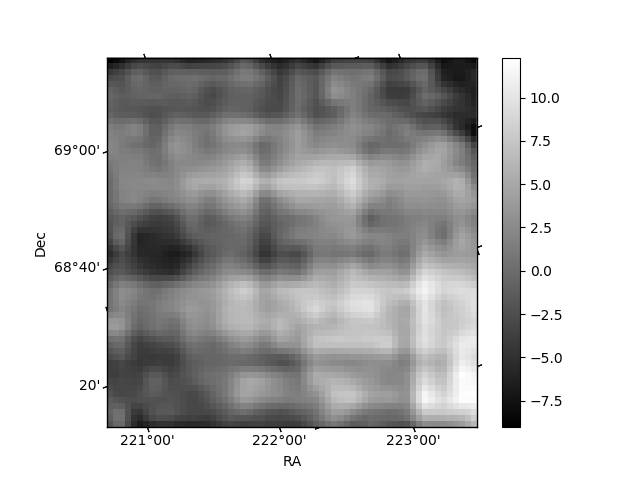
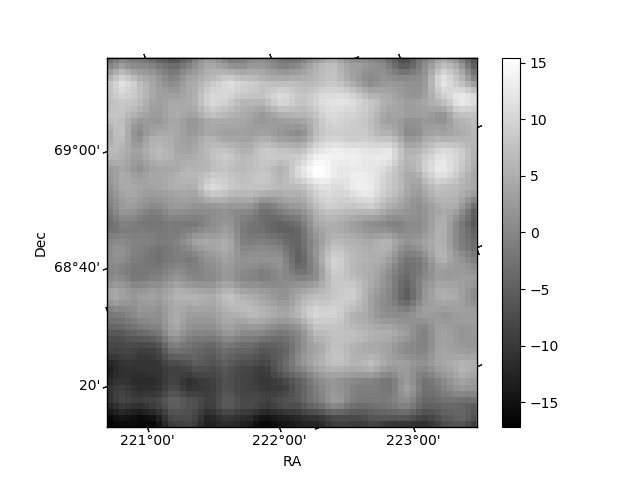
Histogram calculated using DETX and DETY for each event in the final _common_clean file
| Quadrant A | 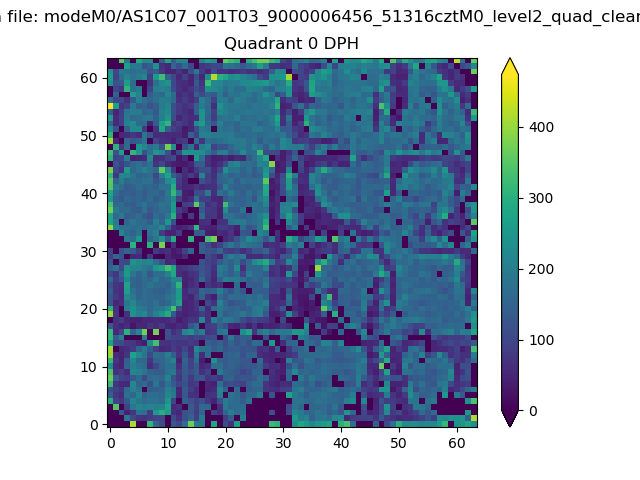 |
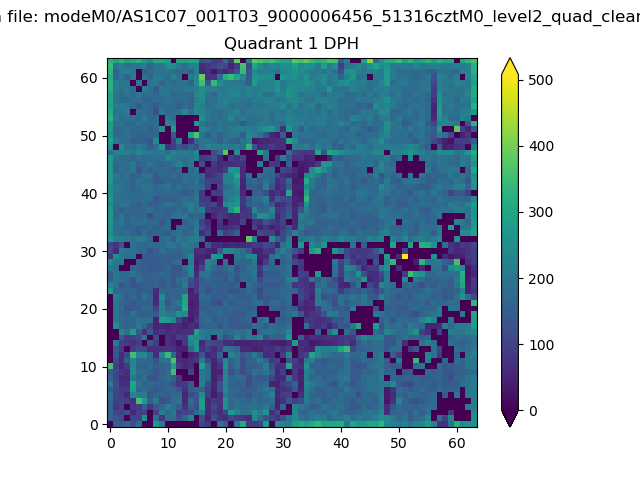 |
Quadrant B |
|---|---|---|---|
| Quadrant D | 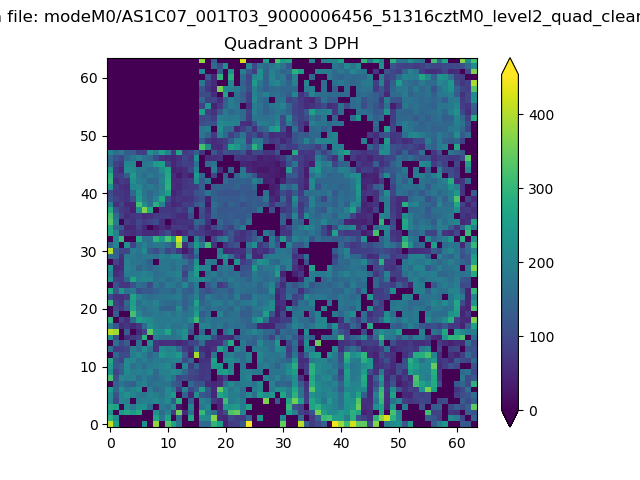 |
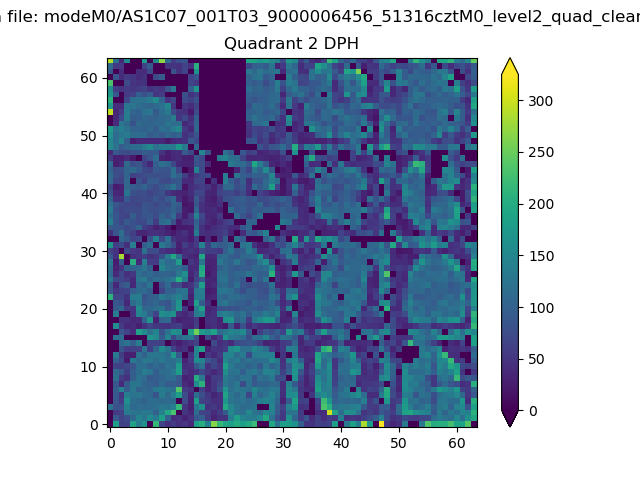 |
Quadrant C |
| Plot type | Count rate plots | Images |
|---|---|---|
| Comparison with Poisson distribution Blue bars denote a histogram of data divided into 1 sec bins. Red curve is a Poisson curve with rate = median count rate of data. |
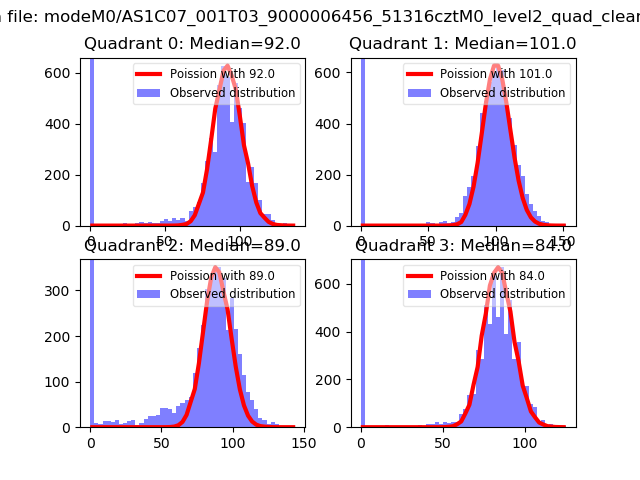 |
 |
| Quadrant-wise count rates Data is divided into 100 sec bins |
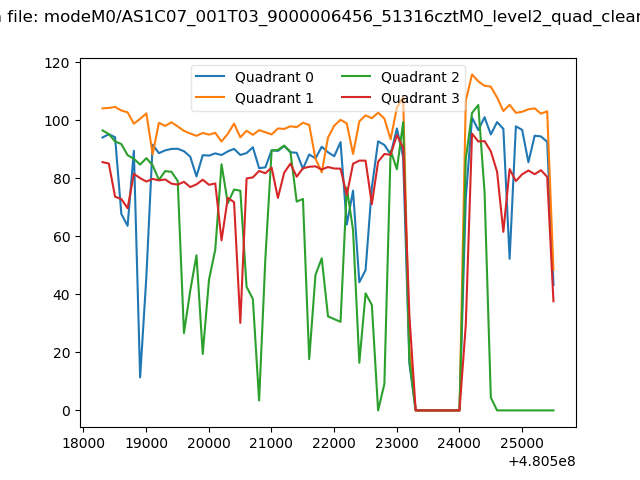 |
|
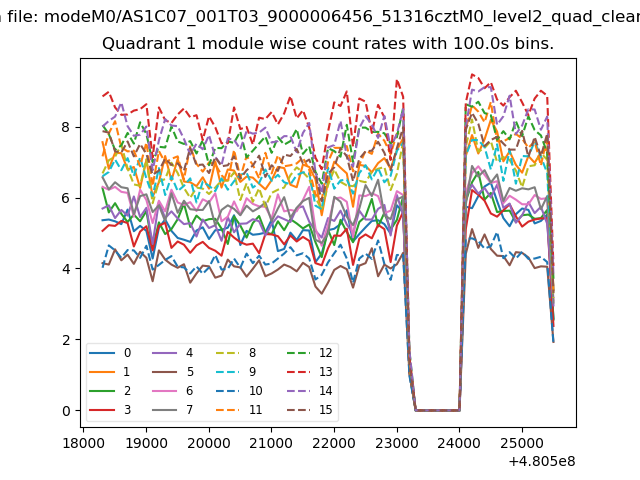
| Module-wise count rates for Quadrant A Data is divided into 100 sec bins |
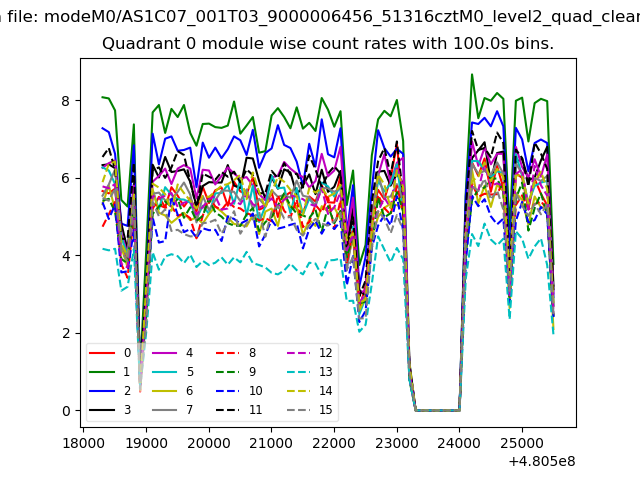 |
 |
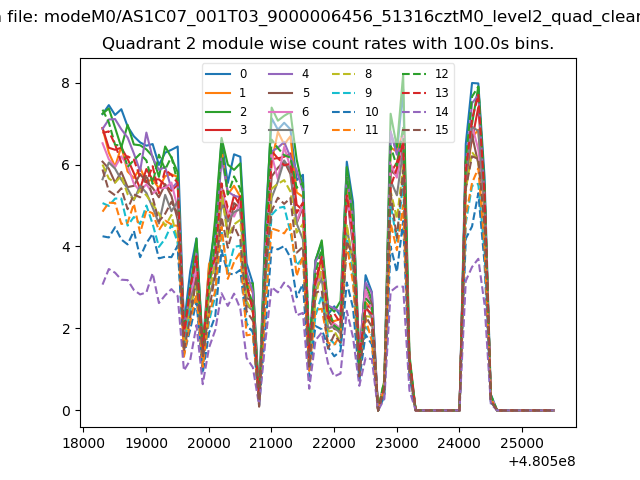
| Module-wise count rates for Quadrant B Data is divided into 100 sec bins |
 |
 |
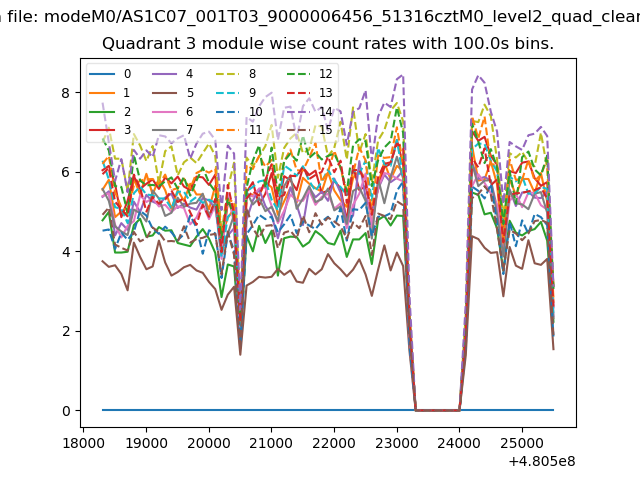
| Module-wise count rates for Quadrant C Data is divided into 100 sec bins |
 |
 |
| Module-wise count rates for Quadrant D Data is divided into 100 sec bins |
 |
 |
| Parameter | Plot |
|---|---|
| CZT HV Monitor | 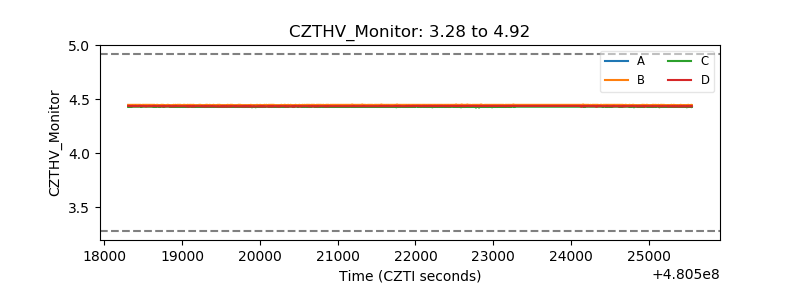 |
| D_VDD | 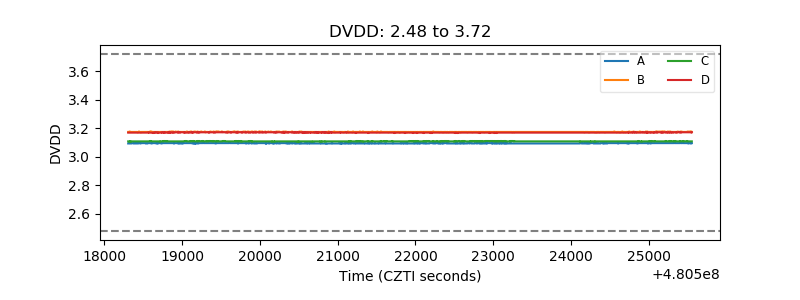 |
| Temperature 1 | 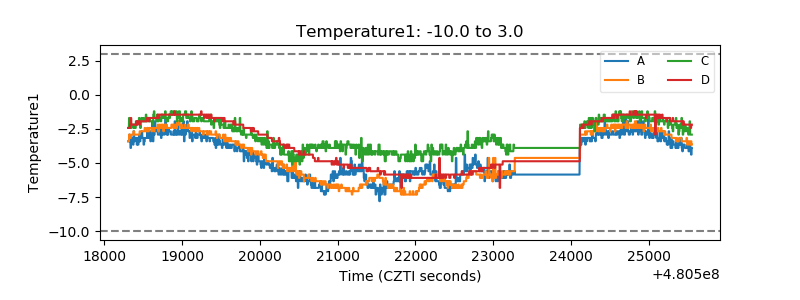 |
| Veto HV Monitor | 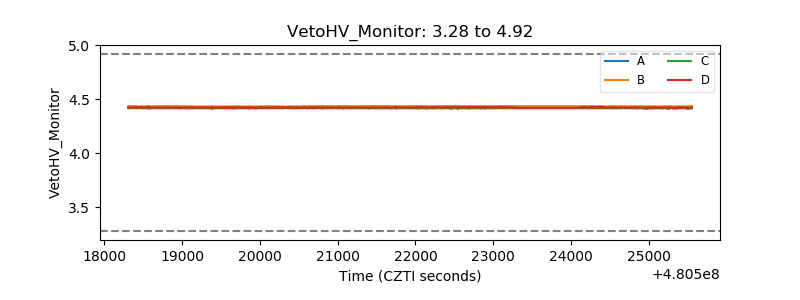 |
| Veto LLD | 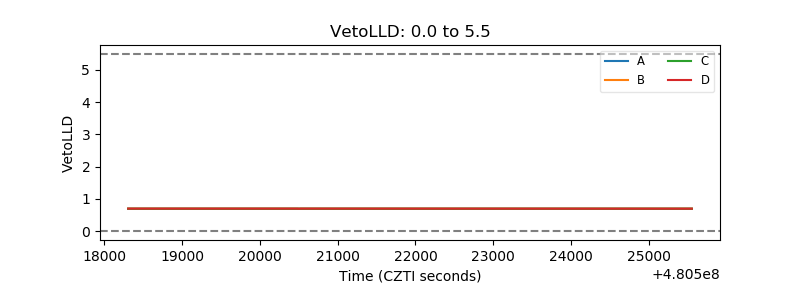 |
| Alpha Counter | 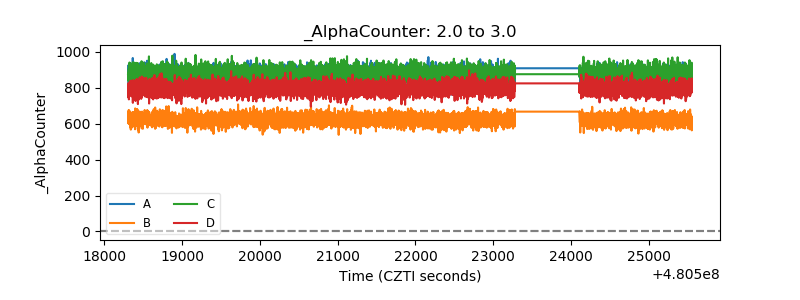 |
| _CPM_Rate | 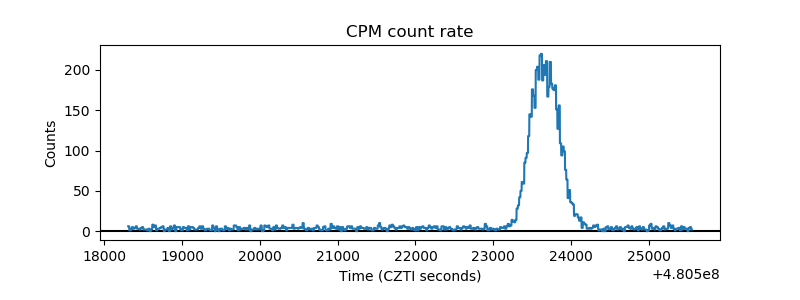 |
| CZT Counter | 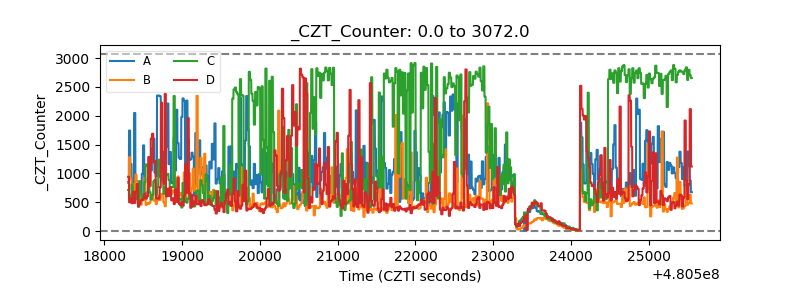 |
| +2.5 Volts monitor | 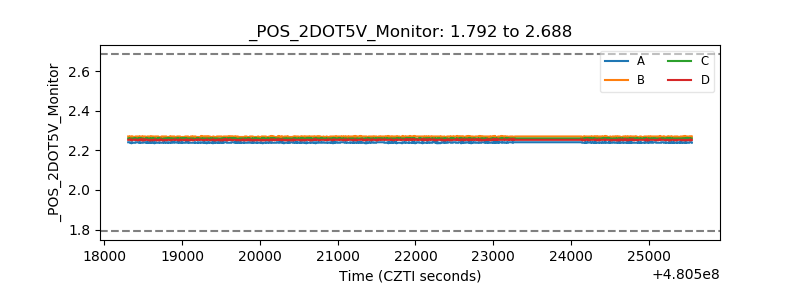 |
| +5 Volts monitor | 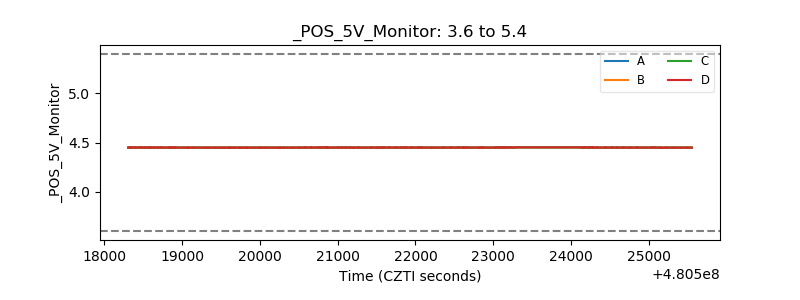 |
| _ROLL_ROT | 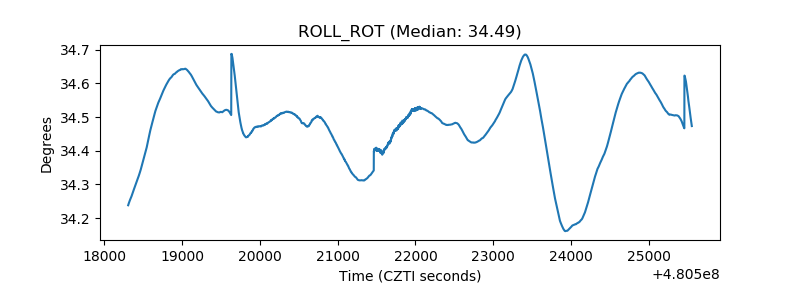 |
| _Roll_DEC | 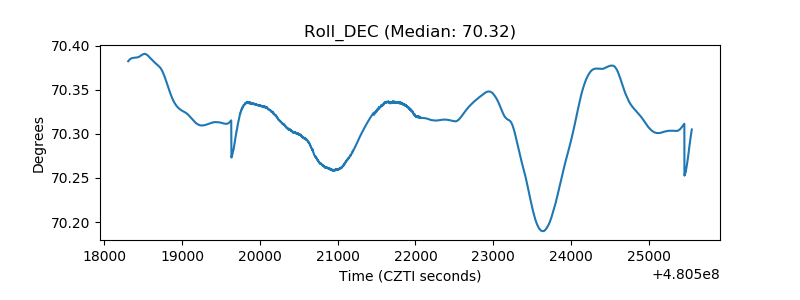 |
| _Roll_RA | 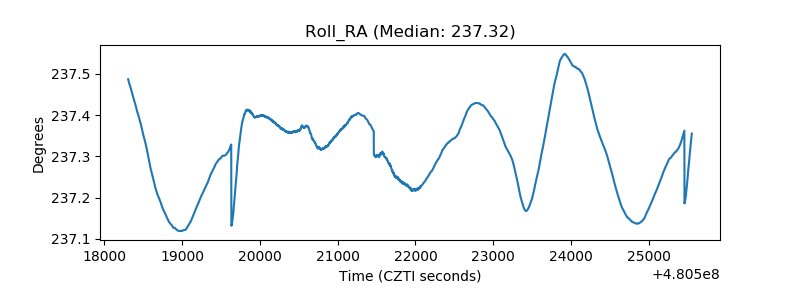 |
| Veto Counter | 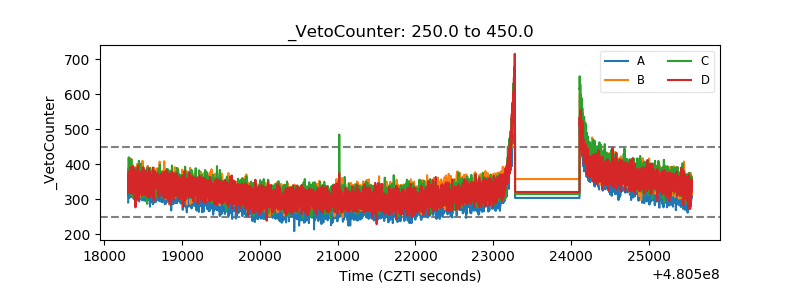 |