| Param | Original file | Final file |
|---|---|---|
| Filename | modeM0/AS1C07_001T03_9000006456_51318cztM0_level2.fits | modeM0/AS1C07_001T03_9000006456_51318cztM0_level2_quad_clean.evt |
| Size (bytes) | 835,833,600 | 80,415,360 |
| Size | 797.1 MB | 76.7 MB |
| Events in quadrant A | 6,531,132 | 594,132 |
| Events in quadrant B | 4,202,426 | 655,089 |
| Events in quadrant C | 13,049,012 | 238,803 |
| Events in quadrant D | 6,651,247 | 489,871 |
| Mode SS | |||
|---|---|---|---|
| Quadrant | BADHDUFLAG | Total packets | Discarded packets |
| A | 0 | 134 | 0 |
| B | 0 | 134 | 0 |
| C | 0 | 134 | 0 |
| D | 0 | 134 | 0 |
| Mode M0 | |||
|---|---|---|---|
| Quadrant | BADHDUFLAG | Total packets | Discarded packets |
| A | 0 | 24064 | 5 |
| B | 0 | 17000 | 1 |
| C | 0 | 43290 | 1 |
| D | 0 | 24361 | 1 |
| Mode M9 | |||
|---|---|---|---|
| Quadrant | BADHDUFLAG | Total packets | Discarded packets |
| A | 0 | 10 | 0 |
| B | 0 | 10 | 0 |
| C | 0 | 10 | 0 |
| D | 0 | 10 | 0 |
| Quadrant | Total seconds | Saturated seconds | Saturation percentage |
|---|---|---|---|
| A | 6542 | 415 | 6.343626% |
| B | 6543 | 321 | 4.906006% |
| C | 6543 | 4201 | 64.206022% |
| D | 6543 | 983 | 15.023689% |
Noise dominated data is calculated using 1-second bins in cleaned event files. If a bin has >2000 counts, and if more than 50% of those come from <1% of pixels, then it is considered to be noise-dominated and hence unusable.
| Quadrant | # 1 sec bins | Bins with >0 counts | Bins with >2000 counts | High rate bins dominated by noise | Noise dominated (total time) | Noise dominated (detector-on time) | Marked lightcurve |
|---|---|---|---|---|---|---|---|
| A | 7562 | 6542 | 210 | 210 | 2.78% | 3.21% | 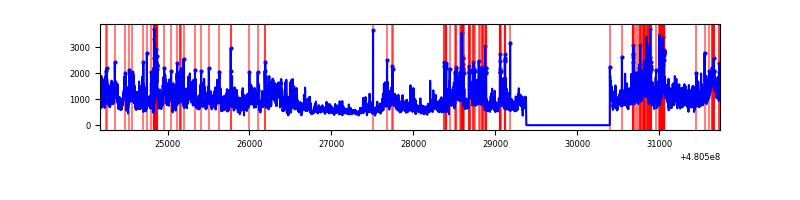 |
| B | 7563 | 6543 | 196 | 196 | 2.59% | 3.00% | 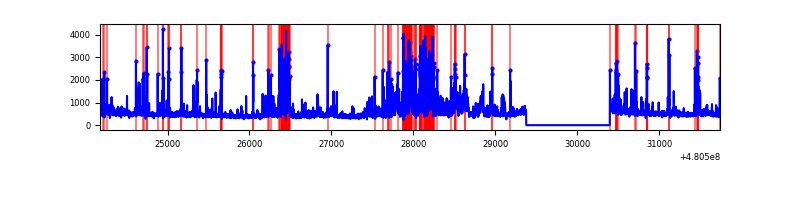 |
| C | 7562 | 6542 | 4007 | 4007 | 52.99% | 61.25% | 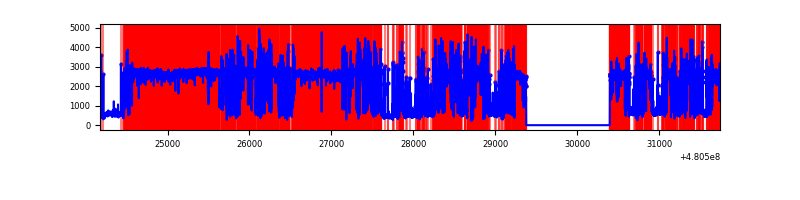 |
| D | 7563 | 6543 | 849 | 849 | 11.23% | 12.98% | 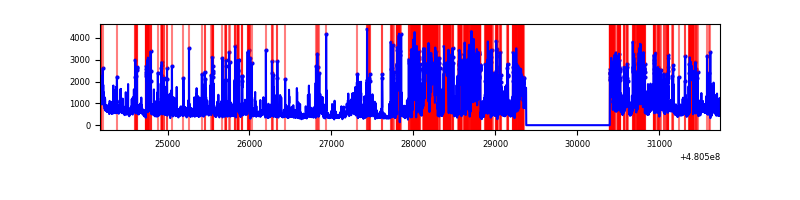 |
Top three noisy pixels from each quadrant. If the there are fewer than three noisy pixels in the level2.evt file, extra rows are filled as -1
| Pixel properties | Quadrant properties | ||||||
|---|---|---|---|---|---|---|---|
| Quadrant | DetID | PixID | Counts | Sigma | Mean | Median | Sigma |
| A | 12 | 3 | 2470507 | 14545.16 | 683 | 667 | 169.8 |
| A | 12 | 250 | 510500 | 3002.46 | 683 | 667 | 169.8 |
| A | 12 | 194 | 283498 | 1665.62 | 683 | 667 | 169.8 |
| B | 5 | 185 | 618877 | 4262.64 | 682 | 659 | 145.0 |
| B | 10 | 254 | 307164 | 2113.36 | 682 | 659 | 145.0 |
| B | 10 | 247 | 164420 | 1129.14 | 682 | 659 | 145.0 |
| C | 4 | 12 | 10935588 | 109305.28 | 356 | 352 | 100.0 |
| C | 3 | 233 | 176664 | 1762.36 | 356 | 352 | 100.0 |
| C | 13 | 3 | 131209 | 1308.01 | 356 | 352 | 100.0 |
| D | 2 | 216 | 1526314 | 8656.06 | 629 | 605 | 176.3 |
| D | 8 | 176 | 688188 | 3900.98 | 629 | 605 | 176.3 |
| D | 12 | 2 | 417925 | 2367.65 | 629 | 605 | 176.3 |
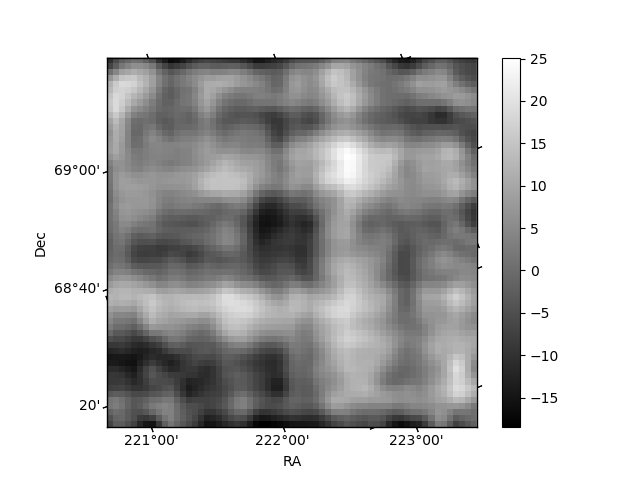
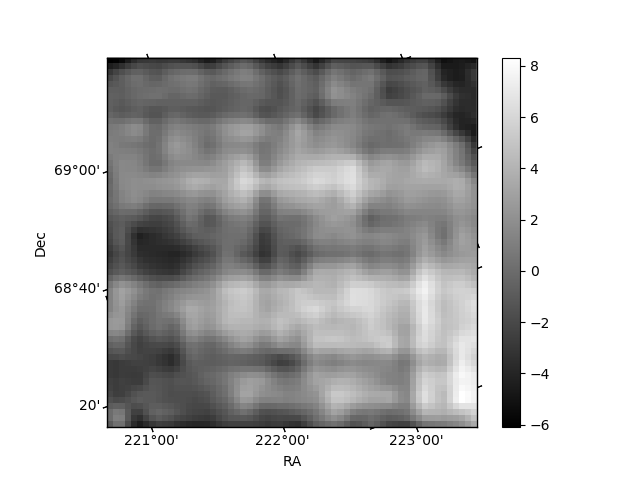
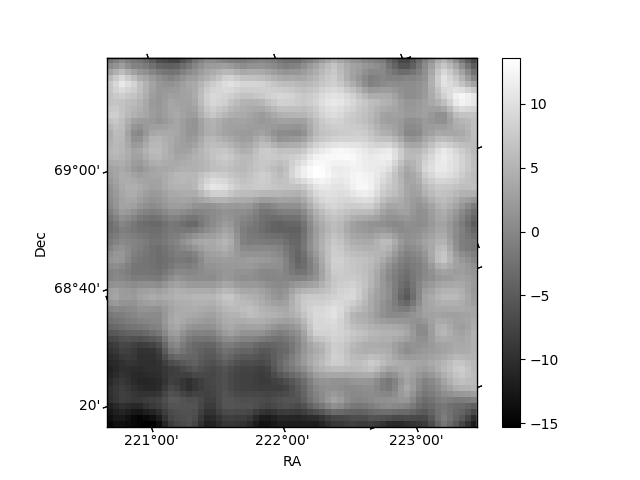
Histogram calculated using DETX and DETY for each event in the final _common_clean file
| Quadrant A | 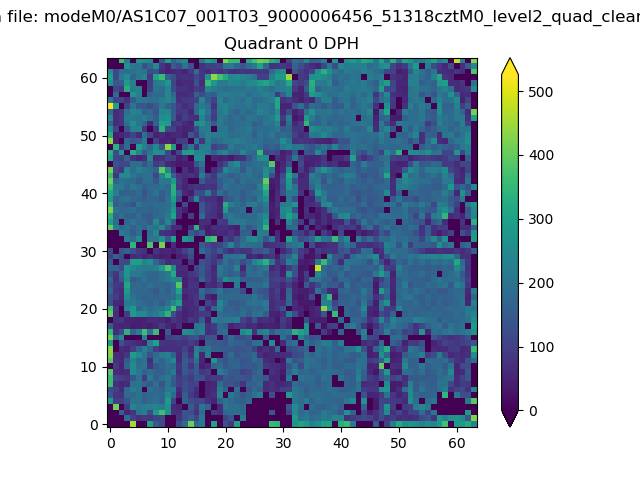 |
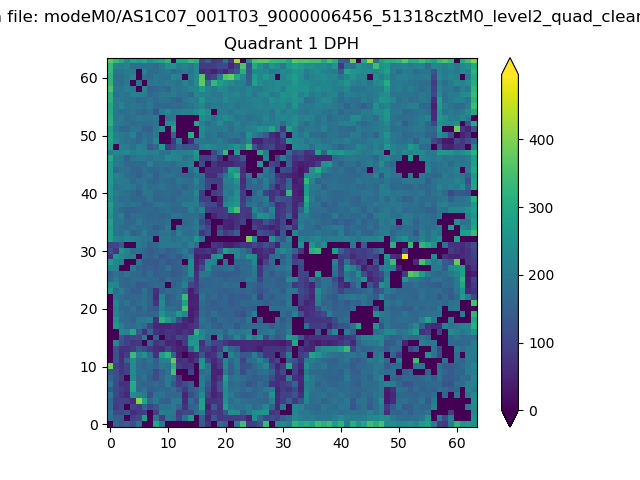 |
Quadrant B |
|---|---|---|---|
| Quadrant D | 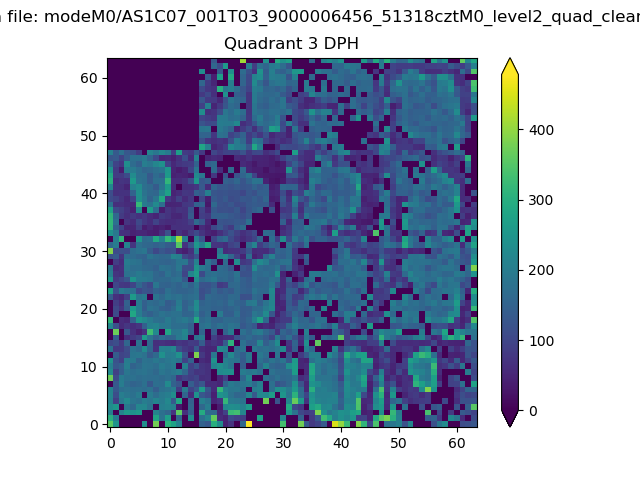 |
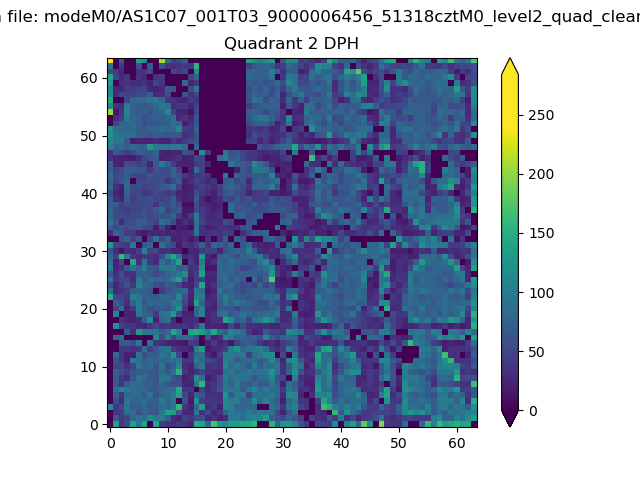 |
Quadrant C |
| Plot type | Count rate plots | Images |
|---|---|---|
| Comparison with Poisson distribution Blue bars denote a histogram of data divided into 1 sec bins. Red curve is a Poisson curve with rate = median count rate of data. |
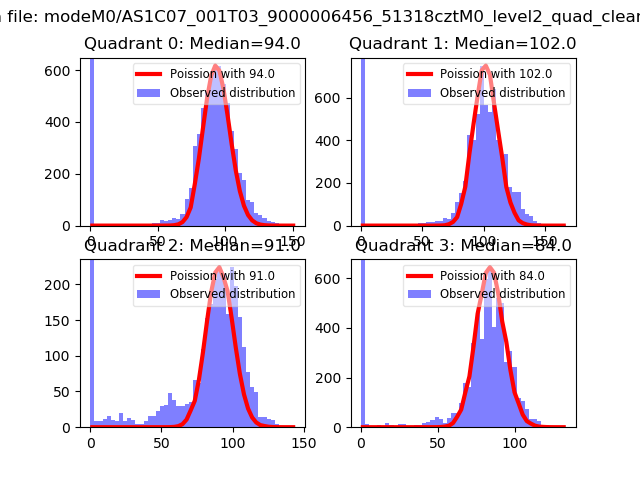 |
 |
| Quadrant-wise count rates Data is divided into 100 sec bins |
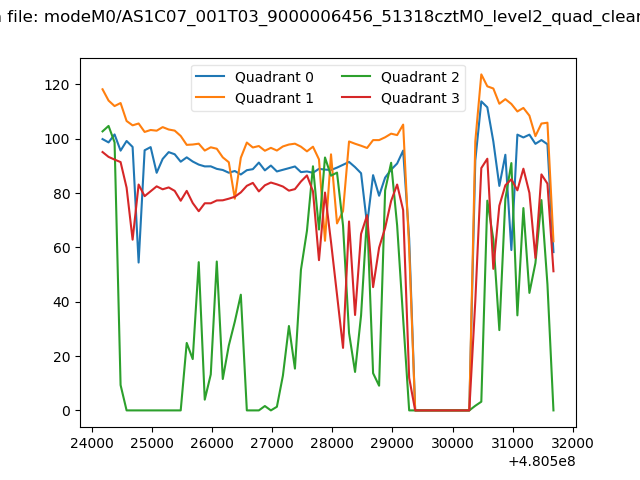 |
|
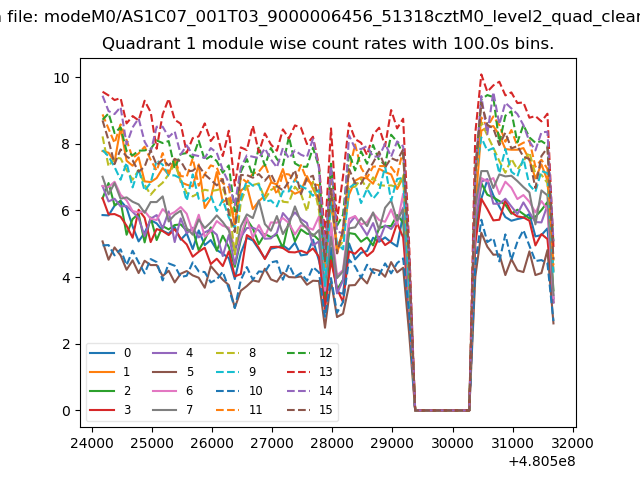
| Module-wise count rates for Quadrant A Data is divided into 100 sec bins |
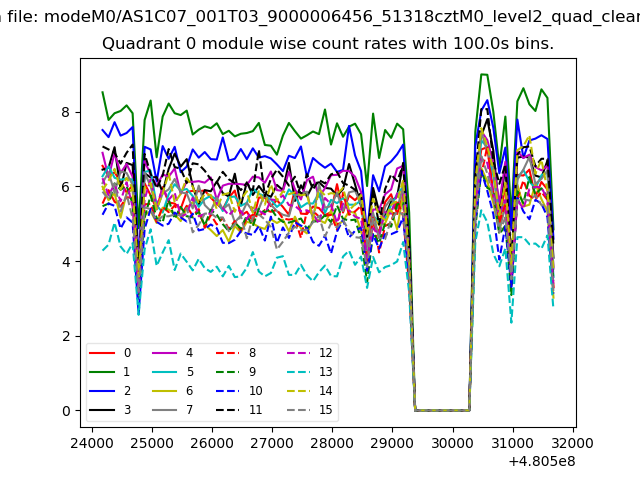 |
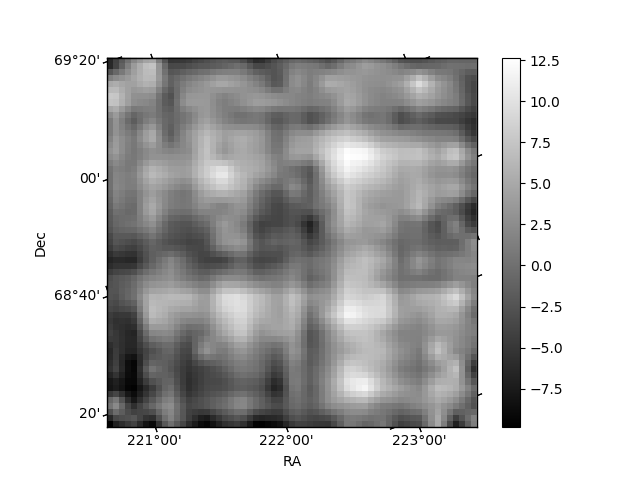 |
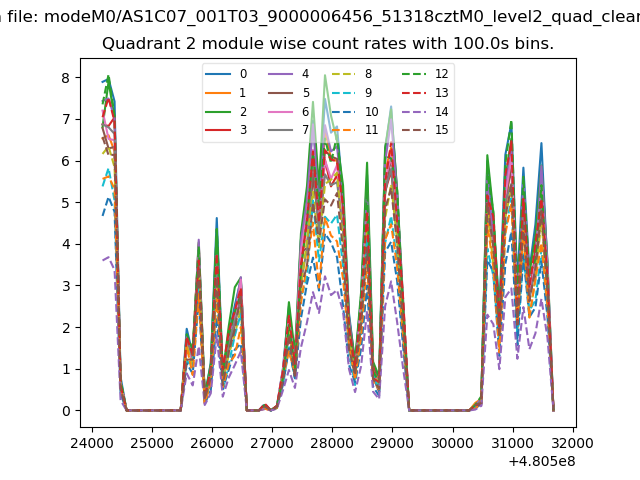
| Module-wise count rates for Quadrant B Data is divided into 100 sec bins |
 |
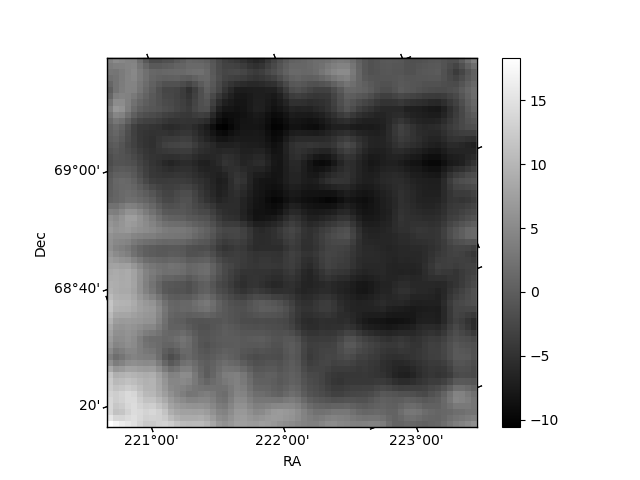 |
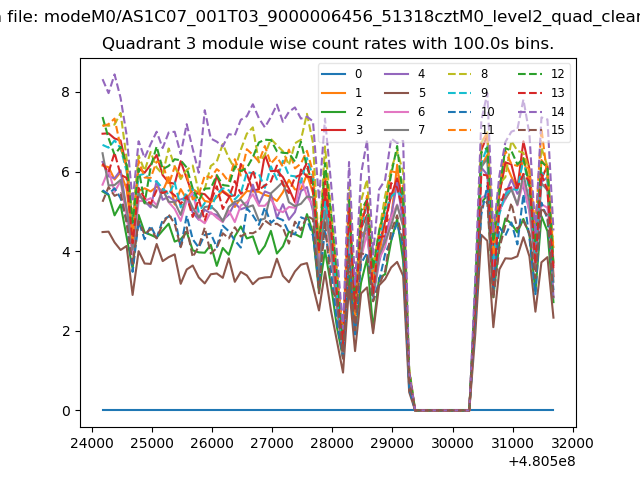
| Module-wise count rates for Quadrant C Data is divided into 100 sec bins |
 |
 |
| Module-wise count rates for Quadrant D Data is divided into 100 sec bins |
 |
 |
| Parameter | Plot |
|---|---|
| CZT HV Monitor | 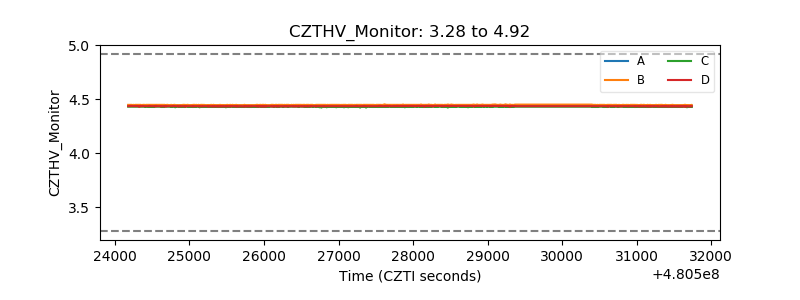 |
| D_VDD | 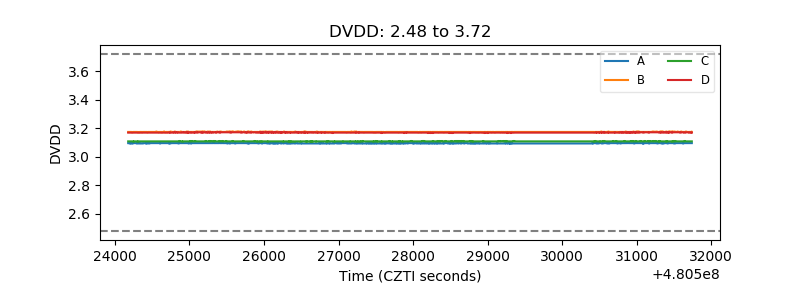 |
| Temperature 1 | 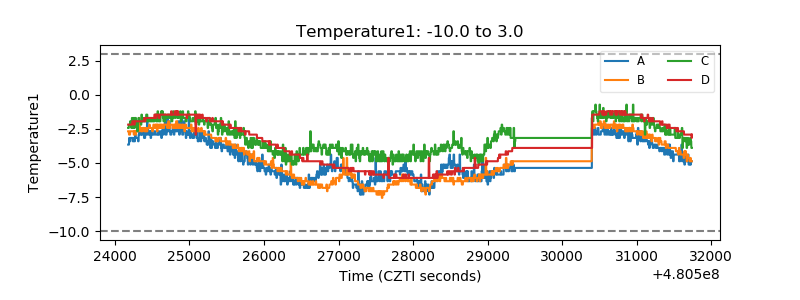 |
| Veto HV Monitor | 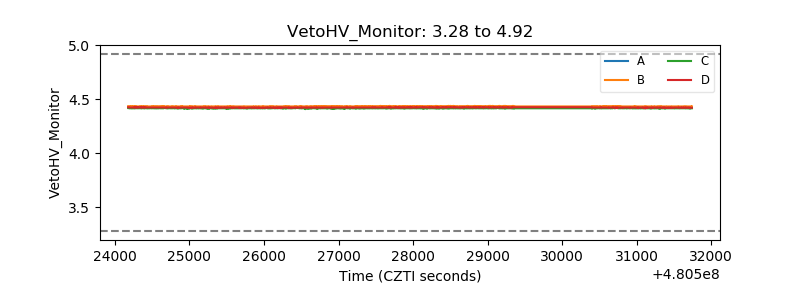 |
| Veto LLD | 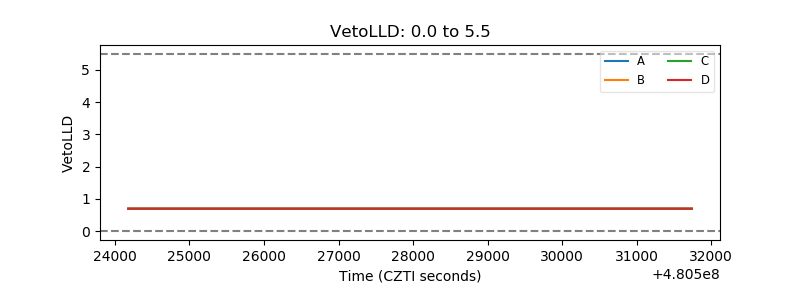 |
| Alpha Counter | 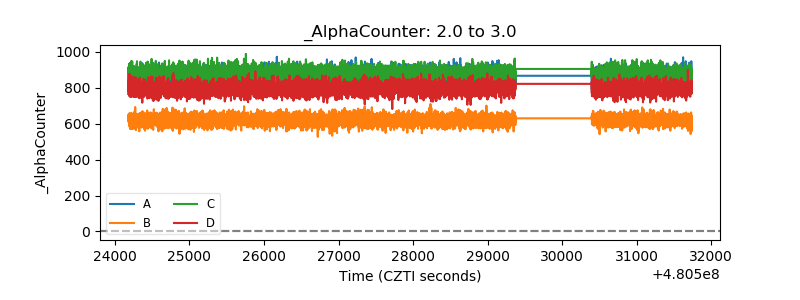 |
| _CPM_Rate | 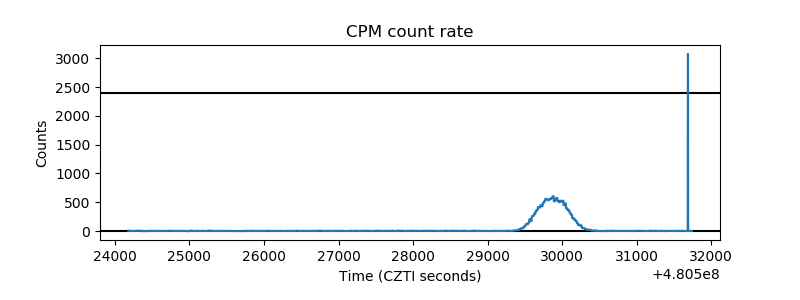 |
| CZT Counter | 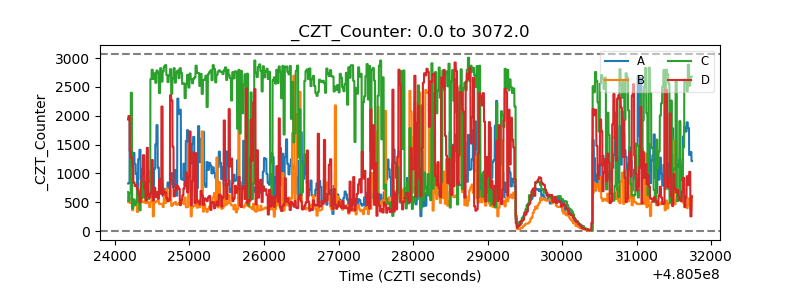 |
| +2.5 Volts monitor | 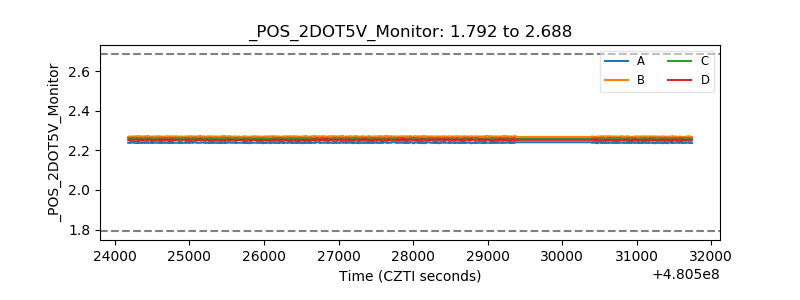 |
| +5 Volts monitor | 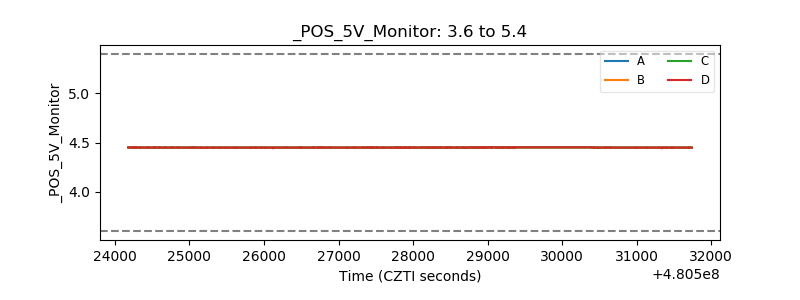 |
| _ROLL_ROT | 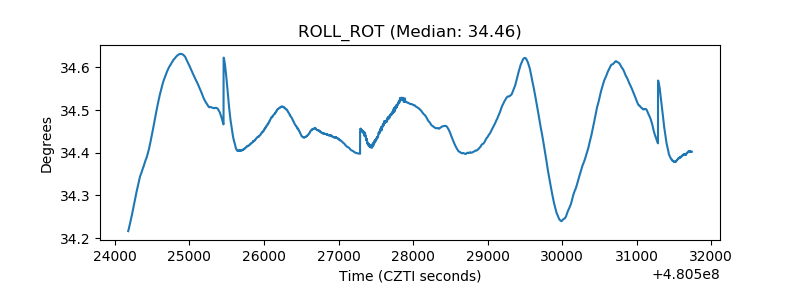 |
| _Roll_DEC | 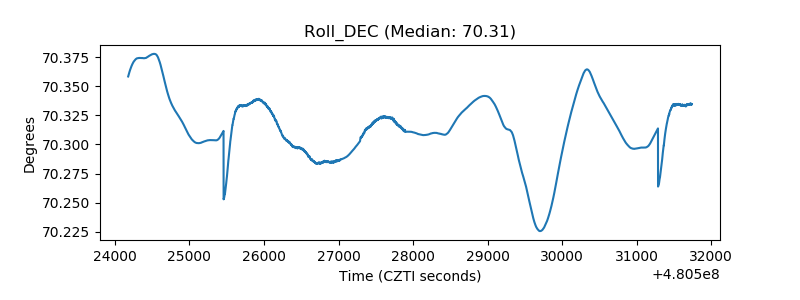 |
| _Roll_RA | 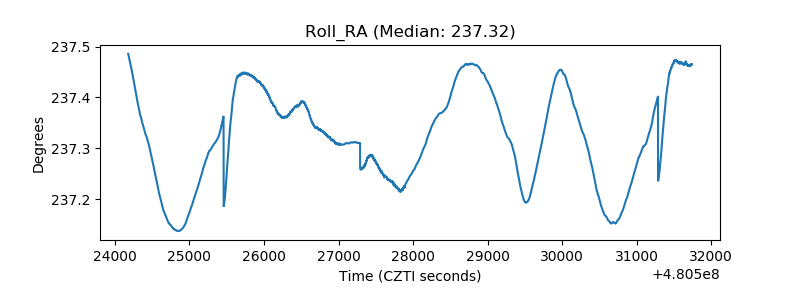 |
| Veto Counter | 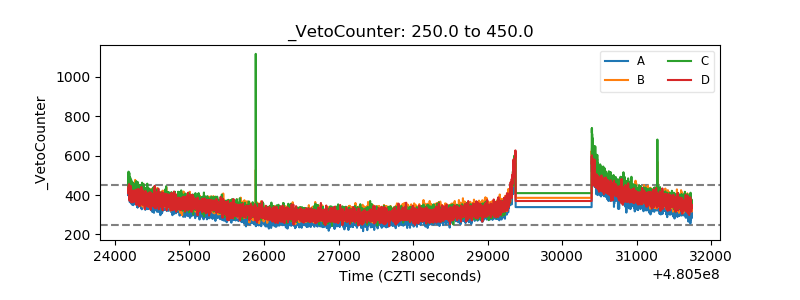 |