| Param | Original file | Final file |
|---|---|---|
| Filename | modeM0/AS1C07_001T03_9000006456_51319cztM0_level2.fits | modeM0/AS1C07_001T03_9000006456_51319cztM0_level2_quad_clean.evt |
| Size (bytes) | 731,214,720 | 86,063,040 |
| Size | 697.3 MB | 82.1 MB |
| Events in quadrant A | 6,470,452 | 593,312 |
| Events in quadrant B | 4,445,871 | 650,679 |
| Events in quadrant C | 9,203,147 | 404,641 |
| Events in quadrant D | 6,452,207 | 510,026 |
| Mode SS | |||
|---|---|---|---|
| Quadrant | BADHDUFLAG | Total packets | Discarded packets |
| A | 0 | 130 | 0 |
| B | 0 | 130 | 0 |
| C | 0 | 130 | 0 |
| D | 0 | 130 | 0 |
| Mode M0 | |||
|---|---|---|---|
| Quadrant | BADHDUFLAG | Total packets | Discarded packets |
| A | 0 | 23817 | 2 |
| B | 0 | 17623 | 2 |
| C | 0 | 31795 | 2 |
| D | 0 | 23677 | 2 |
| Mode M9 | |||
|---|---|---|---|
| Quadrant | BADHDUFLAG | Total packets | Discarded packets |
| A | 0 | 16 | 0 |
| B | 0 | 17 | 0 |
| C | 0 | 17 | 0 |
| D | 0 | 17 | 0 |
| Quadrant | Total seconds | Saturated seconds | Saturation percentage |
|---|---|---|---|
| A | 6407 | 424 | 6.617762% |
| B | 6407 | 433 | 6.758233% |
| C | 6407 | 2323 | 36.257219% |
| D | 6407 | 856 | 13.360387% |
Noise dominated data is calculated using 1-second bins in cleaned event files. If a bin has >2000 counts, and if more than 50% of those come from <1% of pixels, then it is considered to be noise-dominated and hence unusable.
| Quadrant | # 1 sec bins | Bins with >0 counts | Bins with >2000 counts | High rate bins dominated by noise | Noise dominated (total time) | Noise dominated (detector-on time) | Marked lightcurve |
|---|---|---|---|---|---|---|---|
| A | 7548 | 6409 | 275 | 275 | 3.64% | 4.29% | 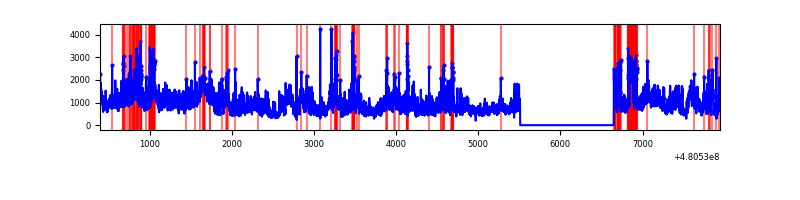 |
| B | 7548 | 6409 | 255 | 255 | 3.38% | 3.98% | 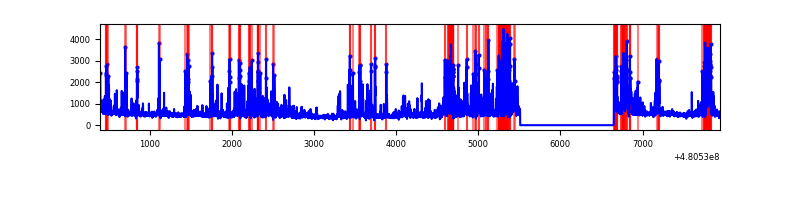 |
| C | 7548 | 6409 | 2118 | 2118 | 28.06% | 33.05% | 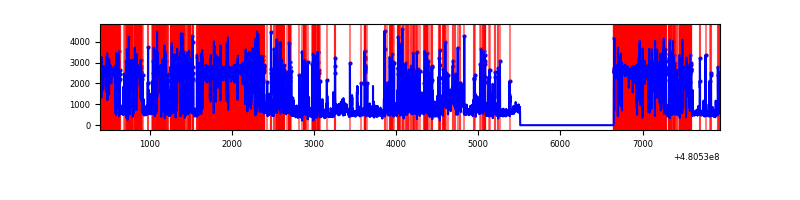 |
| D | 7548 | 6409 | 690 | 690 | 9.14% | 10.77% | 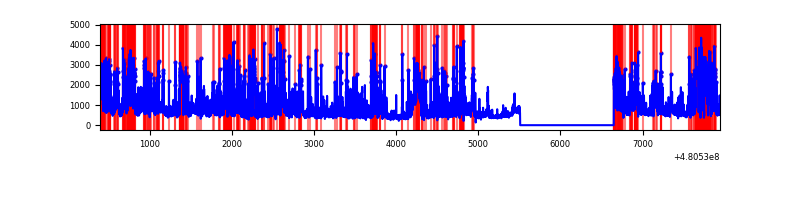 |
Top three noisy pixels from each quadrant. If the there are fewer than three noisy pixels in the level2.evt file, extra rows are filled as -1
| Pixel properties | Quadrant properties | ||||||
|---|---|---|---|---|---|---|---|
| Quadrant | DetID | PixID | Counts | Sigma | Mean | Median | Sigma |
| A | 12 | 3 | 2302315 | 13894.62 | 670 | 653 | 165.7 |
| A | 4 | 175 | 292090 | 1759.34 | 670 | 653 | 165.7 |
| A | 12 | 194 | 269155 | 1620.88 | 670 | 653 | 165.7 |
| B | 5 | 185 | 676040 | 4730.91 | 674 | 651 | 142.8 |
| B | 8 | 128 | 348970 | 2439.87 | 674 | 651 | 142.8 |
| B | 10 | 247 | 201877 | 1409.53 | 674 | 651 | 142.8 |
| C | 4 | 12 | 5647550 | 39665.74 | 510 | 506 | 142.4 |
| C | 3 | 233 | 557467 | 3912.18 | 510 | 506 | 142.4 |
| C | 15 | 1 | 212172 | 1486.78 | 510 | 506 | 142.4 |
| D | 11 | 245 | 857149 | 4888.99 | 632 | 611 | 175.2 |
| D | 12 | 128 | 562974 | 3209.88 | 632 | 611 | 175.2 |
| D | 7 | 80 | 452506 | 2579.35 | 632 | 611 | 175.2 |
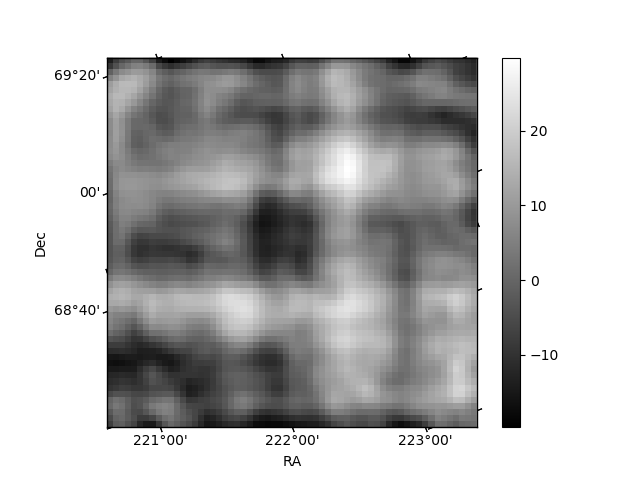
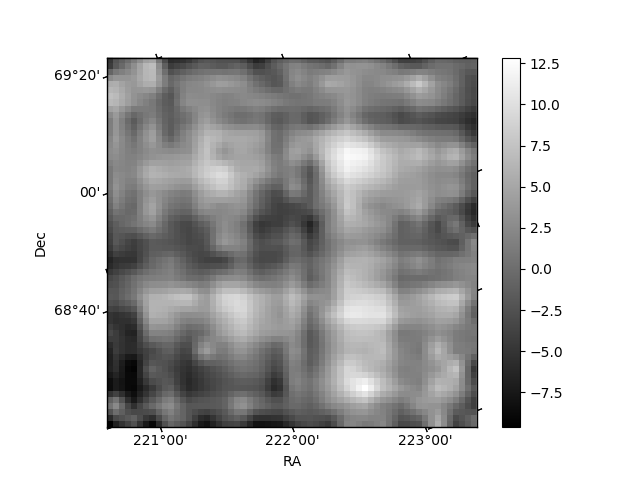
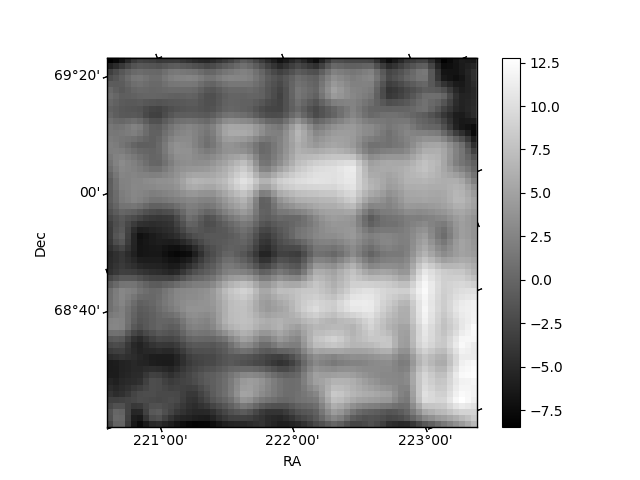
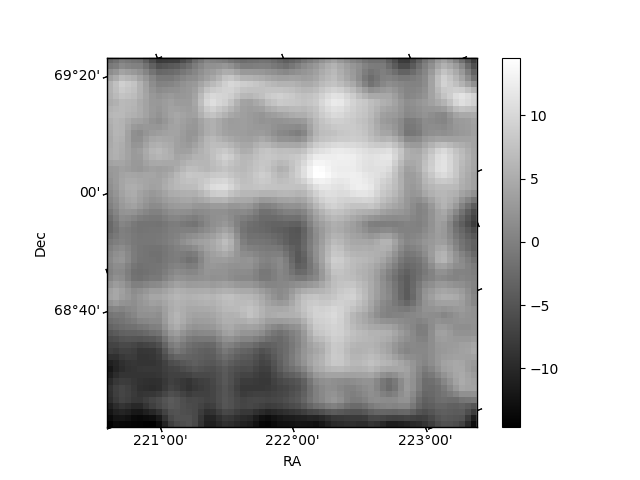
Histogram calculated using DETX and DETY for each event in the final _common_clean file
| Quadrant A | 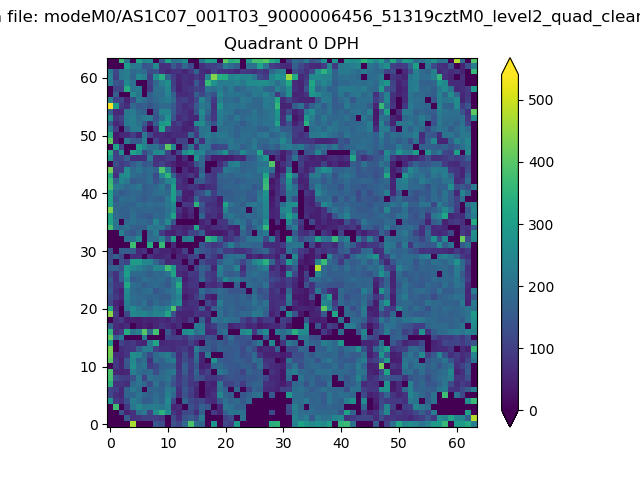 |
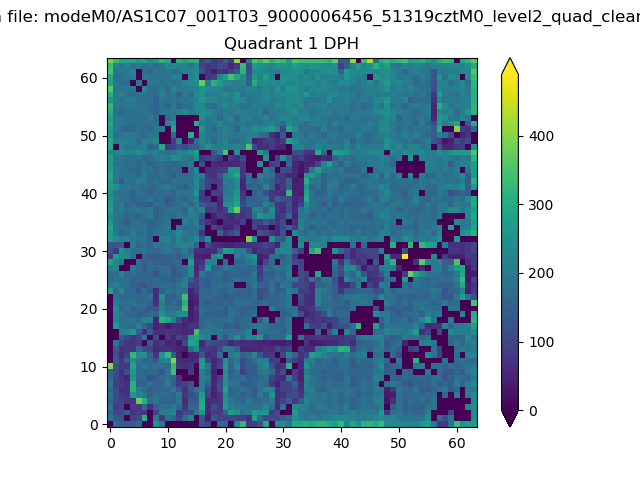 |
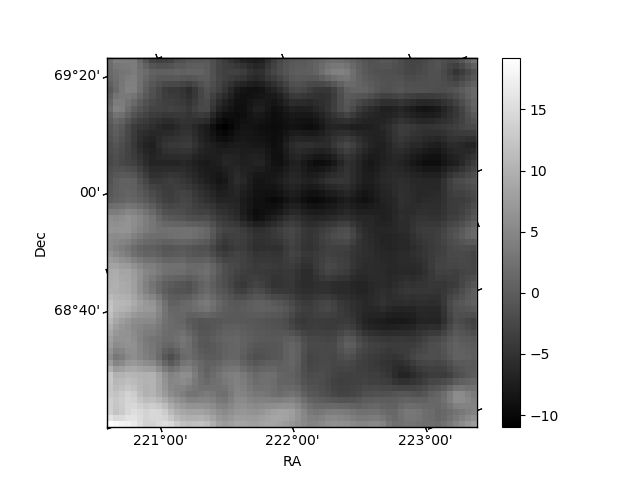
Quadrant B |
|---|---|---|---|
| Quadrant D | 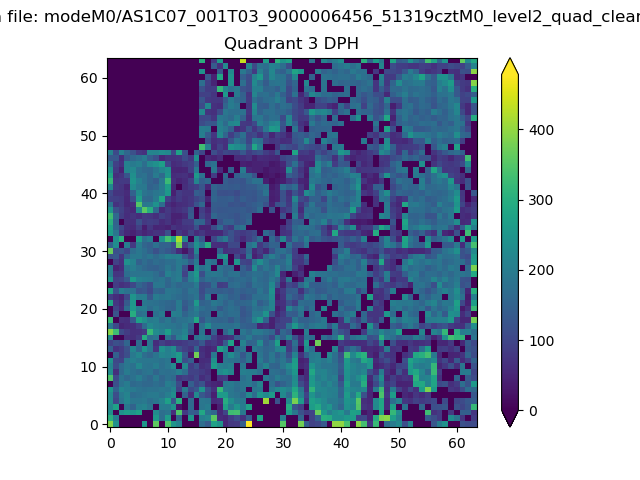 |
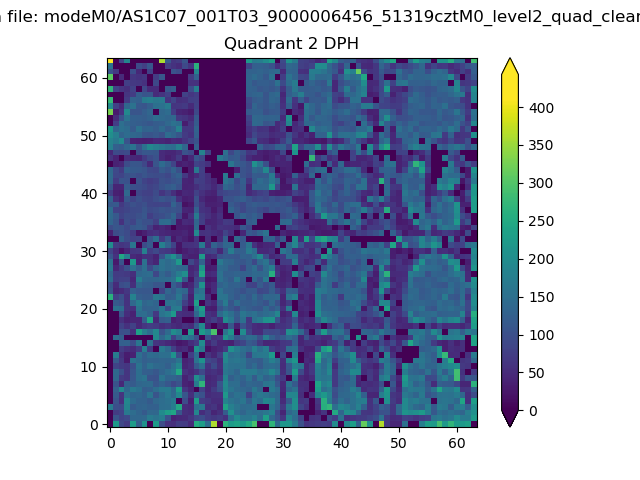 |
Quadrant C |
| Plot type | Count rate plots | Images |
|---|---|---|
| Comparison with Poisson distribution Blue bars denote a histogram of data divided into 1 sec bins. Red curve is a Poisson curve with rate = median count rate of data. |
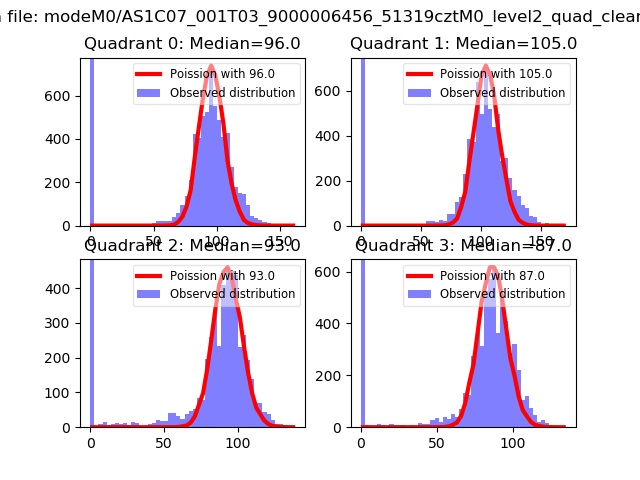 |
 |
| Quadrant-wise count rates Data is divided into 100 sec bins |
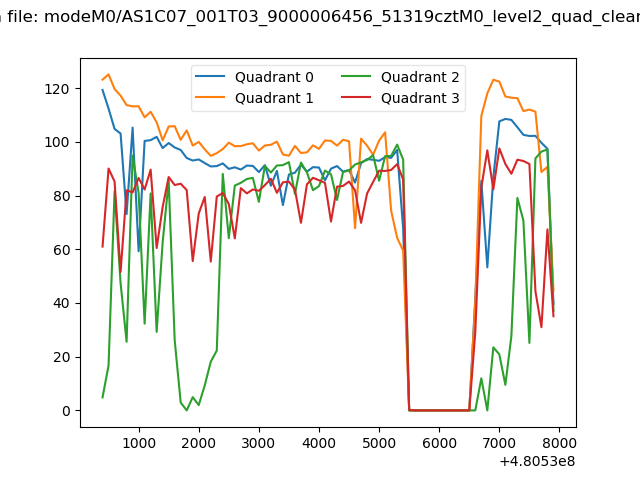 |
|
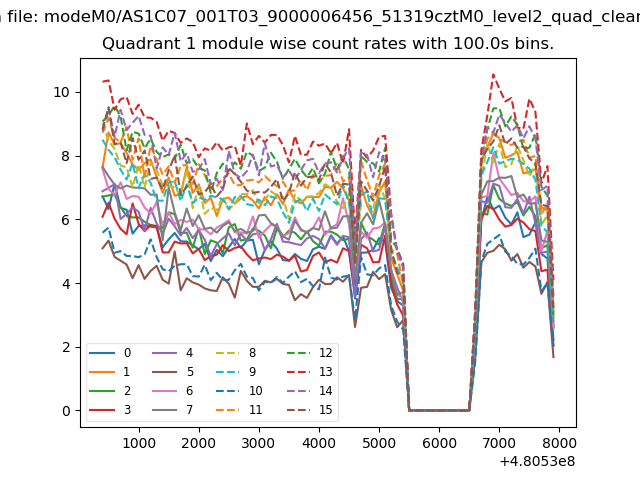
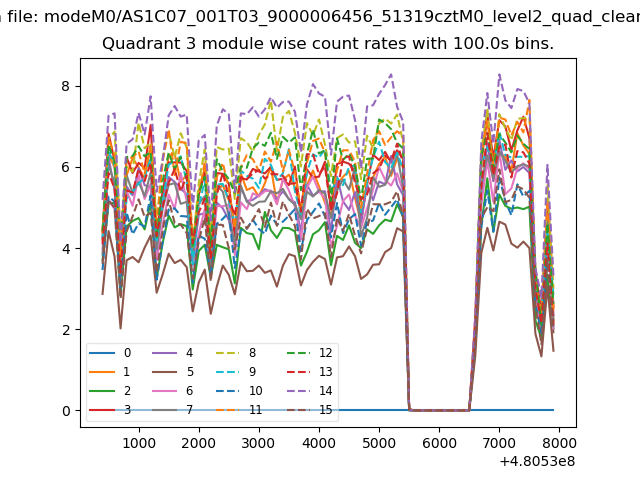
| Module-wise count rates for Quadrant A Data is divided into 100 sec bins |
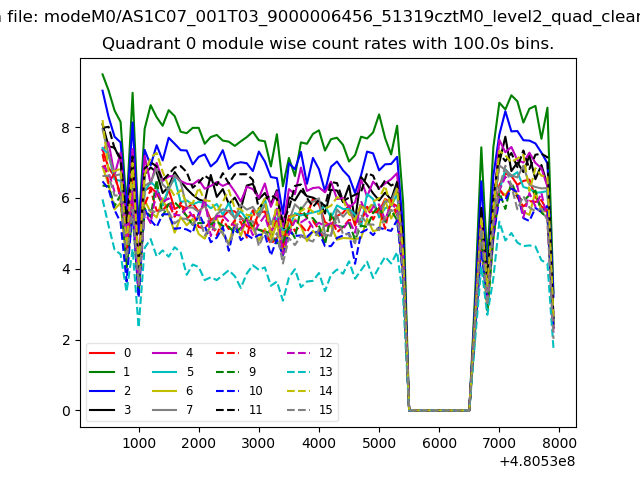 |
 |
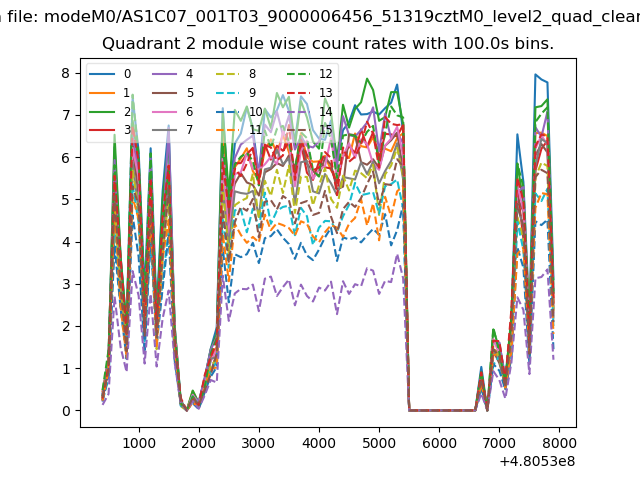
| Module-wise count rates for Quadrant B Data is divided into 100 sec bins |
 |
 |
| Module-wise count rates for Quadrant C Data is divided into 100 sec bins |
 |
 |
| Module-wise count rates for Quadrant D Data is divided into 100 sec bins |
 |
 |
| Parameter | Plot |
|---|---|
| CZT HV Monitor | 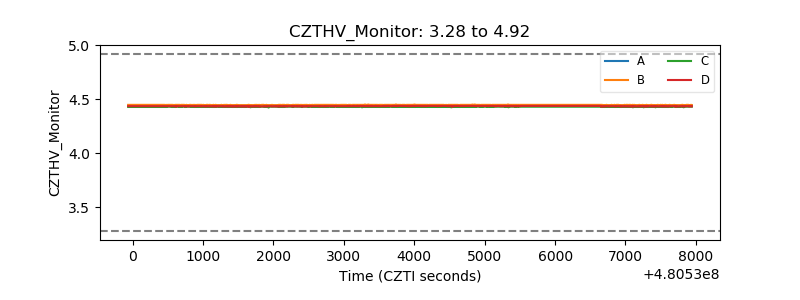 |
| D_VDD | 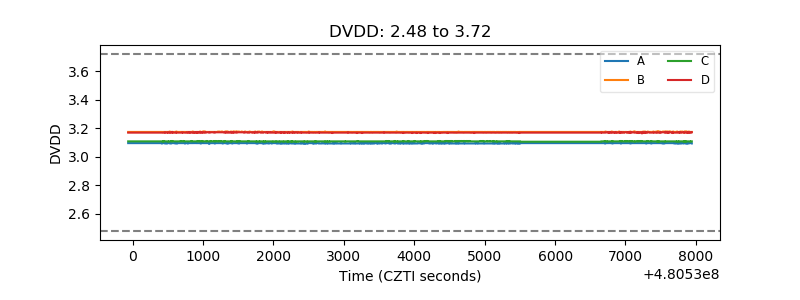 |
| Temperature 1 | 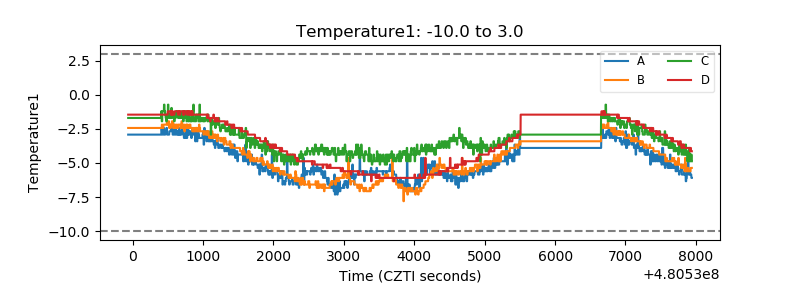 |
| Veto HV Monitor | 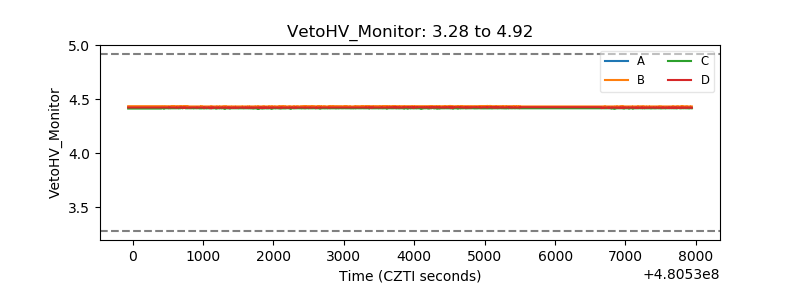 |
| Veto LLD | 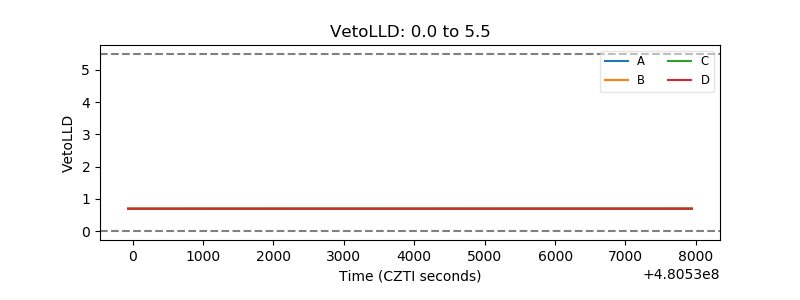 |
| Alpha Counter | 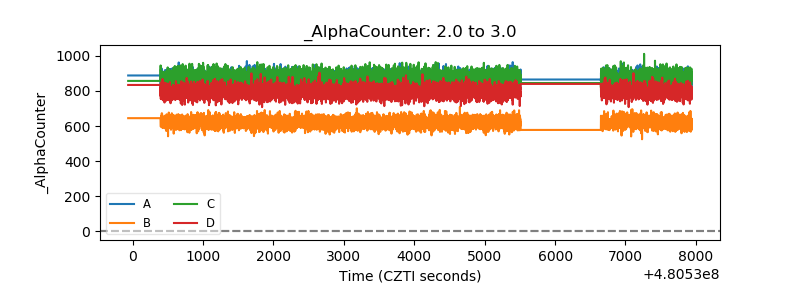 |
| _CPM_Rate | 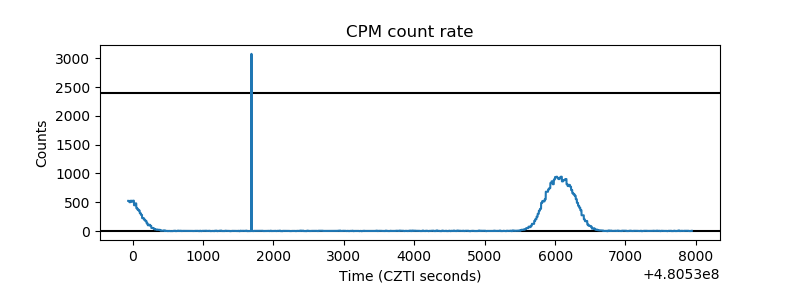 |
| CZT Counter | 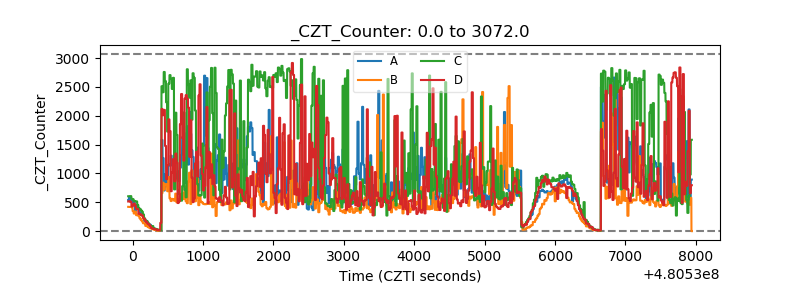 |
| +2.5 Volts monitor | 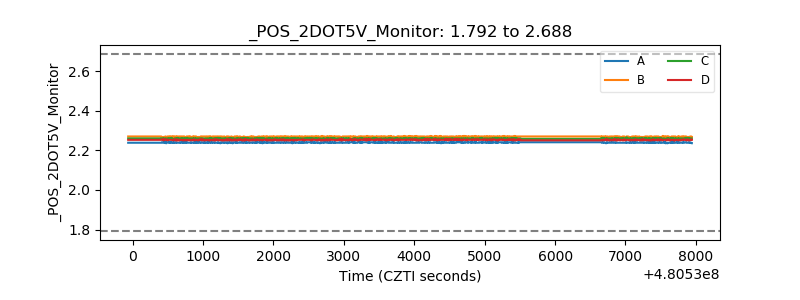 |
| +5 Volts monitor | 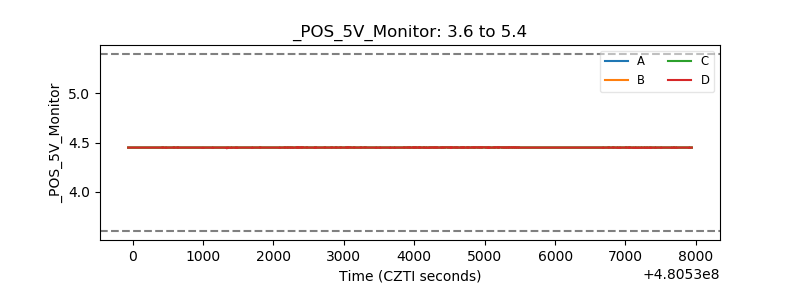 |
| _ROLL_ROT | 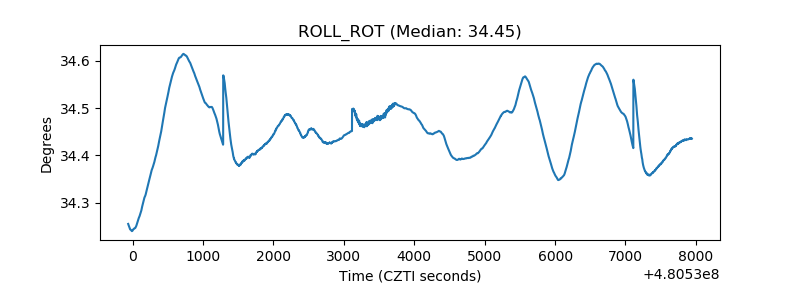 |
| _Roll_DEC | 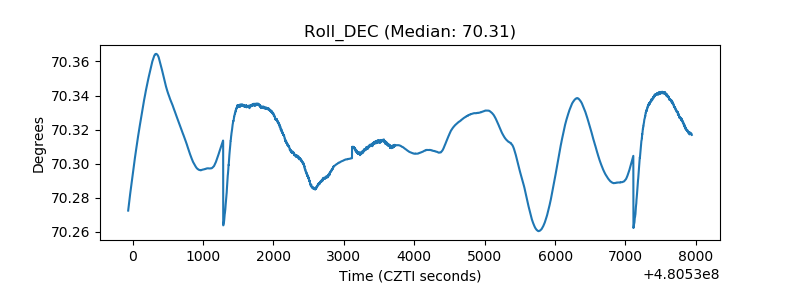 |
| _Roll_RA | 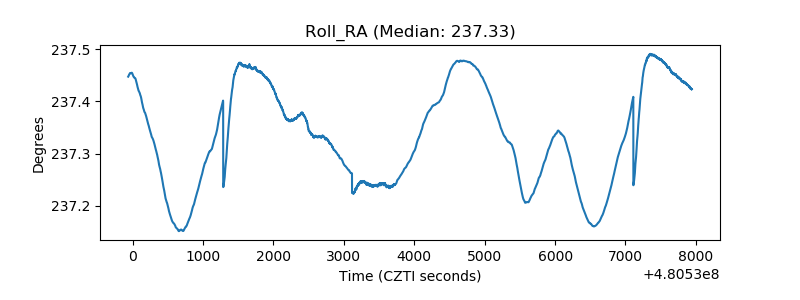 |
| Veto Counter | 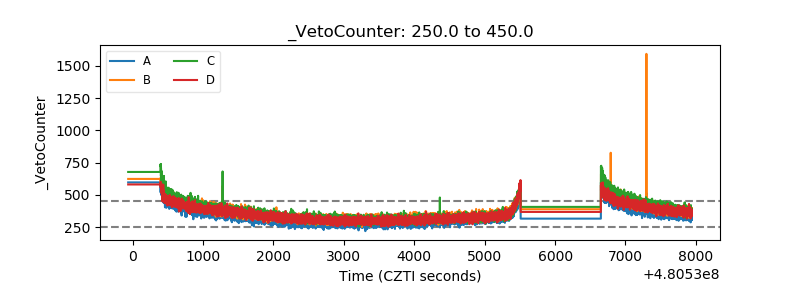 |