| Param | Original file | Final file |
|---|---|---|
| Filename | modeM0/AS1C07_001T03_9000006456_51320cztM0_level2.fits | modeM0/AS1C07_001T03_9000006456_51320cztM0_level2_quad_clean.evt |
| Size (bytes) | 795,677,760 | 82,166,400 |
| Size | 758.8 MB | 78.4 MB |
| Events in quadrant A | 6,029,626 | 588,071 |
| Events in quadrant B | 4,558,976 | 660,706 |
| Events in quadrant C | 11,713,834 | 294,833 |
| Events in quadrant D | 6,665,606 | 505,866 |
| Mode SS | |||
|---|---|---|---|
| Quadrant | BADHDUFLAG | Total packets | Discarded packets |
| A | 0 | 128 | 0 |
| B | 0 | 128 | 0 |
| C | 0 | 128 | 0 |
| D | 0 | 128 | 0 |
| Mode M0 | |||
|---|---|---|---|
| Quadrant | BADHDUFLAG | Total packets | Discarded packets |
| A | 0 | 22384 | 6 |
| B | 0 | 17774 | 2 |
| C | 0 | 39067 | 2 |
| D | 0 | 24352 | 2 |
| Mode M9 | |||
|---|---|---|---|
| Quadrant | BADHDUFLAG | Total packets | Discarded packets |
| A | 0 | 12 | 0 |
| B | 0 | 12 | 0 |
| C | 0 | 12 | 0 |
| D | 0 | 12 | 0 |
| Quadrant | Total seconds | Saturated seconds | Saturation percentage |
|---|---|---|---|
| A | 6278 | 412 | 6.562600% |
| B | 6278 | 320 | 5.097165% |
| C | 6278 | 3562 | 56.737815% |
| D | 6278 | 919 | 14.638420% |
Noise dominated data is calculated using 1-second bins in cleaned event files. If a bin has >2000 counts, and if more than 50% of those come from <1% of pixels, then it is considered to be noise-dominated and hence unusable.
| Quadrant | # 1 sec bins | Bins with >0 counts | Bins with >2000 counts | High rate bins dominated by noise | Noise dominated (total time) | Noise dominated (detector-on time) | Marked lightcurve |
|---|---|---|---|---|---|---|---|
| A | 7443 | 6279 | 324 | 324 | 4.35% | 5.16% | 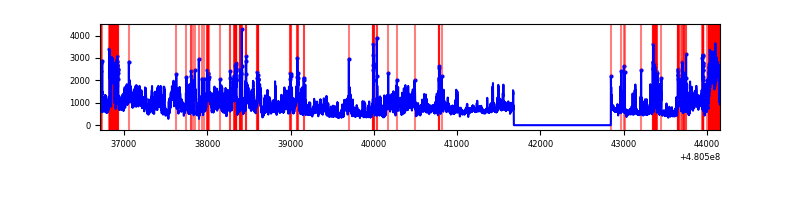 |
| B | 7443 | 6279 | 166 | 166 | 2.23% | 2.64% | 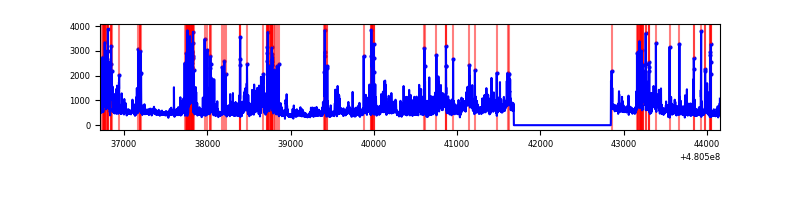 |
| C | 7443 | 6278 | 3190 | 3190 | 42.86% | 50.81% | 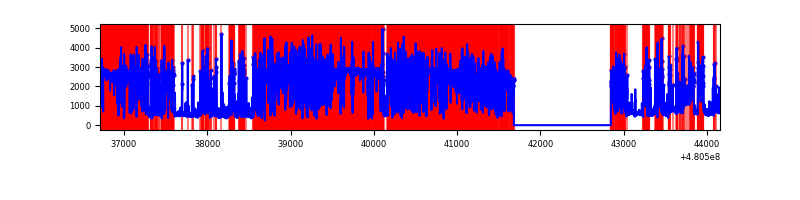 |
| D | 7443 | 6278 | 812 | 812 | 10.91% | 12.93% | 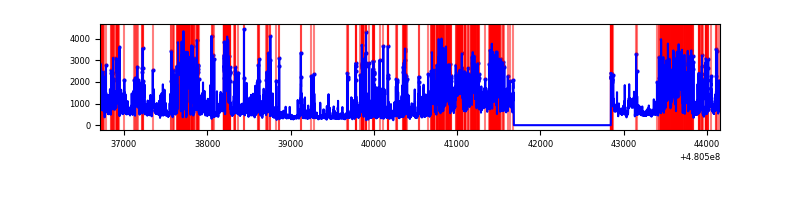 |
Top three noisy pixels from each quadrant. If the there are fewer than three noisy pixels in the level2.evt file, extra rows are filled as -1
| Pixel properties | Quadrant properties | ||||||
|---|---|---|---|---|---|---|---|
| Quadrant | DetID | PixID | Counts | Sigma | Mean | Median | Sigma |
| A | 12 | 3 | 2102268 | 12930.54 | 657 | 641 | 162.5 |
| A | 7 | 235 | 285940 | 1755.34 | 657 | 641 | 162.5 |
| A | 4 | 175 | 257831 | 1582.39 | 657 | 641 | 162.5 |
| B | 8 | 128 | 337919 | 2386.28 | 668 | 645 | 141.3 |
| B | 5 | 185 | 320726 | 2264.63 | 668 | 645 | 141.3 |
| B | 10 | 254 | 295958 | 2089.4 | 668 | 645 | 141.3 |
| C | 4 | 12 | 7136549 | 58885.94 | 438 | 434 | 121.2 |
| C | 15 | 1 | 1493186 | 12317.92 | 438 | 434 | 121.2 |
| C | 15 | 158 | 538977 | 4443.96 | 438 | 434 | 121.2 |
| D | 11 | 176 | 1424087 | 8250.59 | 623 | 600 | 172.5 |
| D | 2 | 216 | 727075 | 4210.68 | 623 | 600 | 172.5 |
| D | 7 | 80 | 656765 | 3803.16 | 623 | 600 | 172.5 |
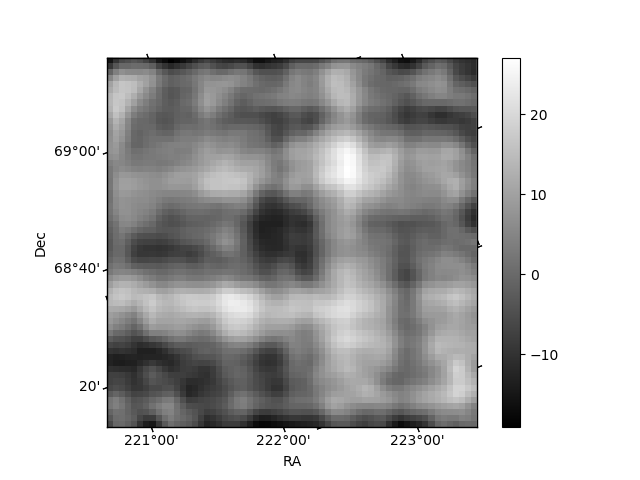
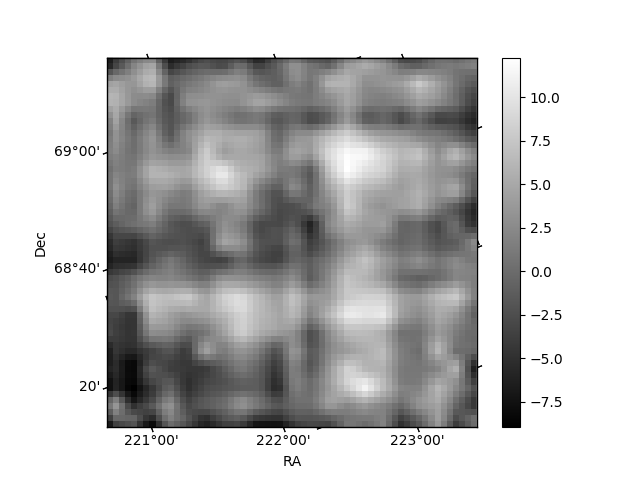
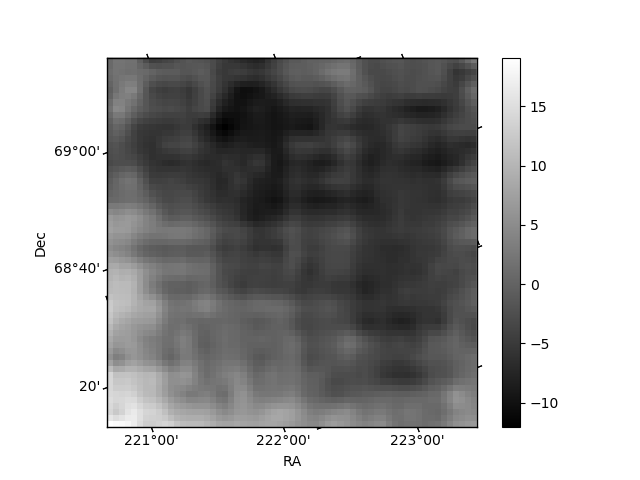
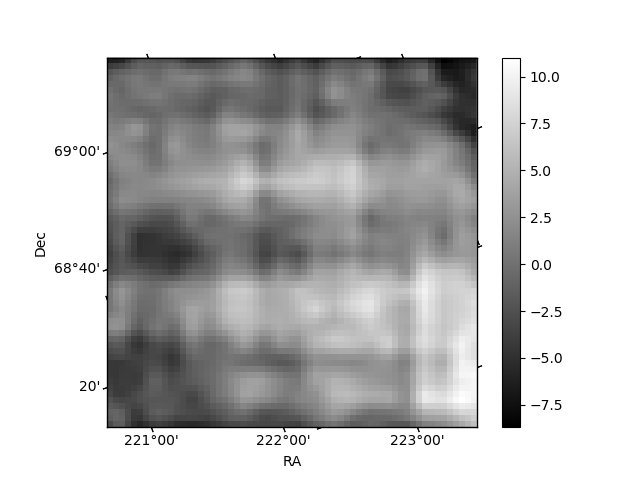
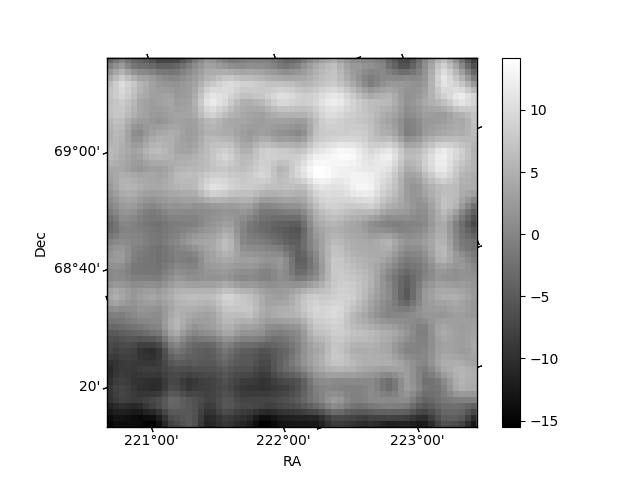
Histogram calculated using DETX and DETY for each event in the final _common_clean file
| Quadrant A | 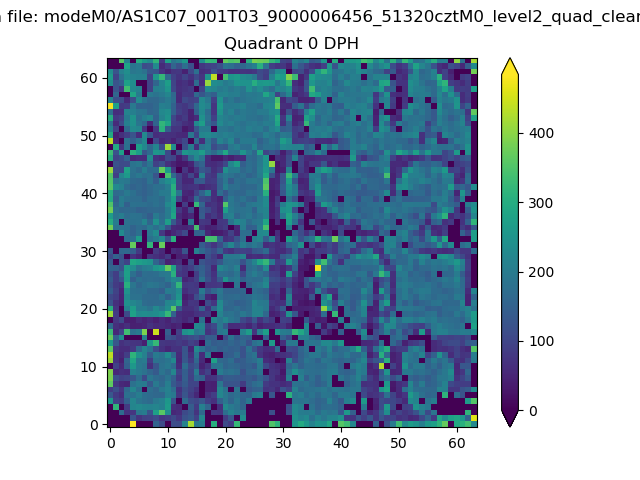 |
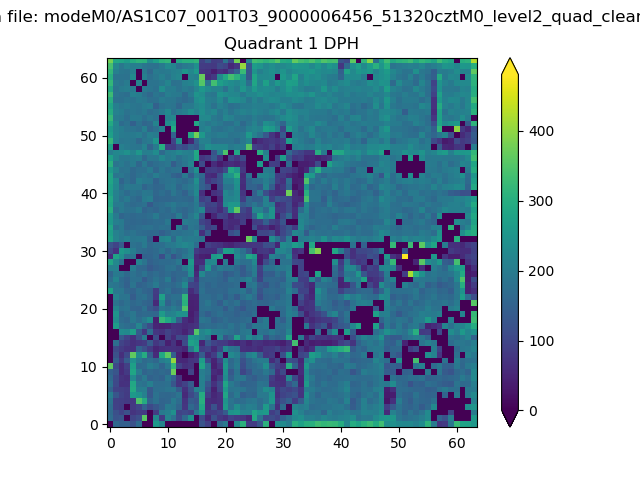 |
Quadrant B |
|---|---|---|---|
| Quadrant D | 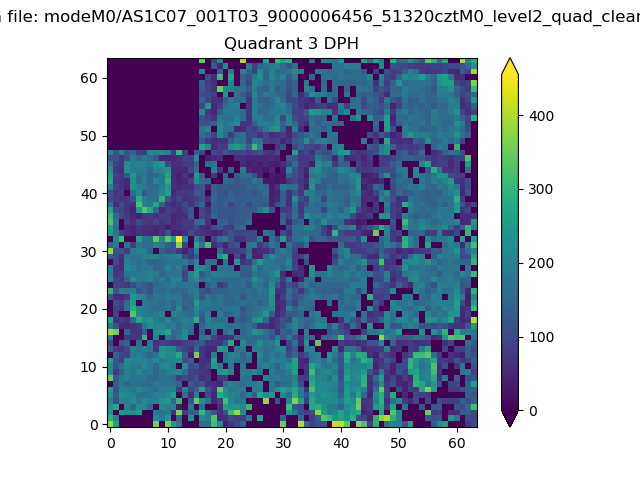 |
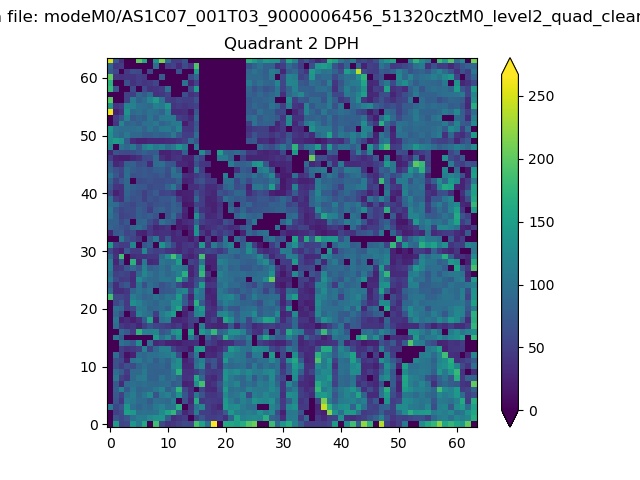 |
Quadrant C |
| Plot type | Count rate plots | Images |
|---|---|---|
| Comparison with Poisson distribution Blue bars denote a histogram of data divided into 1 sec bins. Red curve is a Poisson curve with rate = median count rate of data. |
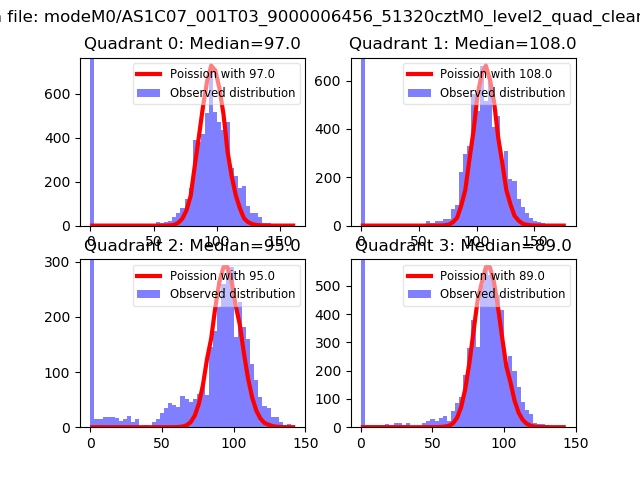 |
 |
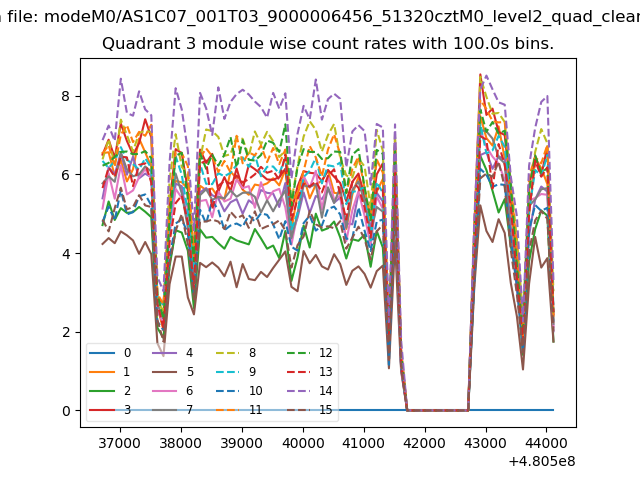
| Quadrant-wise count rates Data is divided into 100 sec bins |
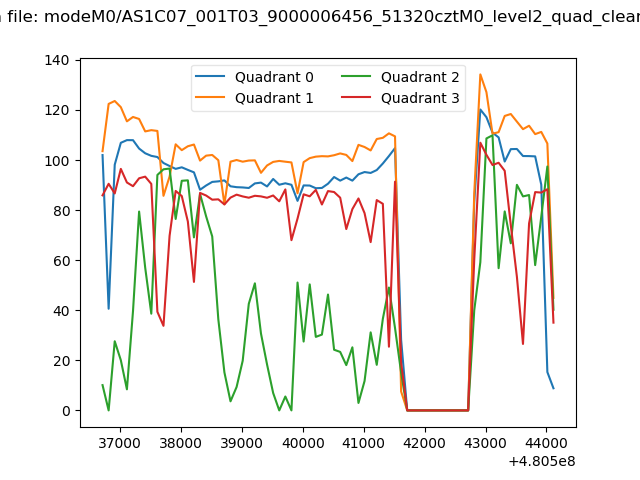 |
|
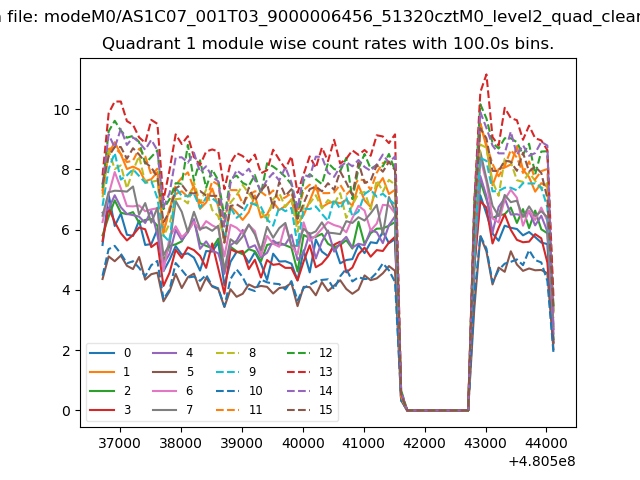
| Module-wise count rates for Quadrant A Data is divided into 100 sec bins |
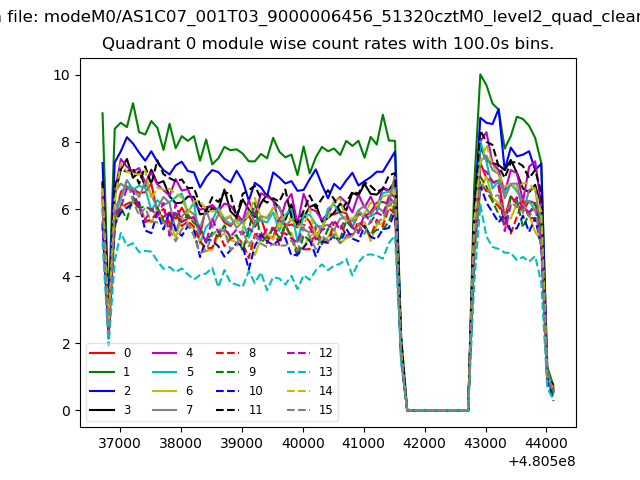 |
 |
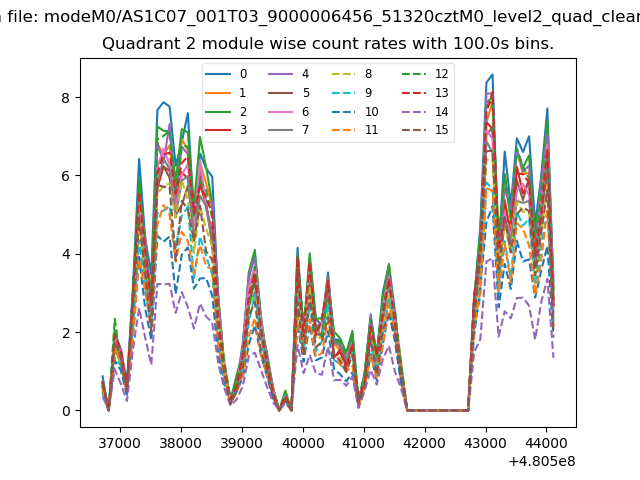
| Module-wise count rates for Quadrant B Data is divided into 100 sec bins |
 |
 |
| Module-wise count rates for Quadrant C Data is divided into 100 sec bins |
 |
 |
| Module-wise count rates for Quadrant D Data is divided into 100 sec bins |
 |
 |
| Parameter | Plot |
|---|---|
| CZT HV Monitor |  |
| D_VDD | 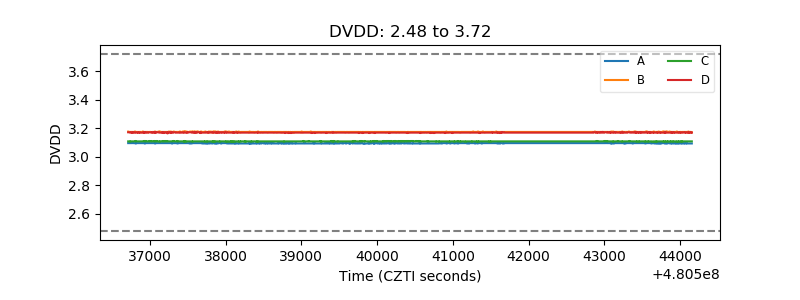 |
| Temperature 1 | 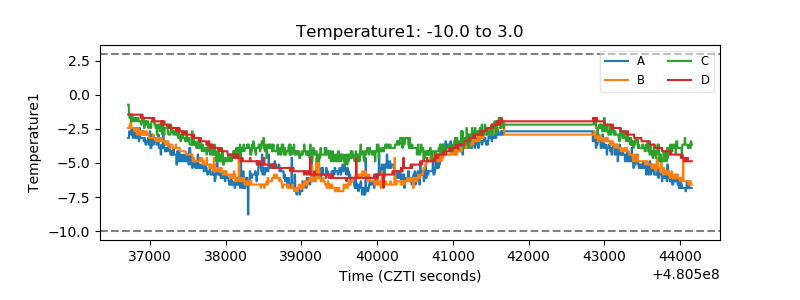 |
| Veto HV Monitor | 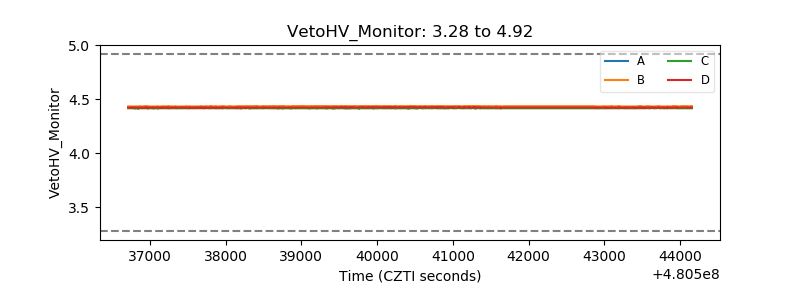 |
| Veto LLD | 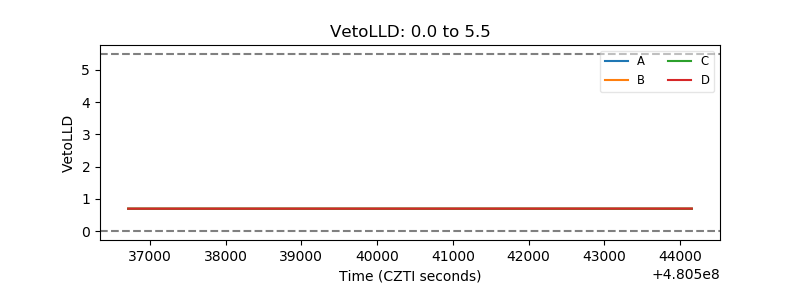 |
| Alpha Counter | 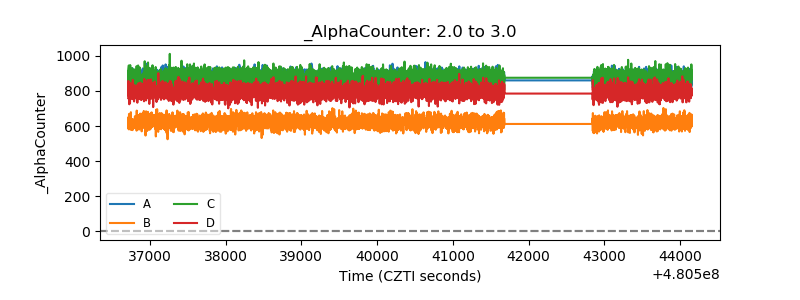 |
| _CPM_Rate | 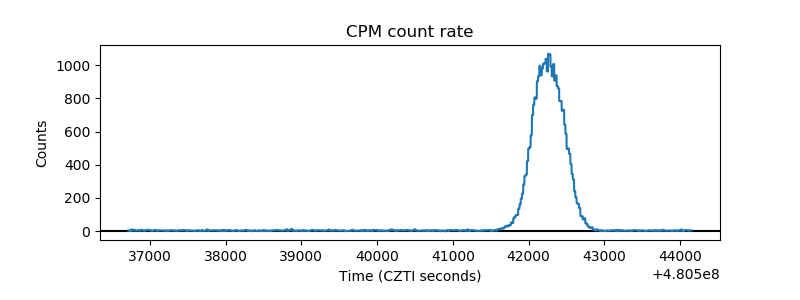 |
| CZT Counter | 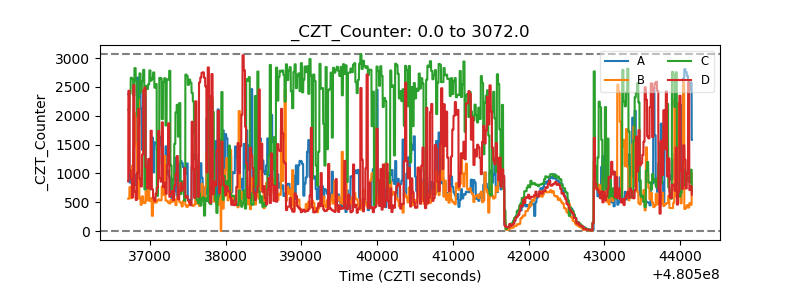 |
| +2.5 Volts monitor | 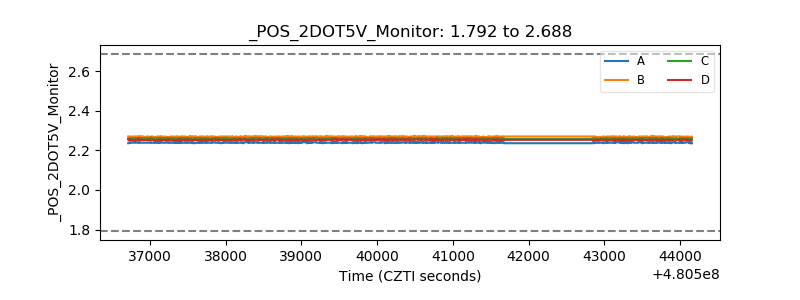 |
| +5 Volts monitor | 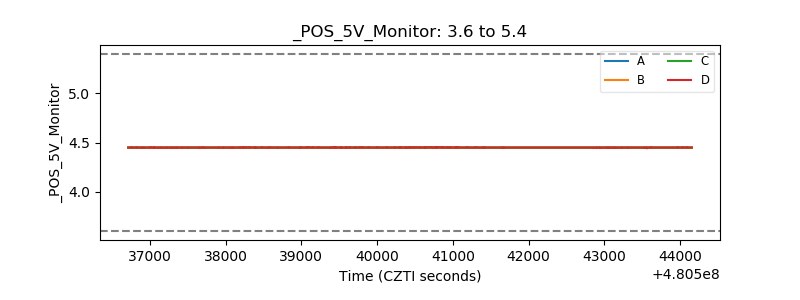 |
| _ROLL_ROT | 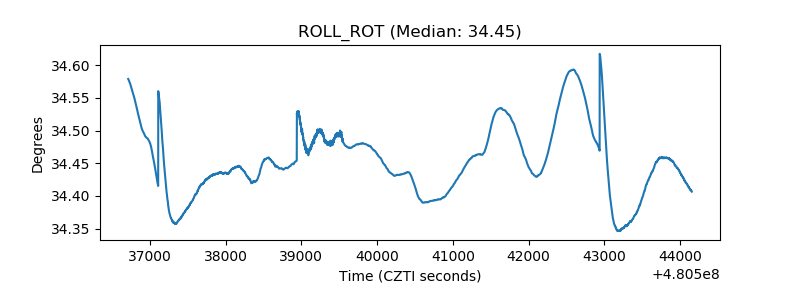 |
| _Roll_DEC | 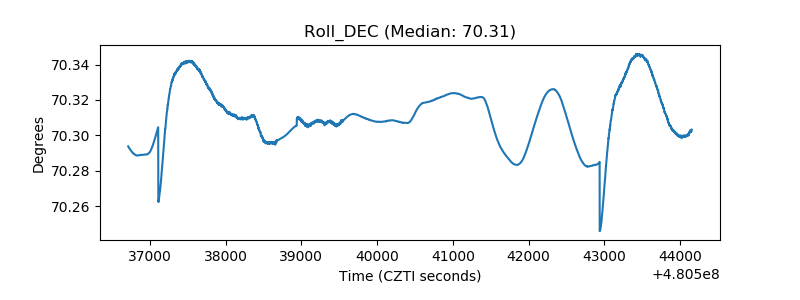 |
| _Roll_RA | 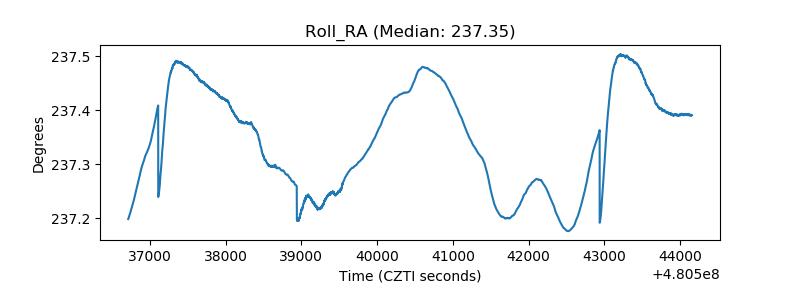 |
| Veto Counter | 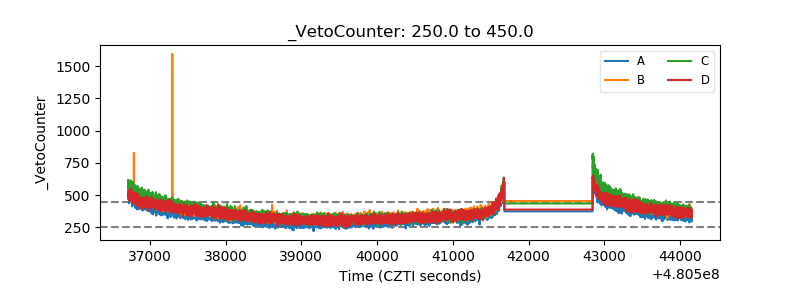 |