| Param | Original file | Final file |
|---|---|---|
| Filename | modeM0/AS1C07_001T03_9000006456_51321cztM0_level2.fits | modeM0/AS1C07_001T03_9000006456_51321cztM0_level2_quad_clean.evt |
| Size (bytes) | 794,969,280 | 87,917,760 |
| Size | 758.1 MB | 83.8 MB |
| Events in quadrant A | 6,802,337 | 600,894 |
| Events in quadrant B | 4,637,880 | 686,307 |
| Events in quadrant C | 10,792,700 | 384,013 |
| Events in quadrant D | 6,697,831 | 542,592 |
| Mode SS | |||
|---|---|---|---|
| Quadrant | BADHDUFLAG | Total packets | Discarded packets |
| A | 0 | 128 | 0 |
| B | 0 | 128 | 0 |
| C | 0 | 128 | 0 |
| D | 0 | 128 | 0 |
| Mode M0 | |||
|---|---|---|---|
| Quadrant | BADHDUFLAG | Total packets | Discarded packets |
| A | 0 | 24770 | 2 |
| B | 0 | 18274 | 2 |
| C | 0 | 36496 | 2 |
| D | 0 | 24402 | 2 |
| Mode M9 | |||
|---|---|---|---|
| Quadrant | BADHDUFLAG | Total packets | Discarded packets |
| A | 0 | 13 | 0 |
| B | 0 | 14 | 0 |
| C | 0 | 14 | 0 |
| D | 0 | 14 | 0 |
| Quadrant | Total seconds | Saturated seconds | Saturation percentage |
|---|---|---|---|
| A | 6430 | 501 | 7.791602% |
| B | 6430 | 271 | 4.214619% |
| C | 6430 | 2869 | 44.618974% |
| D | 6430 | 694 | 10.793157% |
Noise dominated data is calculated using 1-second bins in cleaned event files. If a bin has >2000 counts, and if more than 50% of those come from <1% of pixels, then it is considered to be noise-dominated and hence unusable.
| Quadrant | # 1 sec bins | Bins with >0 counts | Bins with >2000 counts | High rate bins dominated by noise | Noise dominated (total time) | Noise dominated (detector-on time) | Marked lightcurve |
|---|---|---|---|---|---|---|---|
| A | 7580 | 6431 | 386 | 386 | 5.09% | 6.00% | 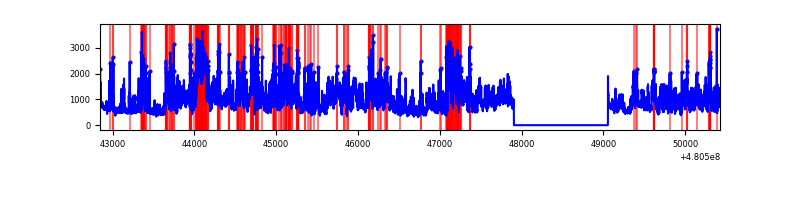 |
| B | 7580 | 6431 | 112 | 112 | 1.48% | 1.74% | 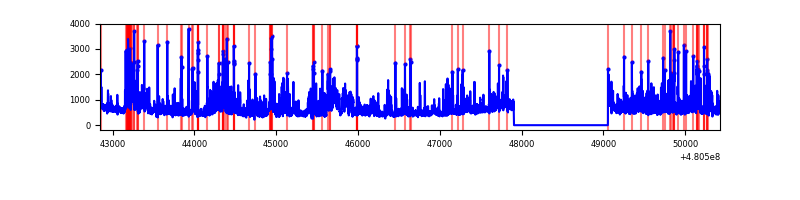 |
| C | 7580 | 6430 | 2708 | 2708 | 35.73% | 42.12% | 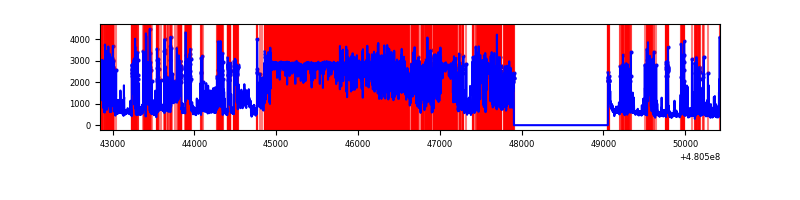 |
| D | 7580 | 6431 | 661 | 661 | 8.72% | 10.28% | 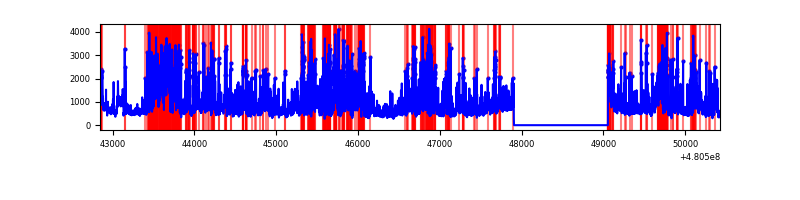 |
Top three noisy pixels from each quadrant. If the there are fewer than three noisy pixels in the level2.evt file, extra rows are filled as -1
| Pixel properties | Quadrant properties | ||||||
|---|---|---|---|---|---|---|---|
| Quadrant | DetID | PixID | Counts | Sigma | Mean | Median | Sigma |
| A | 12 | 3 | 2538992 | 15153.31 | 672 | 656 | 167.5 |
| A | 12 | 250 | 389860 | 2323.46 | 672 | 656 | 167.5 |
| A | 7 | 235 | 333003 | 1984.04 | 672 | 656 | 167.5 |
| B | 10 | 254 | 393154 | 2697.51 | 688 | 665 | 145.5 |
| B | 5 | 172 | 263861 | 1808.9 | 688 | 665 | 145.5 |
| B | 5 | 185 | 262691 | 1800.86 | 688 | 665 | 145.5 |
| C | 15 | 148 | 3608474 | 24905.82 | 529 | 525 | 144.9 |
| C | 4 | 12 | 3052199 | 21065.83 | 529 | 525 | 144.9 |
| C | 3 | 233 | 715815 | 4937.67 | 529 | 525 | 144.9 |
| D | 2 | 216 | 885360 | 4951.72 | 644 | 620 | 178.7 |
| D | 7 | 80 | 706542 | 3950.91 | 644 | 620 | 178.7 |
| D | 11 | 176 | 659558 | 3687.95 | 644 | 620 | 178.7 |
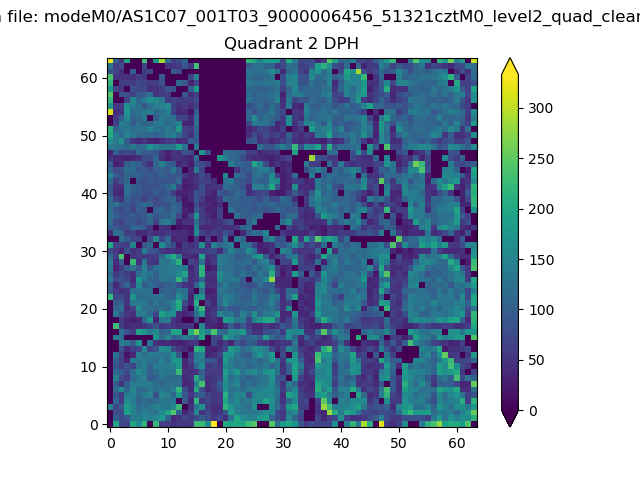
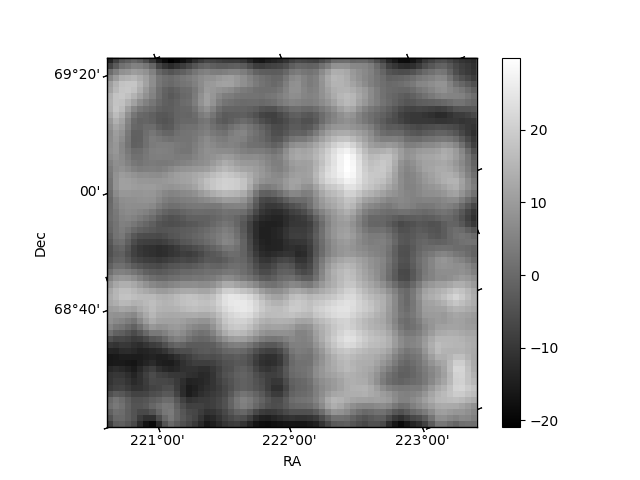
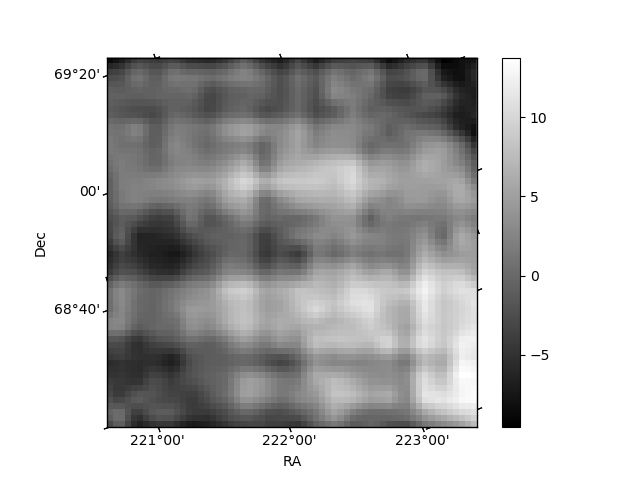
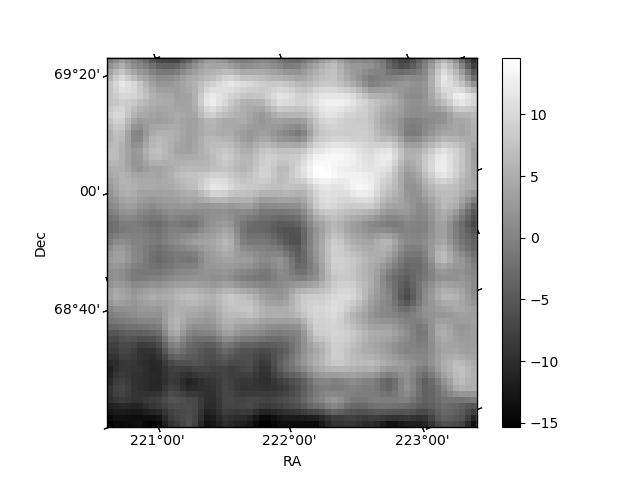
Histogram calculated using DETX and DETY for each event in the final _common_clean file
| Quadrant A | 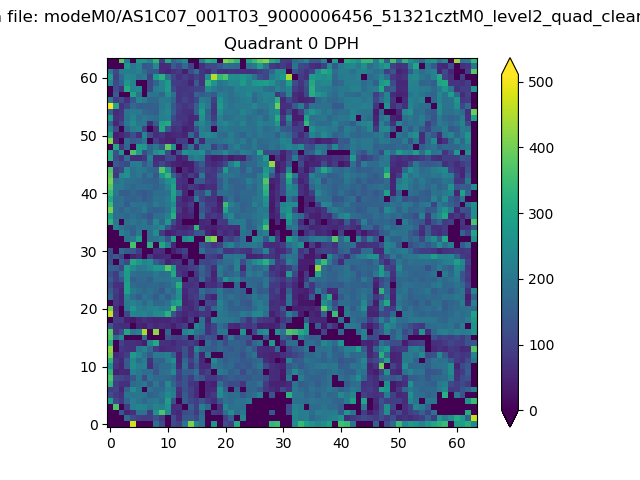 |
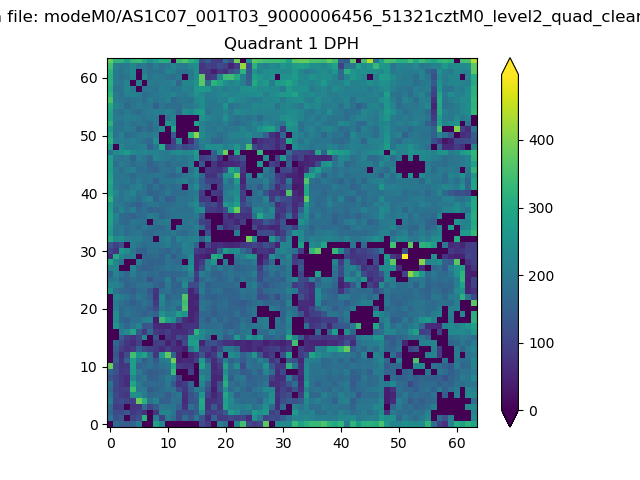 |
Quadrant B |
|---|---|---|---|
| Quadrant D | 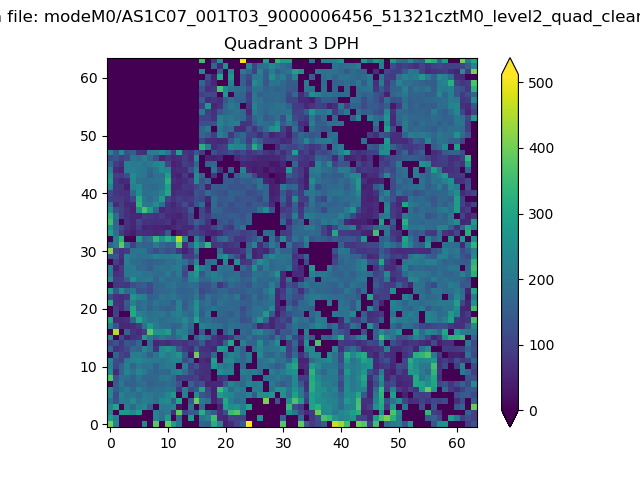 |
 |
Quadrant C |
| Plot type | Count rate plots | Images |
|---|---|---|
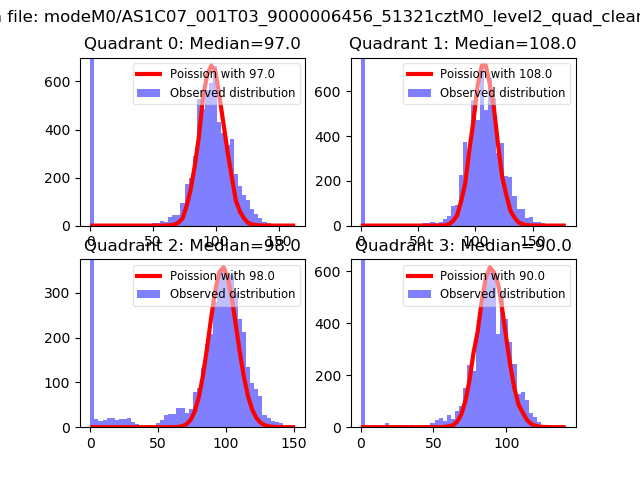
| Comparison with Poisson distribution Blue bars denote a histogram of data divided into 1 sec bins. Red curve is a Poisson curve with rate = median count rate of data. |
 |
 |
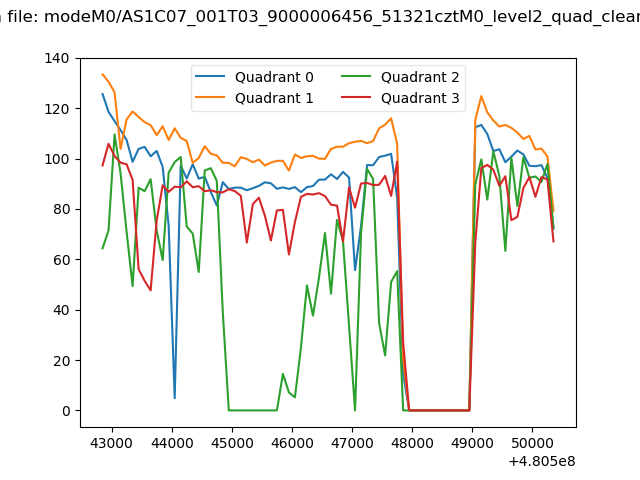
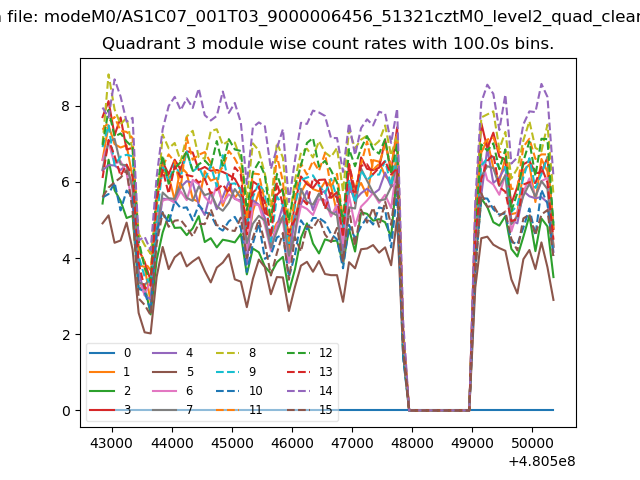
| Quadrant-wise count rates Data is divided into 100 sec bins |
 |
|
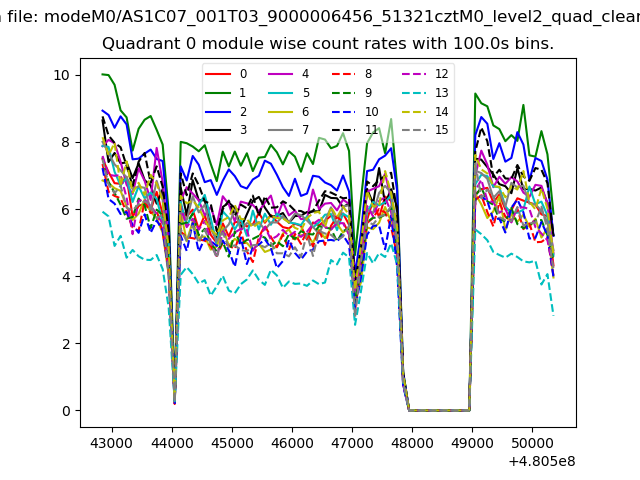
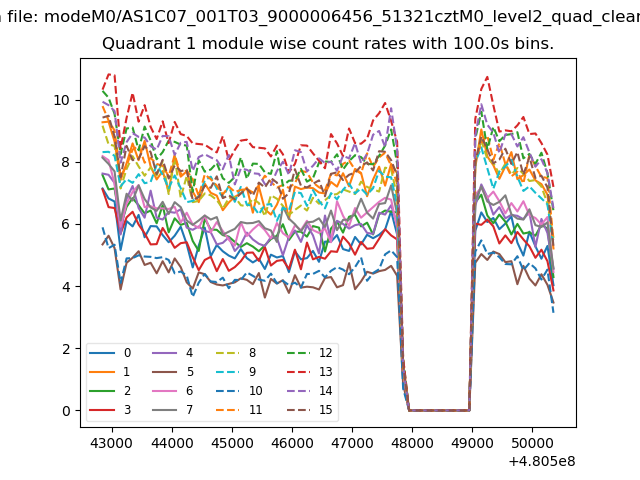
| Module-wise count rates for Quadrant A Data is divided into 100 sec bins |
 |
 |
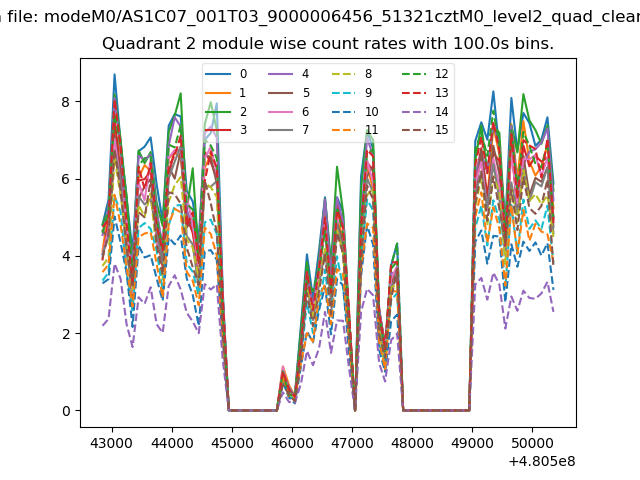
| Module-wise count rates for Quadrant B Data is divided into 100 sec bins |
 |
 |
| Module-wise count rates for Quadrant C Data is divided into 100 sec bins |
 |
 |
| Module-wise count rates for Quadrant D Data is divided into 100 sec bins |
 |
 |
| Parameter | Plot |
|---|---|
| CZT HV Monitor | 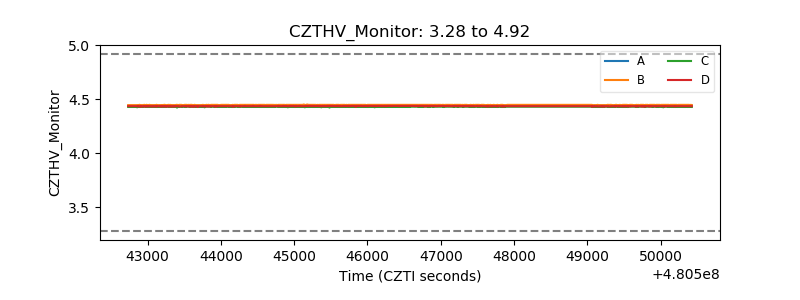 |
| D_VDD | 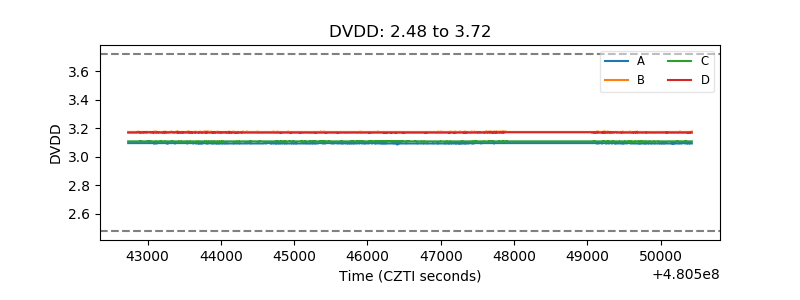 |
| Temperature 1 | 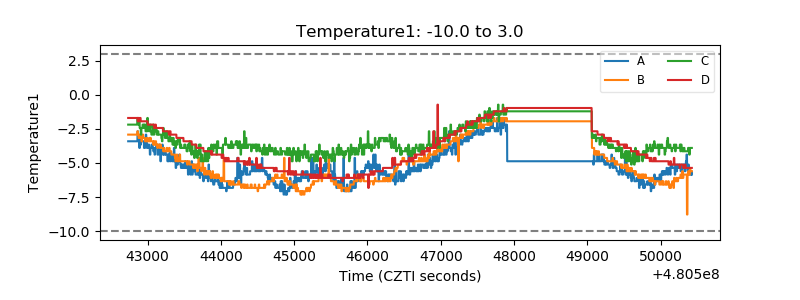 |
| Veto HV Monitor | 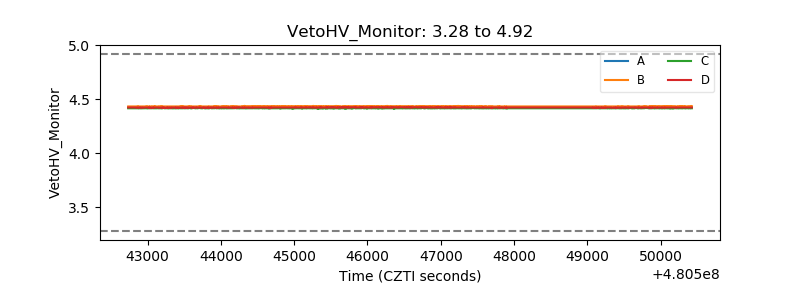 |
| Veto LLD | 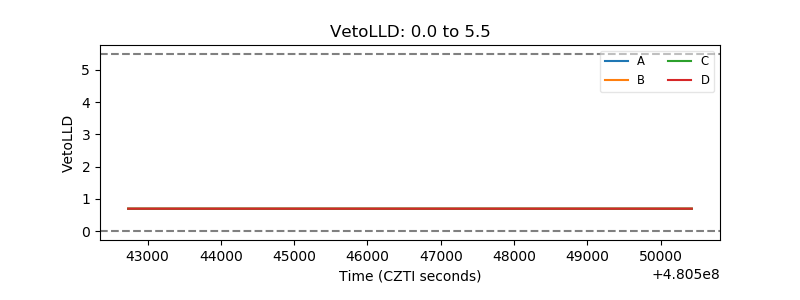 |
| Alpha Counter | 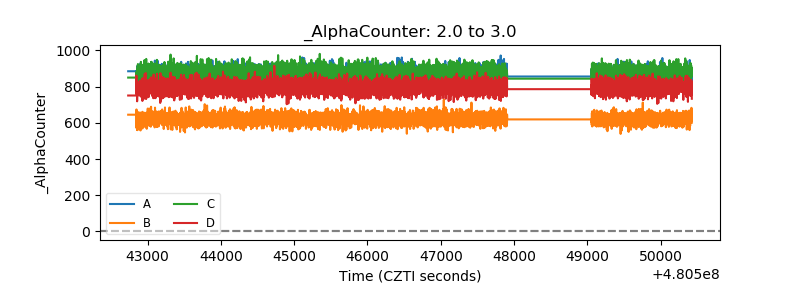 |
| _CPM_Rate | 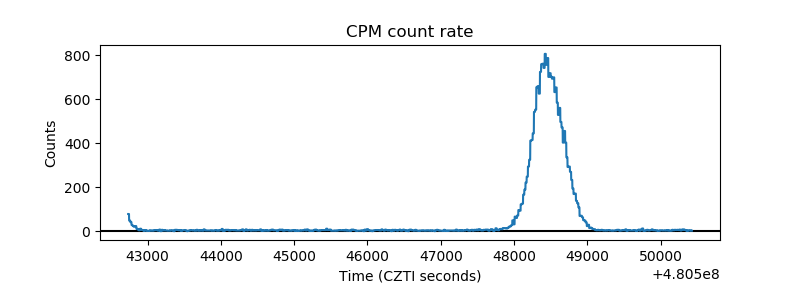 |
| CZT Counter | 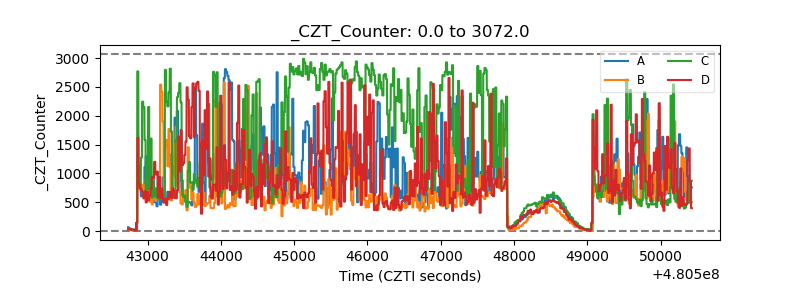 |
| +2.5 Volts monitor |  |
| +5 Volts monitor | 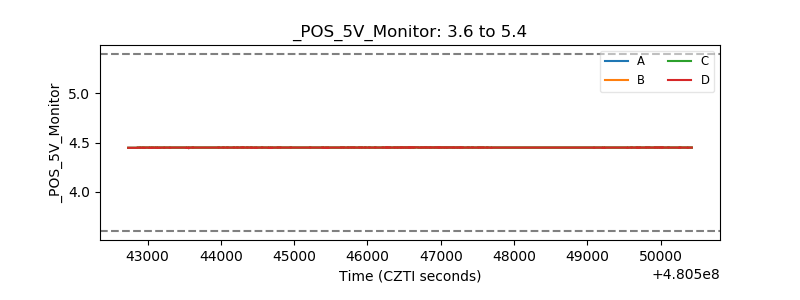 |
| _ROLL_ROT | 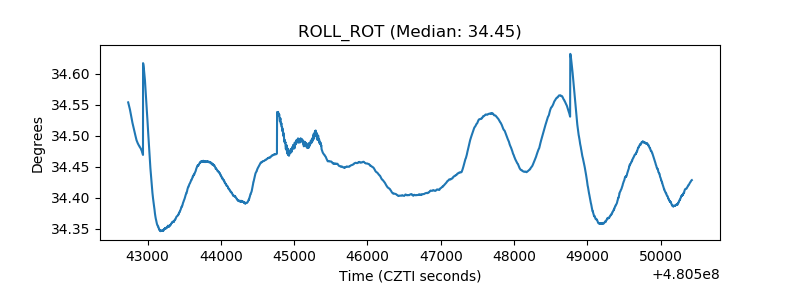 |
| _Roll_DEC | 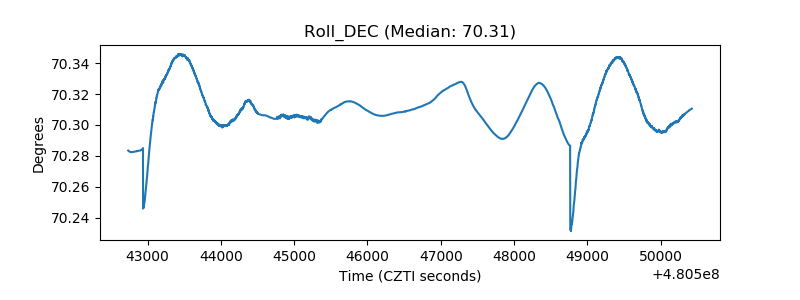 |
| _Roll_RA | 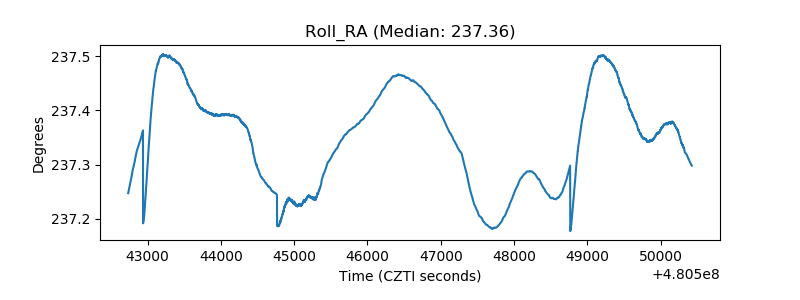 |
| Veto Counter | 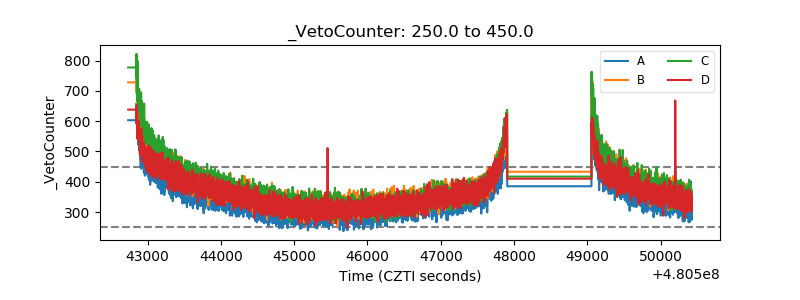 |