| Param | Original file | Final file |
|---|---|---|
| Filename | modeM0/AS1C07_001T03_9000006456_51323cztM0_level2.fits | modeM0/AS1C07_001T03_9000006456_51323cztM0_level2_quad_clean.evt |
| Size (bytes) | 696,504,960 | 73,344,960 |
| Size | 664.2 MB | 69.9 MB |
| Events in quadrant A | 5,190,297 | 521,152 |
| Events in quadrant B | 5,072,384 | 555,474 |
| Events in quadrant C | 10,081,158 | 283,902 |
| Events in quadrant D | 4,999,907 | 463,772 |
| Mode SS | |||
|---|---|---|---|
| Quadrant | BADHDUFLAG | Total packets | Discarded packets |
| A | 0 | 114 | 0 |
| B | 0 | 114 | 0 |
| C | 0 | 114 | 0 |
| D | 0 | 114 | 0 |
| Mode M0 | |||
|---|---|---|---|
| Quadrant | BADHDUFLAG | Total packets | Discarded packets |
| A | 0 | 19456 | 2 |
| B | 0 | 18968 | 2 |
| C | 0 | 33786 | 2 |
| D | 0 | 18983 | 2 |
| Mode M9 | |||
|---|---|---|---|
| Quadrant | BADHDUFLAG | Total packets | Discarded packets |
| A | 0 | 10 | 0 |
| B | 0 | 11 | 0 |
| C | 0 | 11 | 0 |
| D | 0 | 11 | 0 |
| Quadrant | Total seconds | Saturated seconds | Saturation percentage |
|---|---|---|---|
| A | 5671 | 258 | 4.549462% |
| B | 5671 | 471 | 8.305414% |
| C | 5671 | 2919 | 51.472403% |
| D | 5671 | 489 | 8.622818% |
Noise dominated data is calculated using 1-second bins in cleaned event files. If a bin has >2000 counts, and if more than 50% of those come from <1% of pixels, then it is considered to be noise-dominated and hence unusable.
| Quadrant | # 1 sec bins | Bins with >0 counts | Bins with >2000 counts | High rate bins dominated by noise | Noise dominated (total time) | Noise dominated (detector-on time) | Marked lightcurve |
|---|---|---|---|---|---|---|---|
| A | 6541 | 5672 | 237 | 237 | 3.62% | 4.18% | 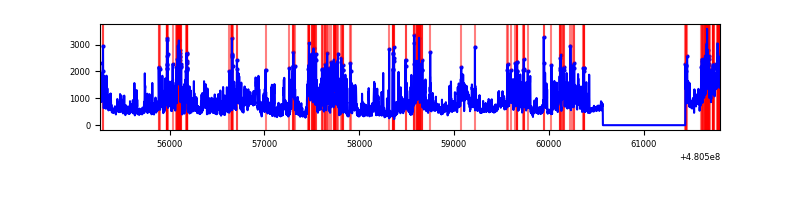 |
| B | 6541 | 5672 | 319 | 319 | 4.88% | 5.62% | 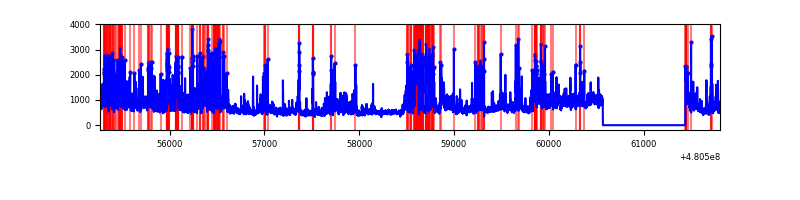 |
| C | 6541 | 5671 | 2714 | 2714 | 41.49% | 47.86% | 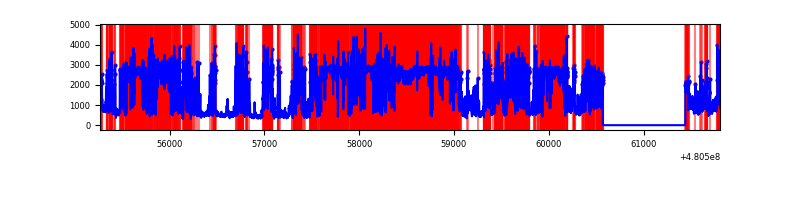 |
| D | 6541 | 5672 | 467 | 467 | 7.14% | 8.23% | 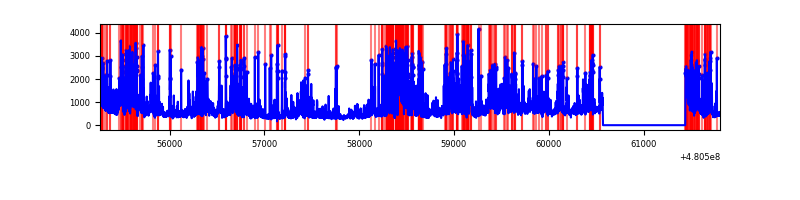 |
Top three noisy pixels from each quadrant. If the there are fewer than three noisy pixels in the level2.evt file, extra rows are filled as -1
| Pixel properties | Quadrant properties | ||||||
|---|---|---|---|---|---|---|---|
| Quadrant | DetID | PixID | Counts | Sigma | Mean | Median | Sigma |
| A | 12 | 3 | 2070135 | 14208.3 | 585 | 571 | 145.7 |
| A | 12 | 194 | 238610 | 1634.22 | 585 | 571 | 145.7 |
| A | 4 | 175 | 135037 | 923.16 | 585 | 571 | 145.7 |
| B | 5 | 185 | 658012 | 5341.52 | 579 | 560 | 123.1 |
| B | 0 | 197 | 618310 | 5018.96 | 579 | 560 | 123.1 |
| B | 5 | 172 | 470319 | 3816.6 | 579 | 560 | 123.1 |
| C | 4 | 12 | 7364888 | 64543.1 | 404 | 399 | 114.1 |
| C | 3 | 233 | 465897 | 4079.67 | 404 | 399 | 114.1 |
| C | 1 | 45 | 267399 | 2340.01 | 404 | 399 | 114.1 |
| D | 2 | 216 | 611921 | 3946.93 | 554 | 536 | 154.9 |
| D | 11 | 176 | 503501 | 3247.0 | 554 | 536 | 154.9 |
| D | 8 | 176 | 411595 | 2653.68 | 554 | 536 | 154.9 |
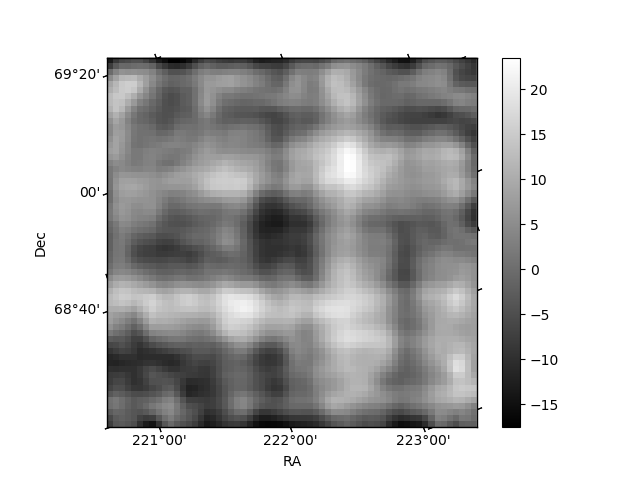
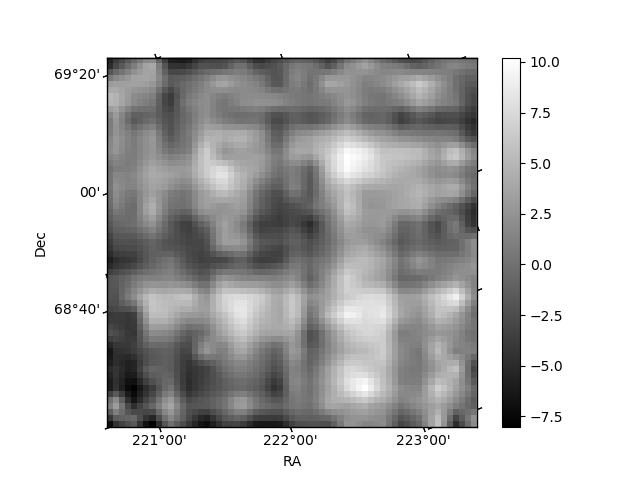
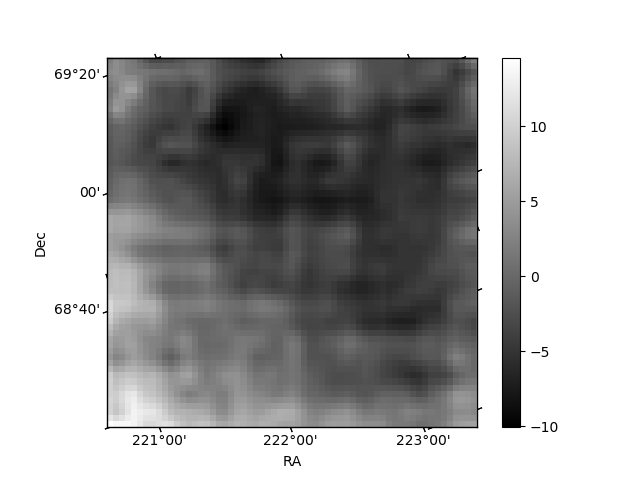
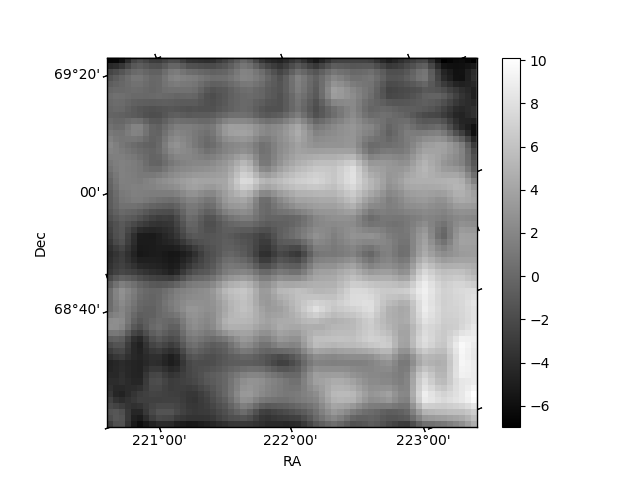
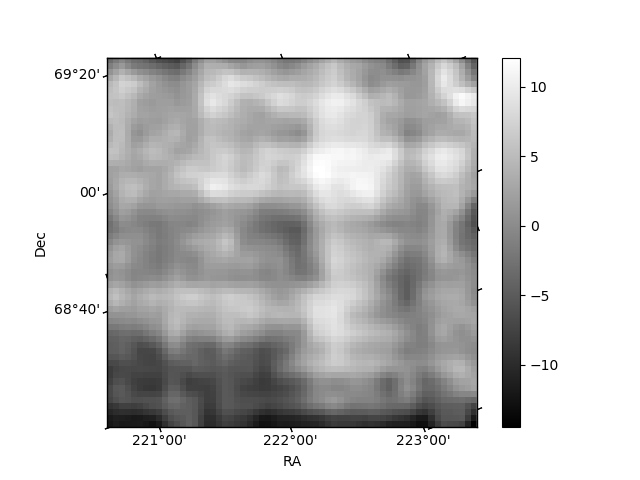
Histogram calculated using DETX and DETY for each event in the final _common_clean file
| Quadrant A | 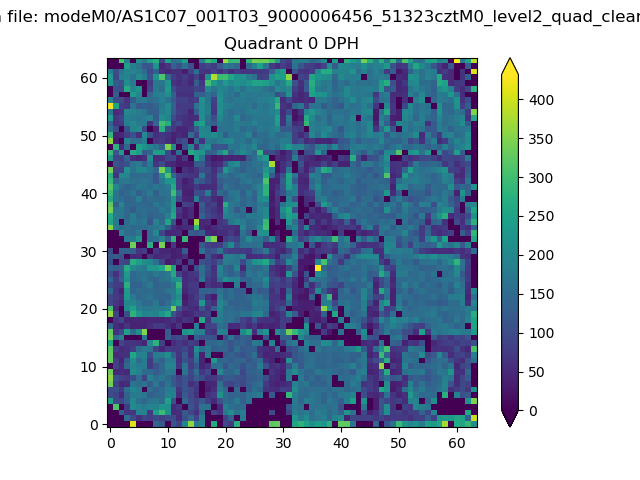 |
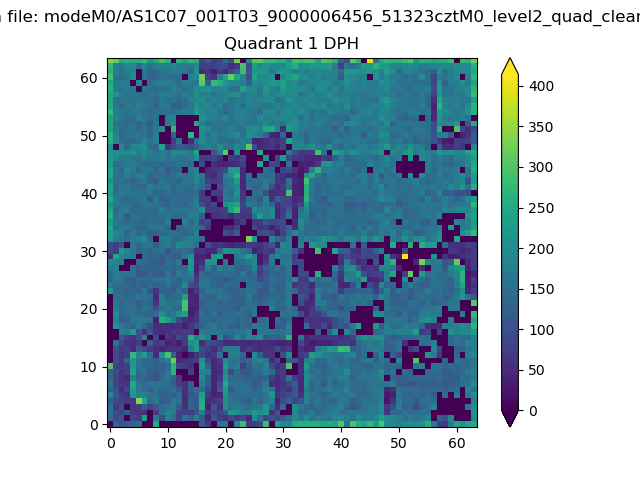 |
Quadrant B |
|---|---|---|---|
| Quadrant D | 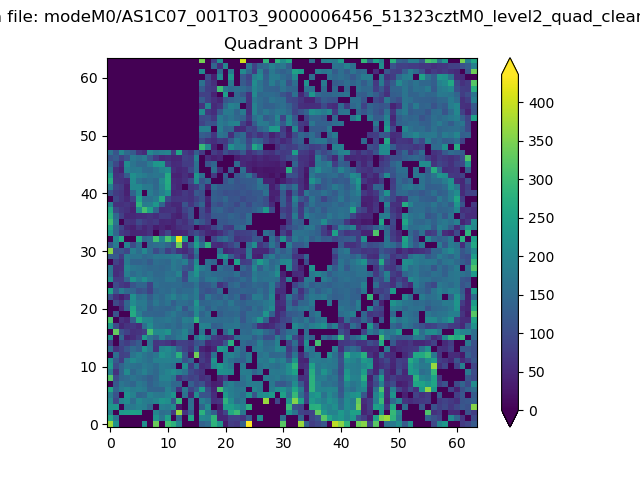 |
 |
Quadrant C |
| Plot type | Count rate plots | Images |
|---|---|---|
| Comparison with Poisson distribution Blue bars denote a histogram of data divided into 1 sec bins. Red curve is a Poisson curve with rate = median count rate of data. |
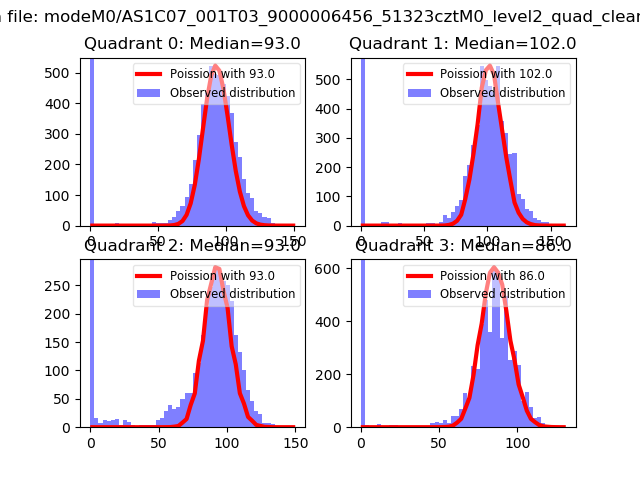 |
 |
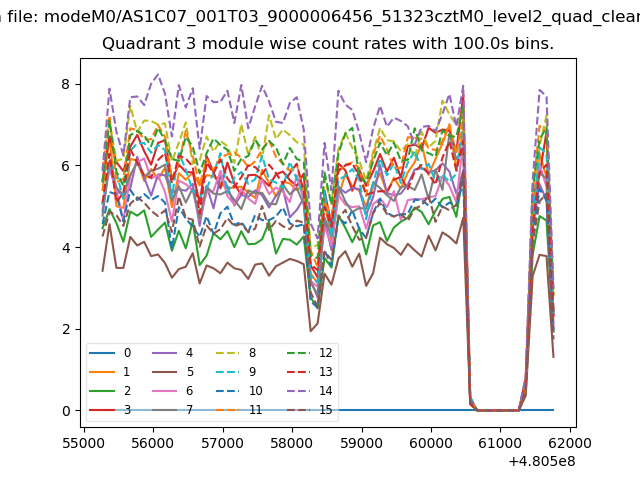
| Quadrant-wise count rates Data is divided into 100 sec bins |
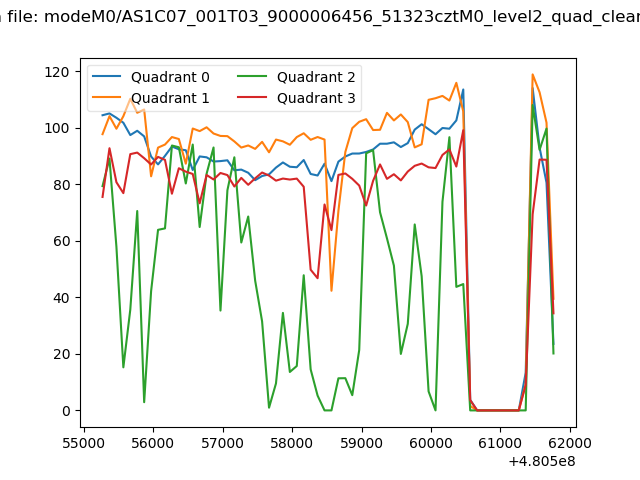 |
|
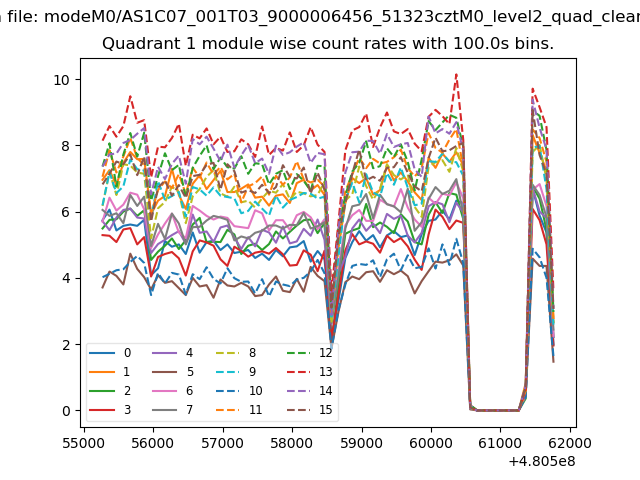
| Module-wise count rates for Quadrant A Data is divided into 100 sec bins |
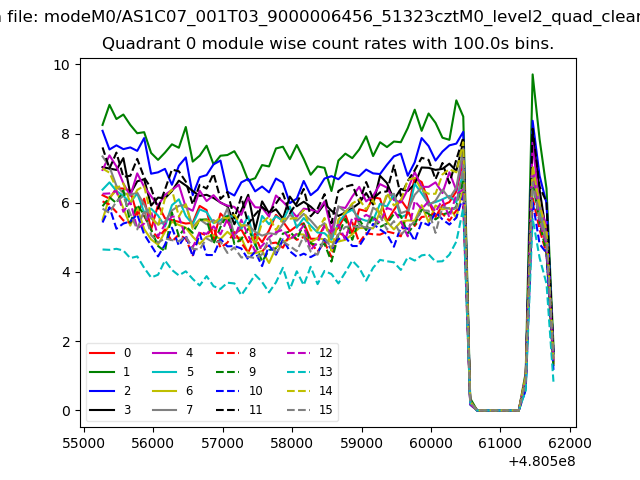 |
 |
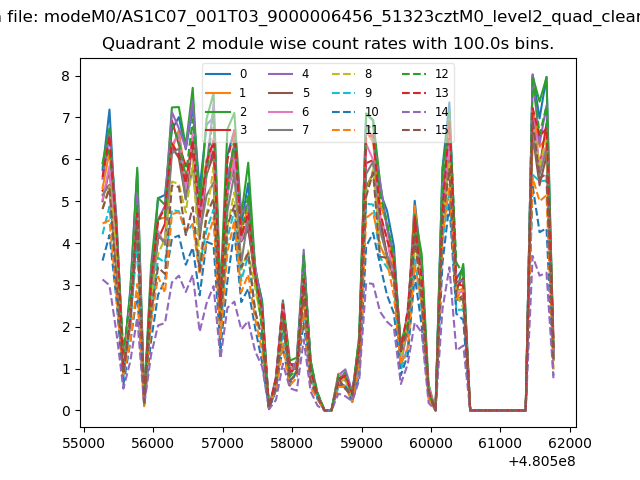
| Module-wise count rates for Quadrant B Data is divided into 100 sec bins |
 |
 |
| Module-wise count rates for Quadrant C Data is divided into 100 sec bins |
 |
 |
| Module-wise count rates for Quadrant D Data is divided into 100 sec bins |
 |
 |
| Parameter | Plot |
|---|---|
| CZT HV Monitor | 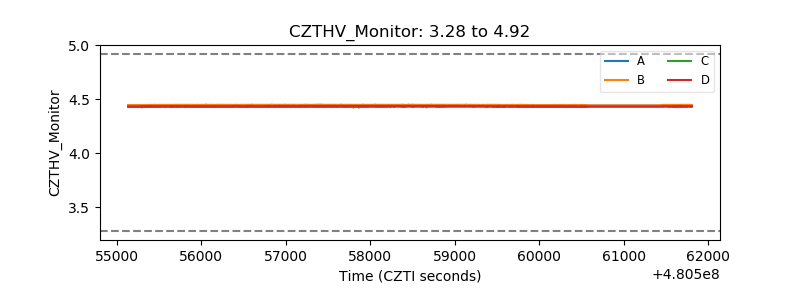 |
| D_VDD | 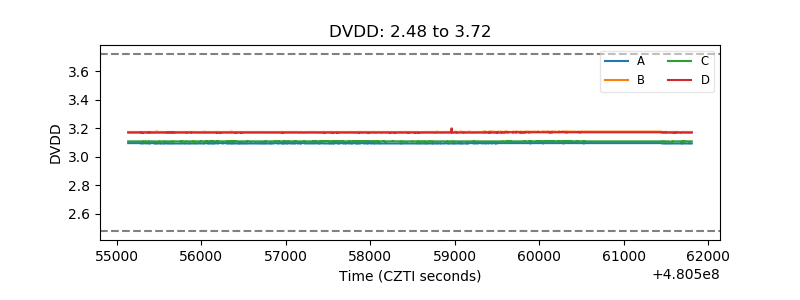 |
| Temperature 1 | 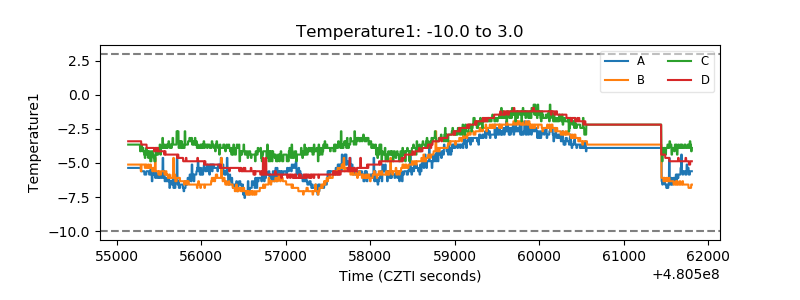 |
| Veto HV Monitor | 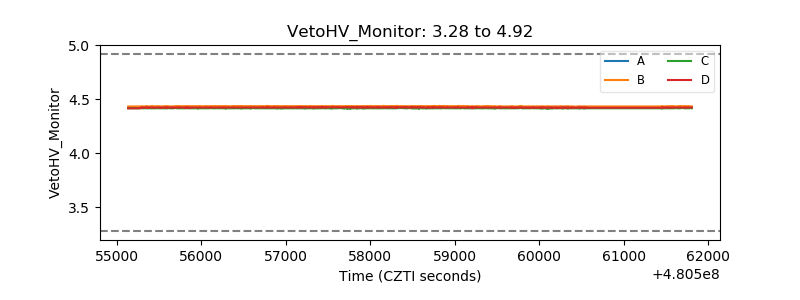 |
| Veto LLD | 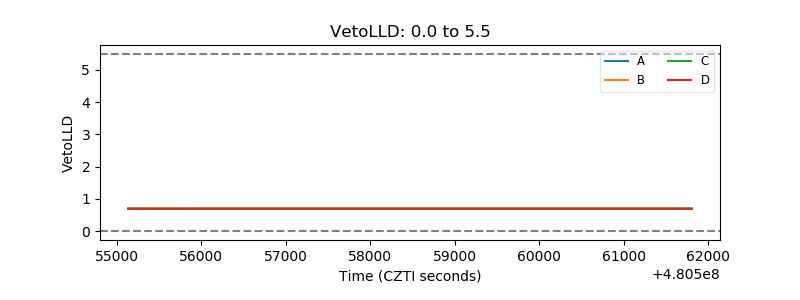 |
| Alpha Counter | 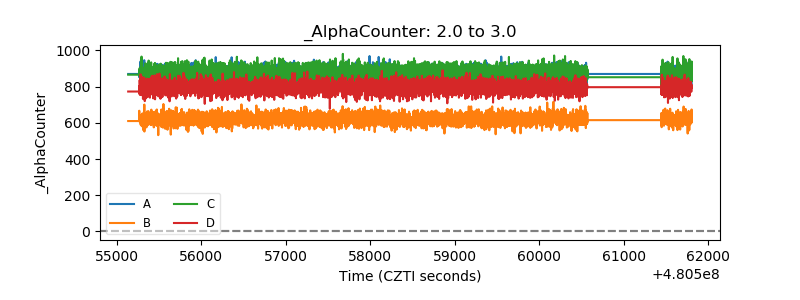 |
| _CPM_Rate | 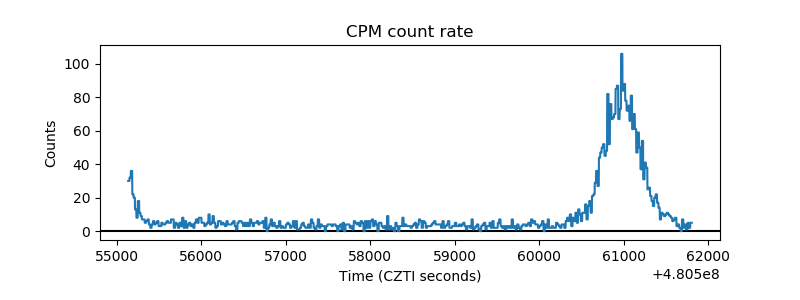 |
| CZT Counter | 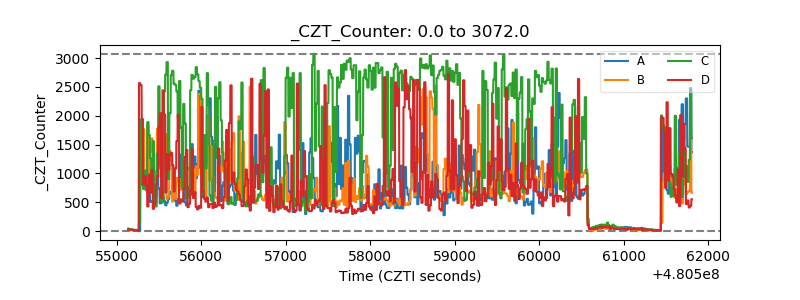 |
| +2.5 Volts monitor |  |
| +5 Volts monitor | 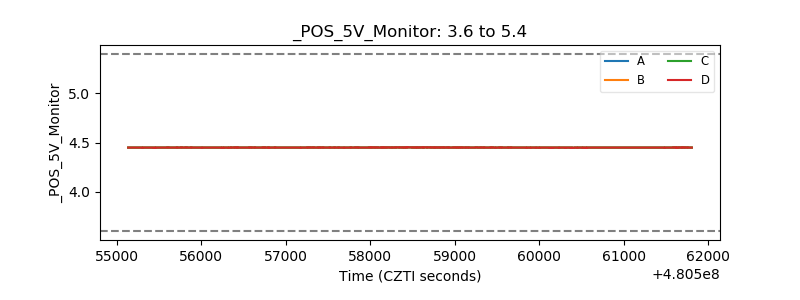 |
| _ROLL_ROT | 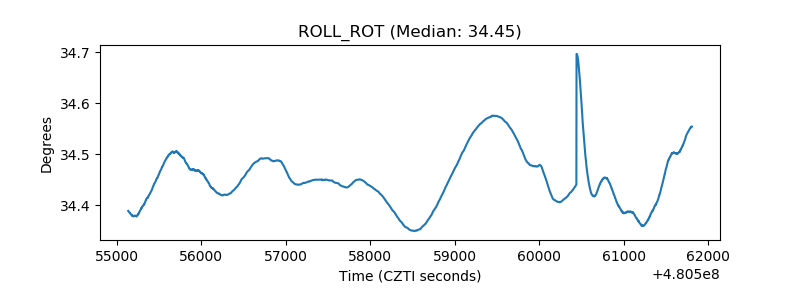 |
| _Roll_DEC | 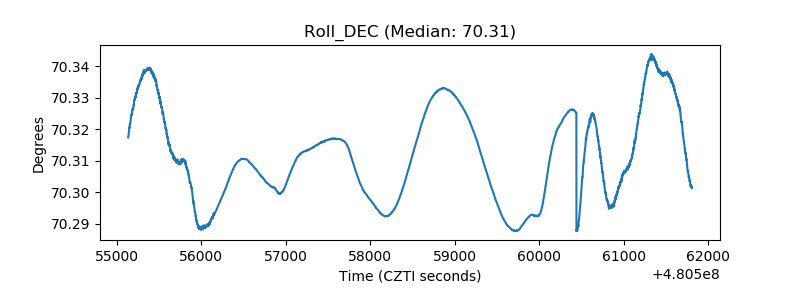 |
| _Roll_RA | 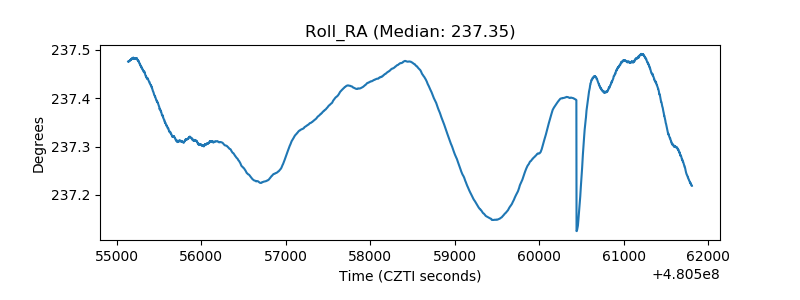 |
| Veto Counter | 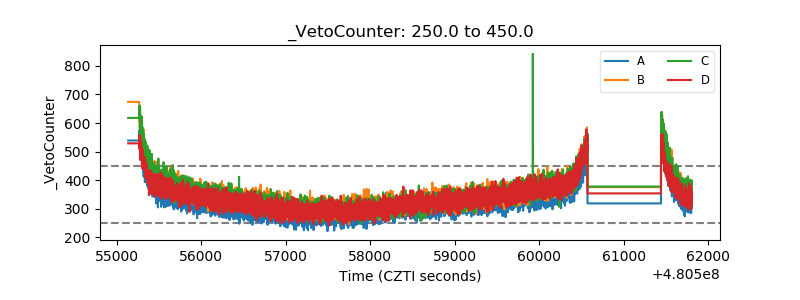 |