| Param | Original file | Final file |
|---|---|---|
| Filename | modeM0/AS1C07_001T03_9000006456_51324cztM0_level2.fits | modeM0/AS1C07_001T03_9000006456_51324cztM0_level2_quad_clean.evt |
| Size (bytes) | 1,007,876,160 | 97,444,800 |
| Size | 961.2 MB | 92.9 MB |
| Events in quadrant A | 9,353,059 | 661,716 |
| Events in quadrant B | 6,670,194 | 754,330 |
| Events in quadrant C | 14,790,607 | 348,332 |
| Events in quadrant D | 5,892,700 | 643,179 |
| Mode SS | |||
|---|---|---|---|
| Quadrant | BADHDUFLAG | Total packets | Discarded packets |
| A | 0 | 158 | 0 |
| B | 0 | 158 | 0 |
| C | 0 | 158 | 0 |
| D | 0 | 158 | 0 |
| Mode M0 | |||
|---|---|---|---|
| Quadrant | BADHDUFLAG | Total packets | Discarded packets |
| A | 0 | 33255 | 2 |
| B | 0 | 25231 | 2 |
| C | 0 | 49287 | 2 |
| D | 0 | 23153 | 2 |
| Mode M9 | |||
|---|---|---|---|
| Quadrant | BADHDUFLAG | Total packets | Discarded packets |
| A | 0 | 8 | 0 |
| B | 0 | 9 | 0 |
| C | 0 | 9 | 0 |
| D | 0 | 9 | 0 |
| Quadrant | Total seconds | Saturated seconds | Saturation percentage |
|---|---|---|---|
| A | 7803 | 785 | 10.060233% |
| B | 7803 | 539 | 6.907600% |
| C | 7803 | 4476 | 57.362553% |
| D | 7803 | 416 | 5.331283% |
Noise dominated data is calculated using 1-second bins in cleaned event files. If a bin has >2000 counts, and if more than 50% of those come from <1% of pixels, then it is considered to be noise-dominated and hence unusable.
| Quadrant | # 1 sec bins | Bins with >0 counts | Bins with >2000 counts | High rate bins dominated by noise | Noise dominated (total time) | Noise dominated (detector-on time) | Marked lightcurve |
|---|---|---|---|---|---|---|---|
| A | 8013 | 7804 | 512 | 512 | 6.39% | 6.56% | 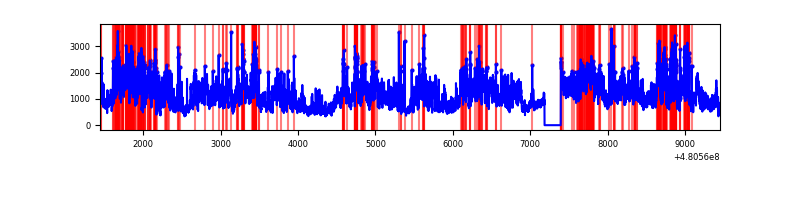 |
| B | 8013 | 7804 | 308 | 308 | 3.84% | 3.95% | 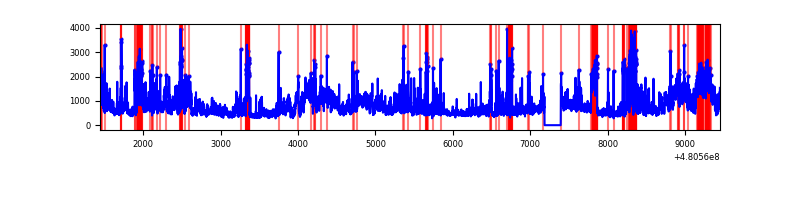 |
| C | 8012 | 7803 | 4118 | 4118 | 51.40% | 52.77% | 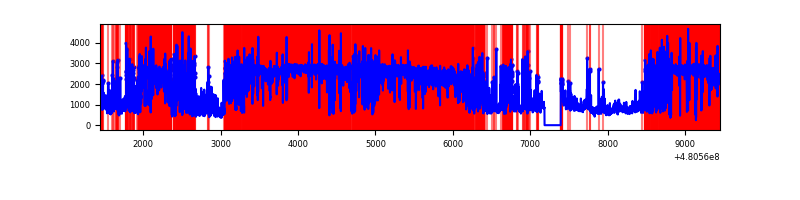 |
| D | 8013 | 7804 | 361 | 361 | 4.51% | 4.63% | 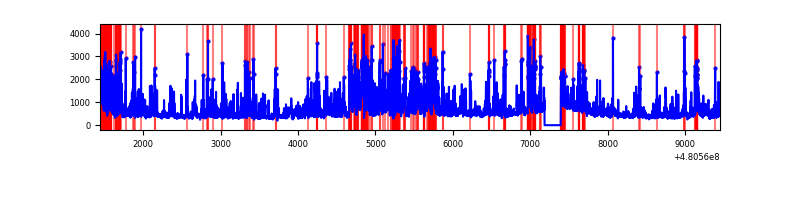 |
Top three noisy pixels from each quadrant. If the there are fewer than three noisy pixels in the level2.evt file, extra rows are filled as -1
| Pixel properties | Quadrant properties | ||||||
|---|---|---|---|---|---|---|---|
| Quadrant | DetID | PixID | Counts | Sigma | Mean | Median | Sigma |
| A | 12 | 3 | 4418594 | 22171.48 | 795 | 775 | 199.3 |
| A | 12 | 250 | 621965 | 3117.53 | 795 | 775 | 199.3 |
| A | 12 | 194 | 503636 | 2523.68 | 795 | 775 | 199.3 |
| B | 10 | 254 | 1843242 | 10674.16 | 804 | 773 | 172.6 |
| B | 5 | 172 | 833432 | 4823.93 | 804 | 773 | 172.6 |
| B | 5 | 185 | 146282 | 842.99 | 804 | 773 | 172.6 |
| C | 4 | 12 | 9472716 | 66393.49 | 511 | 507 | 142.7 |
| C | 15 | 205 | 1687317 | 11823.35 | 511 | 507 | 142.7 |
| C | 3 | 233 | 973162 | 6817.62 | 511 | 507 | 142.7 |
| D | 11 | 176 | 1042685 | 4826.86 | 770 | 742 | 215.9 |
| D | 12 | 128 | 320096 | 1479.43 | 770 | 742 | 215.9 |
| D | 3 | 12 | 268121 | 1238.65 | 770 | 742 | 215.9 |
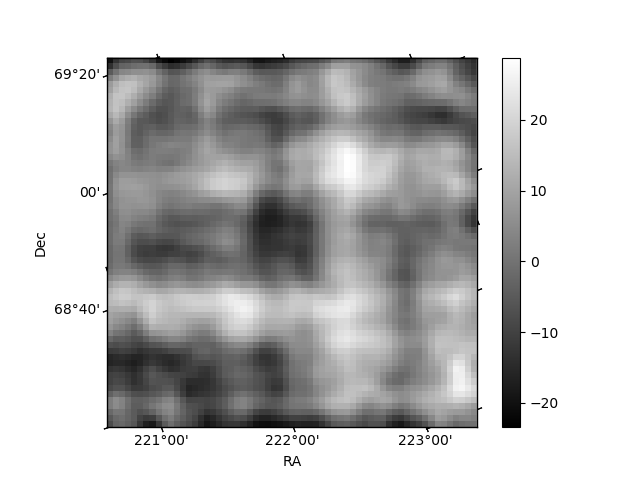
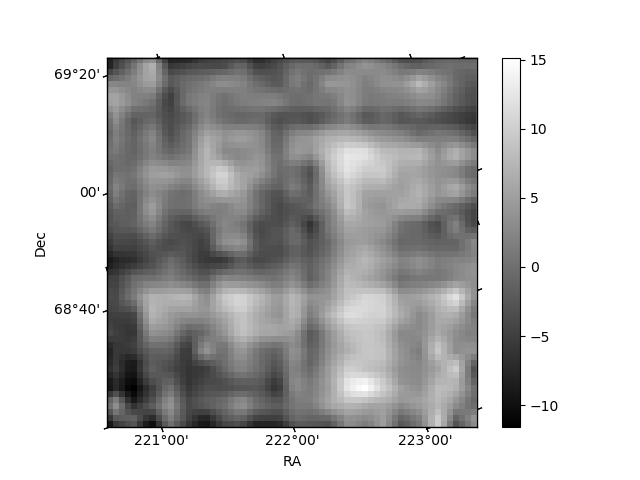
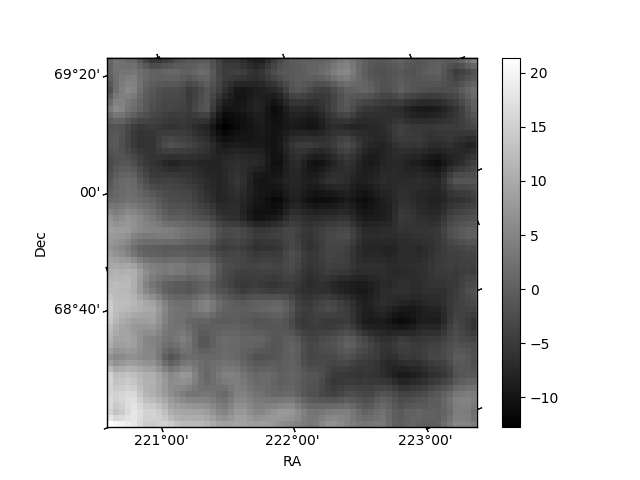
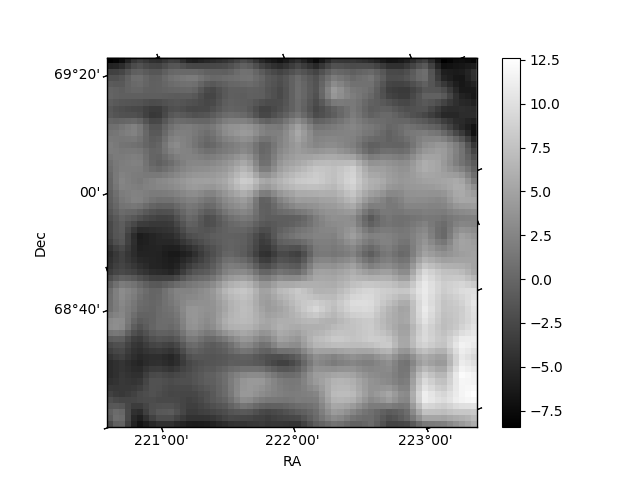
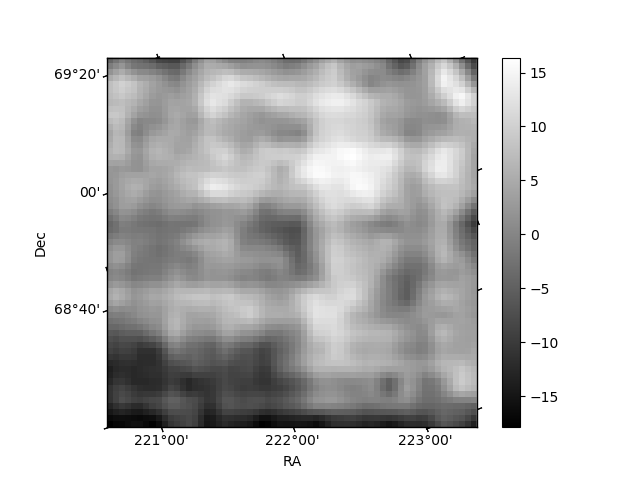
Histogram calculated using DETX and DETY for each event in the final _common_clean file
| Quadrant A | 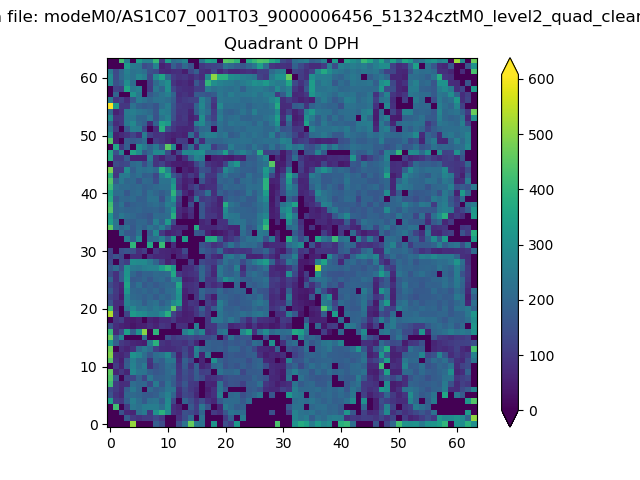 |
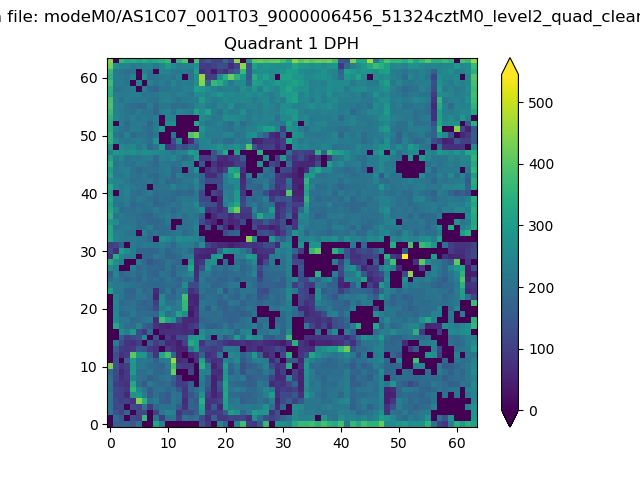 |
Quadrant B |
|---|---|---|---|
| Quadrant D | 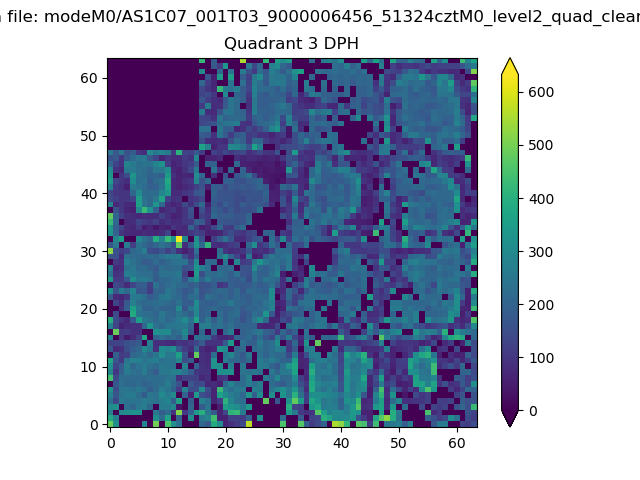 |
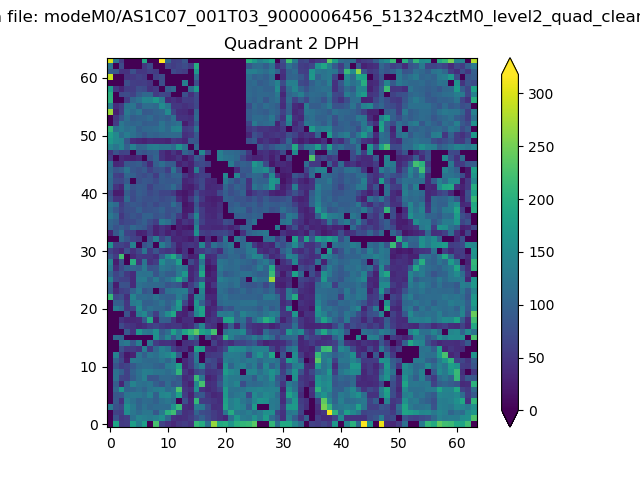 |
Quadrant C |
| Plot type | Count rate plots | Images |
|---|---|---|
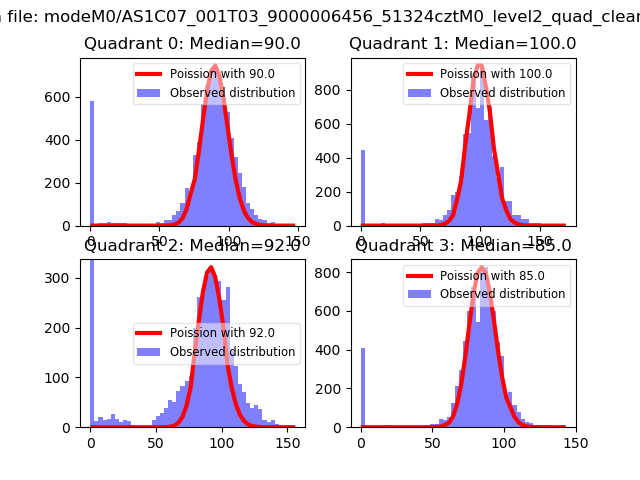
| Comparison with Poisson distribution Blue bars denote a histogram of data divided into 1 sec bins. Red curve is a Poisson curve with rate = median count rate of data. |
 |
 |
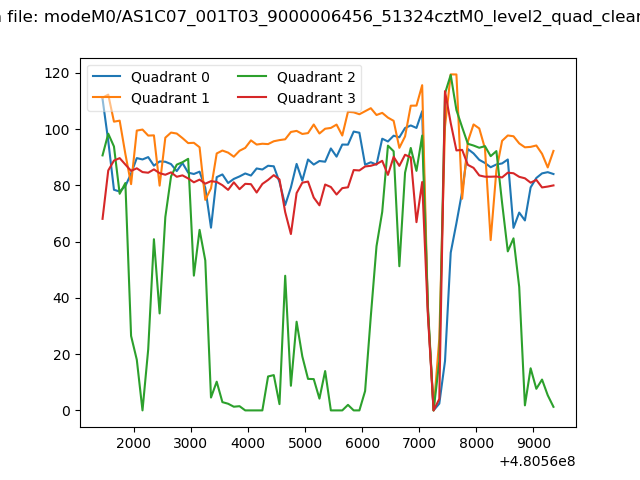
| Quadrant-wise count rates Data is divided into 100 sec bins |
 |
|
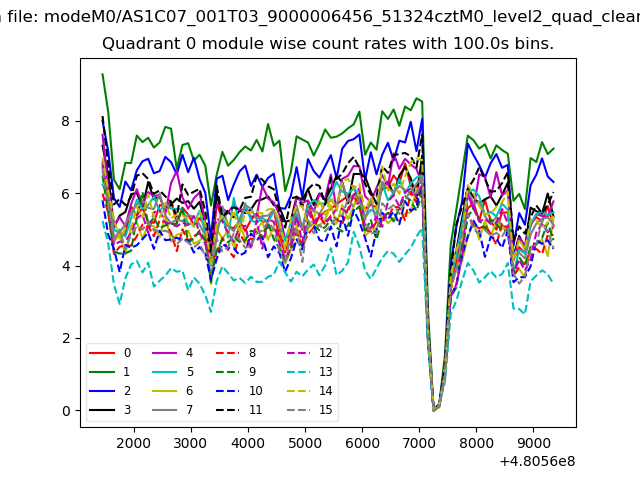
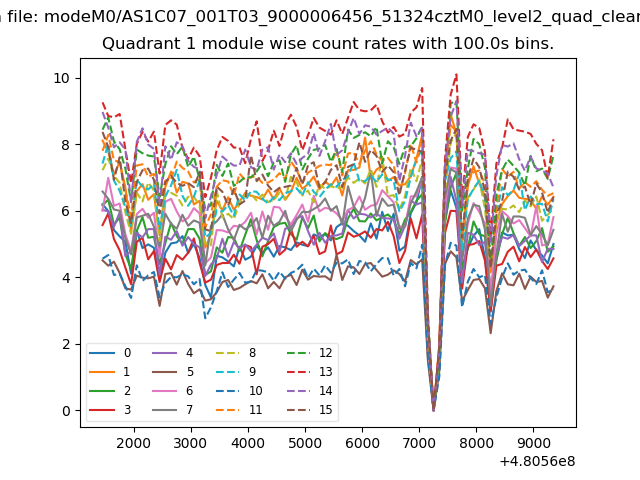
| Module-wise count rates for Quadrant A Data is divided into 100 sec bins |
 |
 |
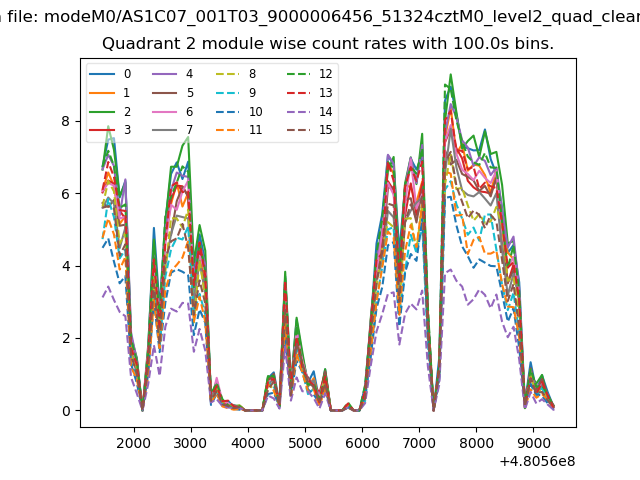
| Module-wise count rates for Quadrant B Data is divided into 100 sec bins |
 |
 |
| Module-wise count rates for Quadrant C Data is divided into 100 sec bins |
 |
 |
| Module-wise count rates for Quadrant D Data is divided into 100 sec bins |
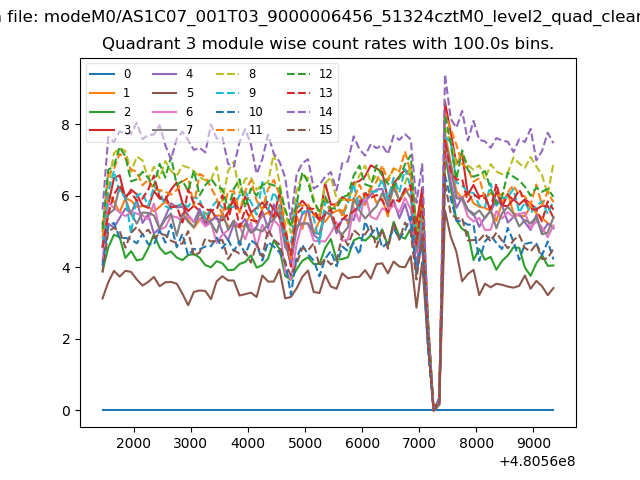 |
 |
| Parameter | Plot |
|---|---|
| CZT HV Monitor | 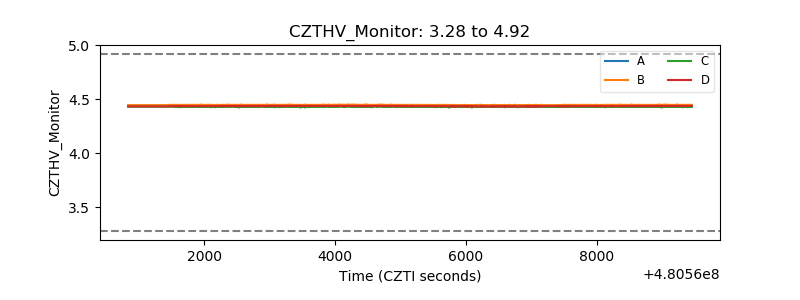 |
| D_VDD | 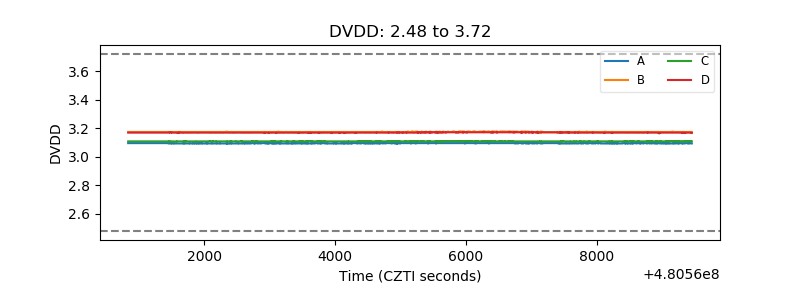 |
| Temperature 1 |  |
| Veto HV Monitor | 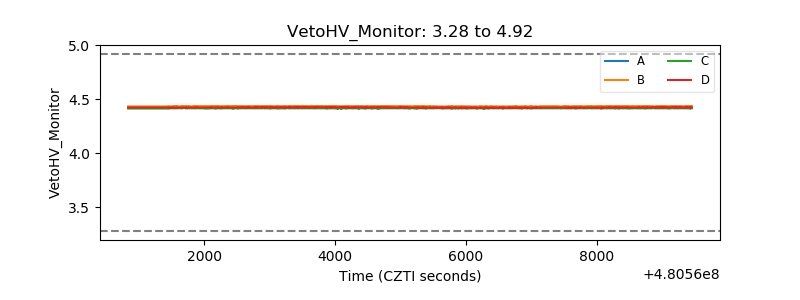 |
| Veto LLD | 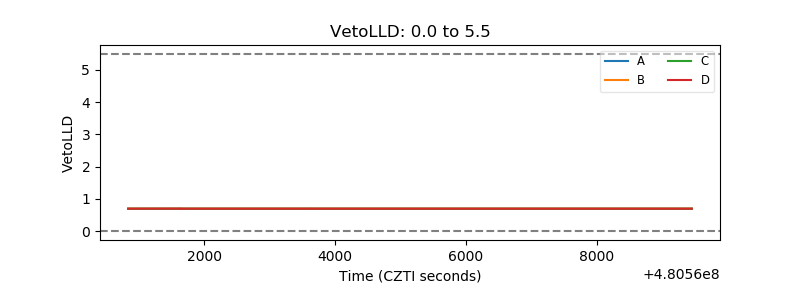 |
| Alpha Counter | 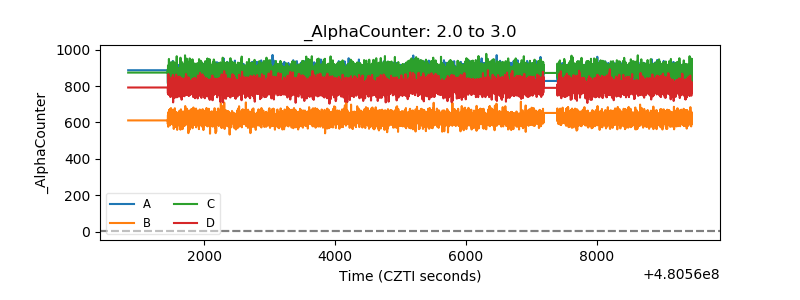 |
| _CPM_Rate | 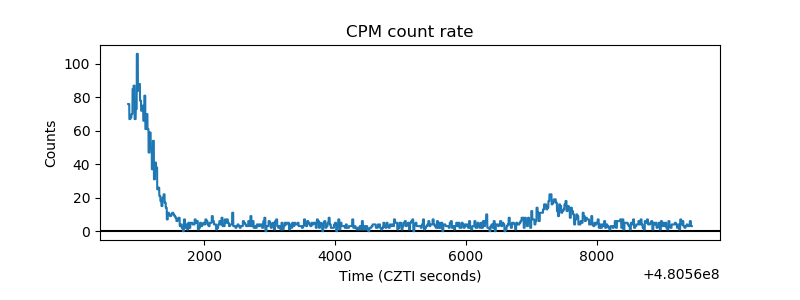 |
| CZT Counter | 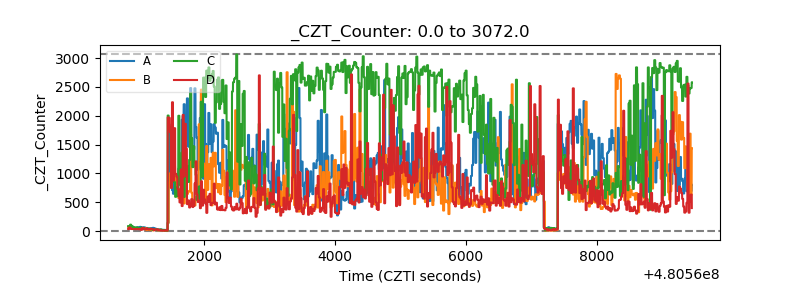 |
| +2.5 Volts monitor | 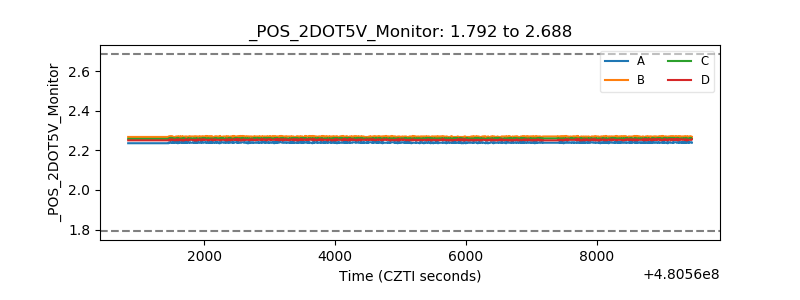 |
| +5 Volts monitor | 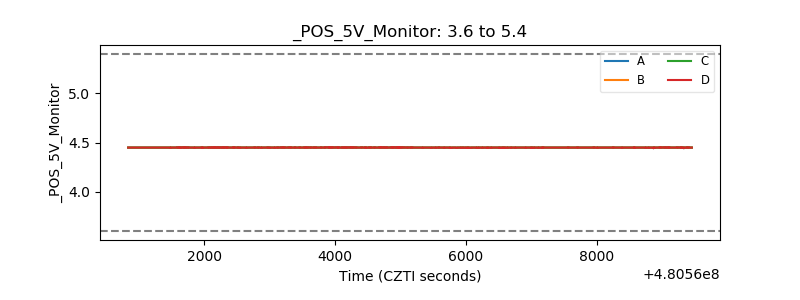 |
| _ROLL_ROT | 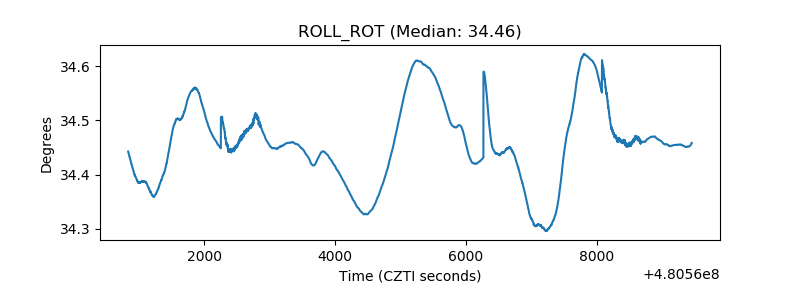 |
| _Roll_DEC | 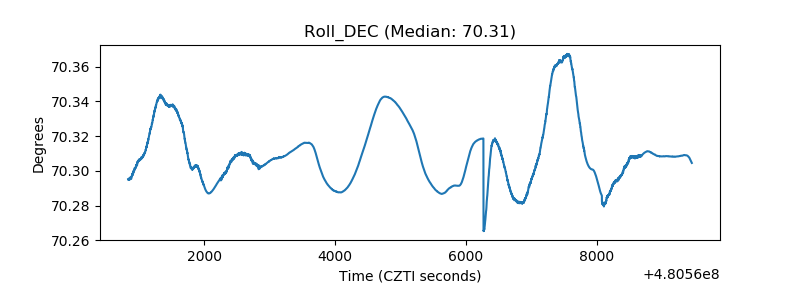 |
| _Roll_RA | 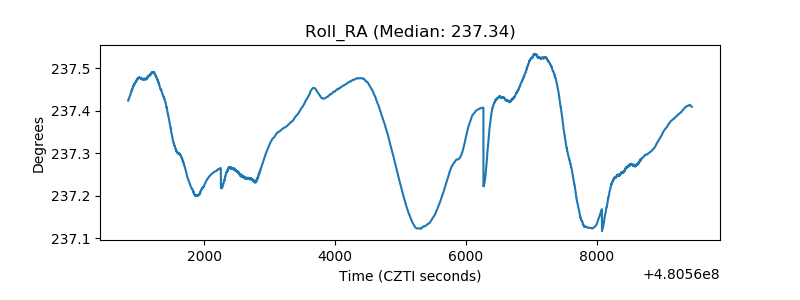 |
| Veto Counter | 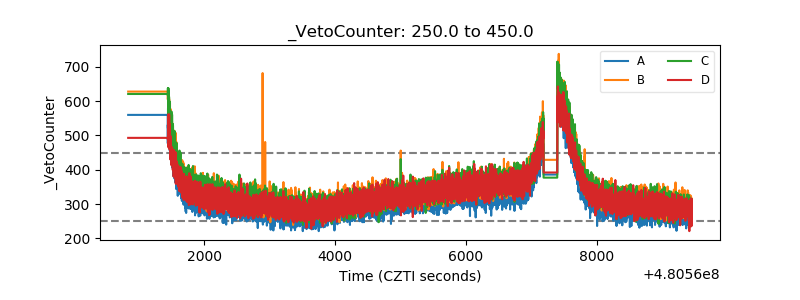 |