| Param | Original file | Final file |
|---|---|---|
| Filename | modeM0/AS1C07_001T03_9000006456_51325cztM0_level2.fits | modeM0/AS1C07_001T03_9000006456_51325cztM0_level2_quad_clean.evt |
| Size (bytes) | 1,091,453,760 | 88,750,080 |
| Size | 1.0 GB | 84.6 MB |
| Events in quadrant A | 8,996,975 | 609,249 |
| Events in quadrant B | 8,239,567 | 616,550 |
| Events in quadrant C | 15,141,881 | 318,391 |
| Events in quadrant D | 7,432,695 | 609,191 |
| Mode SS | |||
|---|---|---|---|
| Quadrant | BADHDUFLAG | Total packets | Discarded packets |
| A | 0 | 152 | 0 |
| B | 0 | 152 | 0 |
| C | 0 | 152 | 0 |
| D | 0 | 152 | 0 |
| Mode M0 | |||
|---|---|---|---|
| Quadrant | BADHDUFLAG | Total packets | Discarded packets |
| A | 0 | 32174 | 0 |
| B | 0 | 29732 | 0 |
| C | 0 | 50306 | 8 |
| D | 0 | 27557 | 0 |
| Quadrant | Total seconds | Saturated seconds | Saturation percentage |
|---|---|---|---|
| A | 7673 | 1027 | 13.384595% |
| B | 7673 | 1550 | 20.200704% |
| C | 7672 | 4530 | 59.045881% |
| D | 7673 | 656 | 8.549459% |
Noise dominated data is calculated using 1-second bins in cleaned event files. If a bin has >2000 counts, and if more than 50% of those come from <1% of pixels, then it is considered to be noise-dominated and hence unusable.
| Quadrant | # 1 sec bins | Bins with >0 counts | Bins with >2000 counts | High rate bins dominated by noise | Noise dominated (total time) | Noise dominated (detector-on time) | Marked lightcurve |
|---|---|---|---|---|---|---|---|
| A | 7673 | 7673 | 902 | 902 | 11.76% | 11.76% | 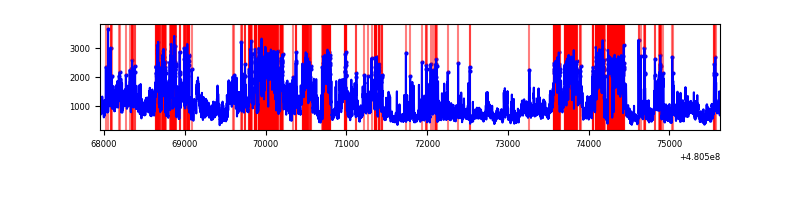 |
| B | 7673 | 7673 | 1386 | 1386 | 18.06% | 18.06% | 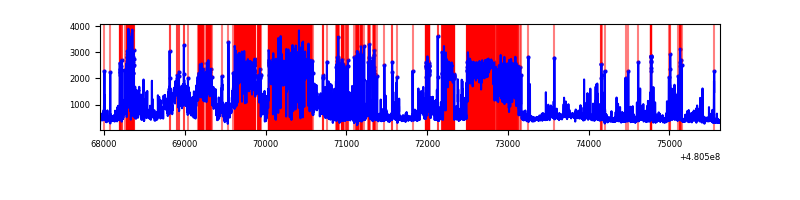 |
| C | 7671 | 7671 | 4284 | 4284 | 55.85% | 55.85% | 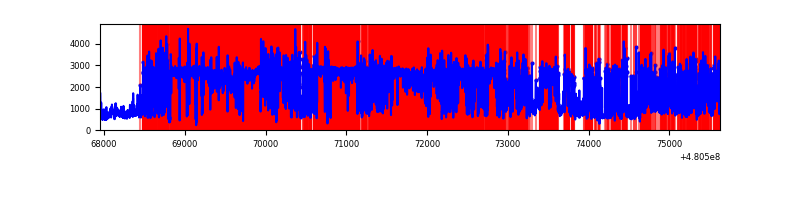 |
| D | 7673 | 7673 | 670 | 670 | 8.73% | 8.73% | 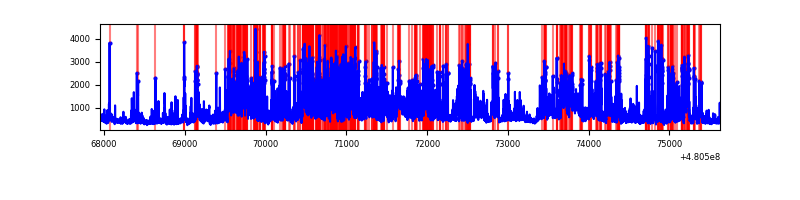 |
Top three noisy pixels from each quadrant. If the there are fewer than three noisy pixels in the level2.evt file, extra rows are filled as -1
| Pixel properties | Quadrant properties | ||||||
|---|---|---|---|---|---|---|---|
| Quadrant | DetID | PixID | Counts | Sigma | Mean | Median | Sigma |
| A | 12 | 3 | 2716682 | 14705.21 | 735 | 716 | 184.7 |
| A | 12 | 250 | 2402821 | 13005.85 | 735 | 716 | 184.7 |
| A | 12 | 194 | 308855 | 1668.37 | 735 | 716 | 184.7 |
| B | 5 | 172 | 2762232 | 18144.25 | 708 | 682 | 152.2 |
| B | 10 | 254 | 1673388 | 10990.2 | 708 | 682 | 152.2 |
| B | 5 | 185 | 269639 | 1767.13 | 708 | 682 | 152.2 |
| C | 4 | 12 | 8685445 | 64489.24 | 479 | 475 | 134.7 |
| C | 15 | 205 | 1675271 | 12436.0 | 479 | 475 | 134.7 |
| C | 3 | 233 | 1383844 | 10272.05 | 479 | 475 | 134.7 |
| D | 11 | 176 | 2875709 | 14013.64 | 725 | 699 | 205.2 |
| D | 3 | 12 | 357518 | 1739.24 | 725 | 699 | 205.2 |
| D | 7 | 96 | 255999 | 1244.41 | 725 | 699 | 205.2 |
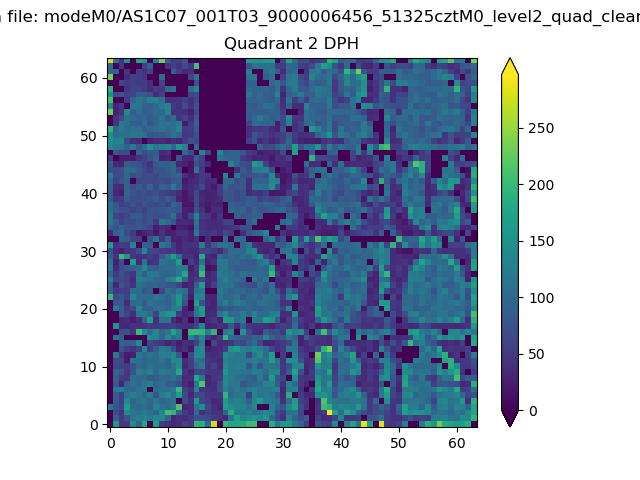
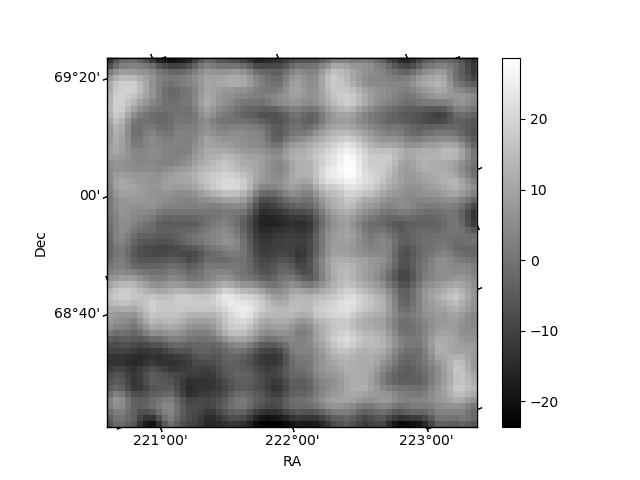
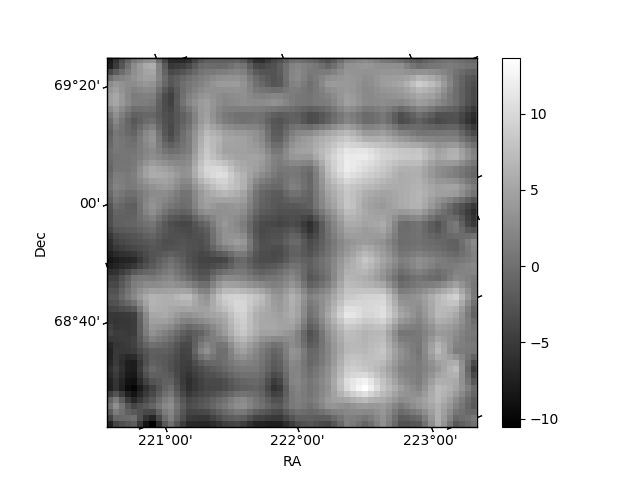
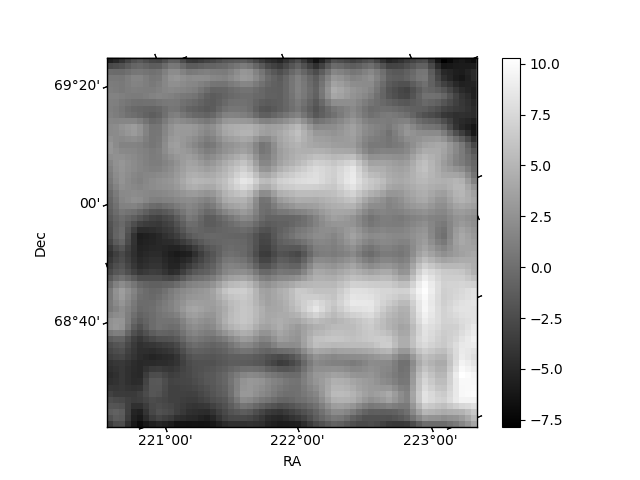
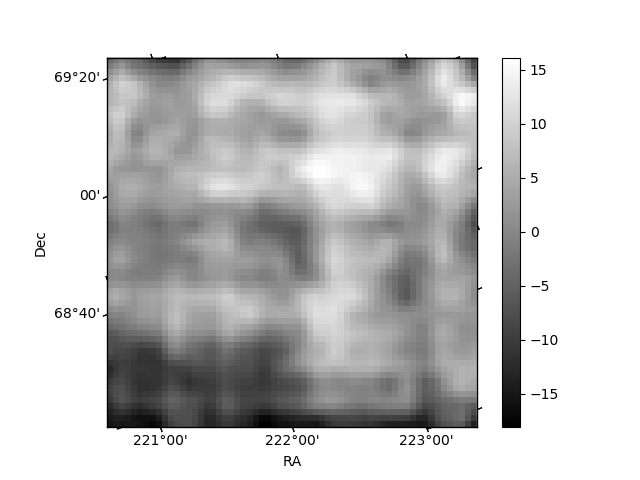
Histogram calculated using DETX and DETY for each event in the final _common_clean file
| Quadrant A | 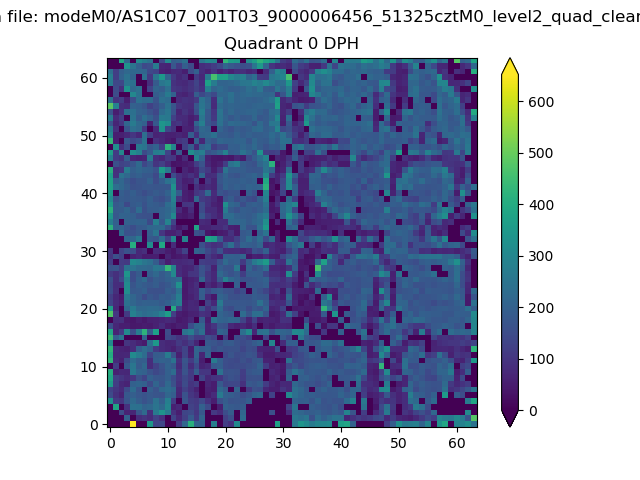 |
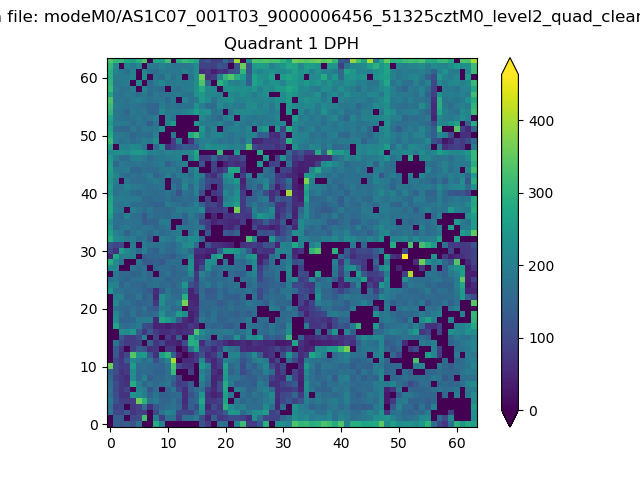 |
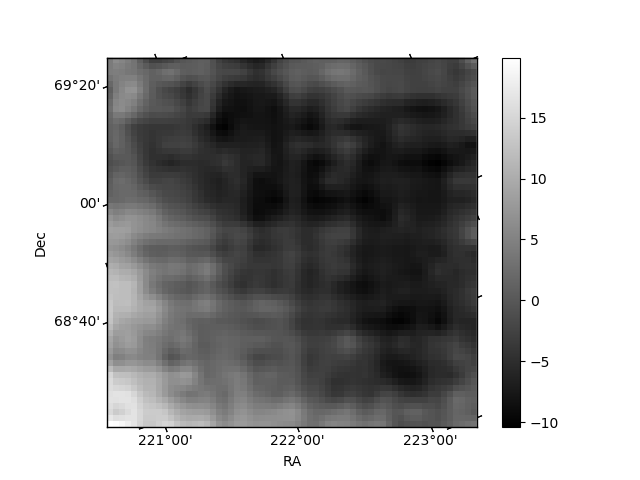
Quadrant B |
|---|---|---|---|
| Quadrant D | 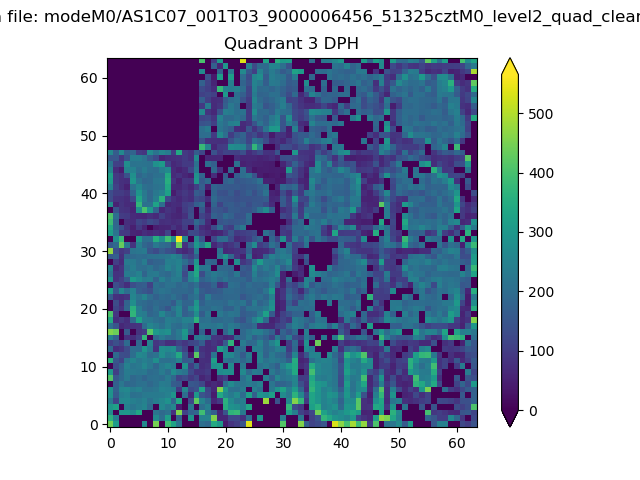 |
 |
Quadrant C |
| Plot type | Count rate plots | Images |
|---|---|---|
| Comparison with Poisson distribution Blue bars denote a histogram of data divided into 1 sec bins. Red curve is a Poisson curve with rate = median count rate of data. |
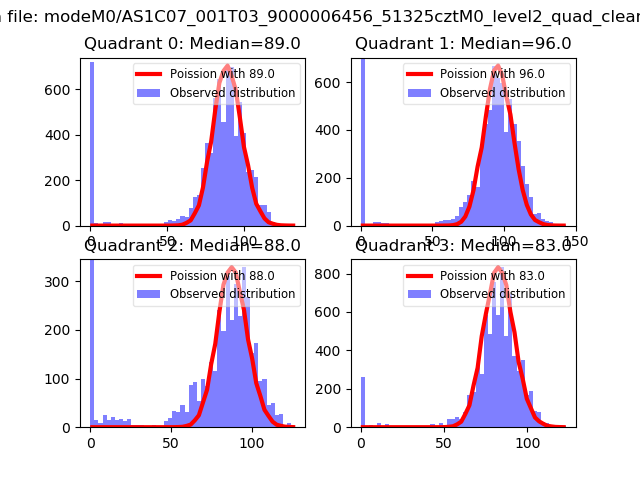 |
 |
| Quadrant-wise count rates Data is divided into 100 sec bins |
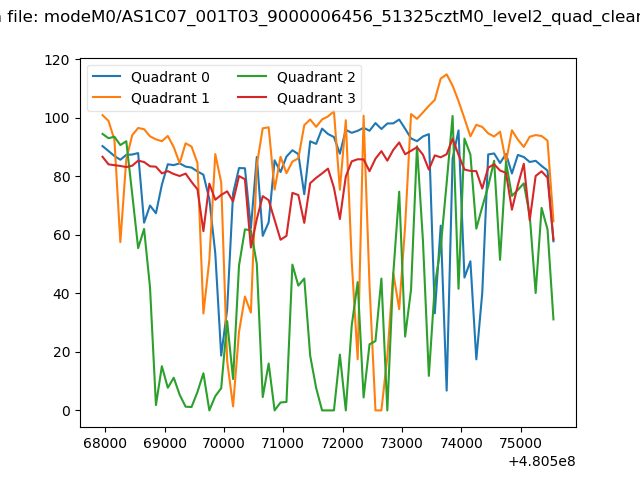 |
|
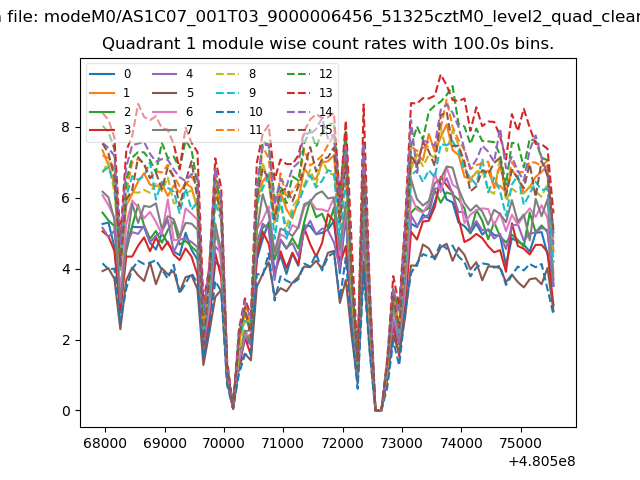
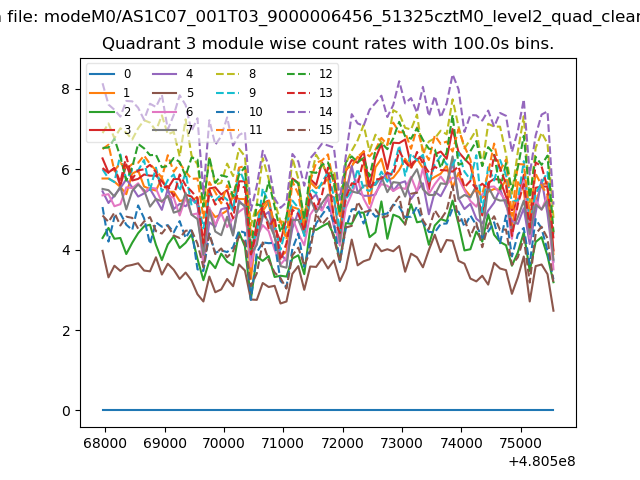
| Module-wise count rates for Quadrant A Data is divided into 100 sec bins |
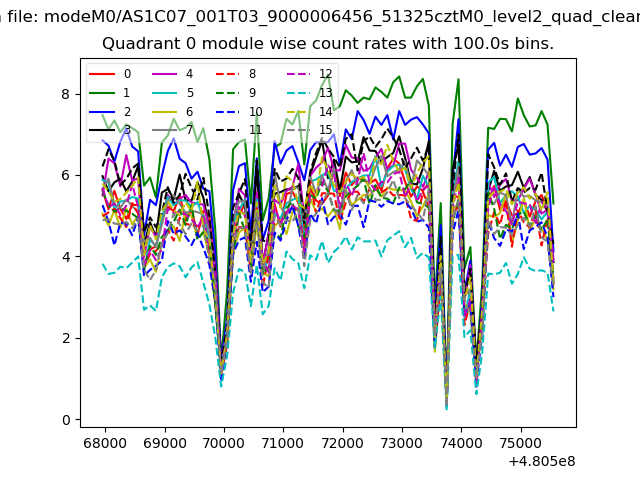 |
 |
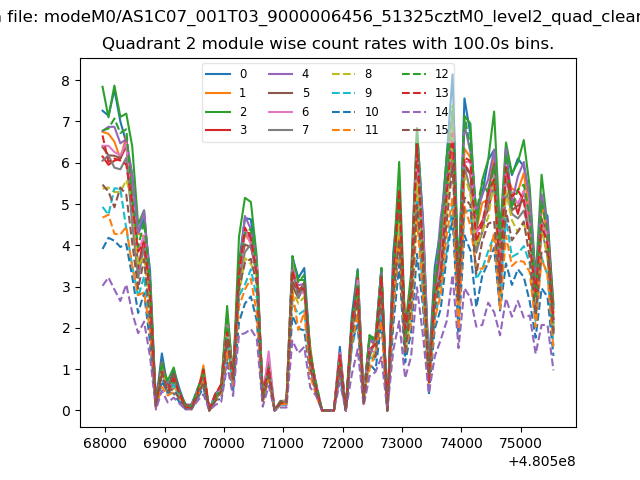
| Module-wise count rates for Quadrant B Data is divided into 100 sec bins |
 |
 |
| Module-wise count rates for Quadrant C Data is divided into 100 sec bins |
 |
 |
| Module-wise count rates for Quadrant D Data is divided into 100 sec bins |
 |
 |
| Parameter | Plot |
|---|---|
| CZT HV Monitor | 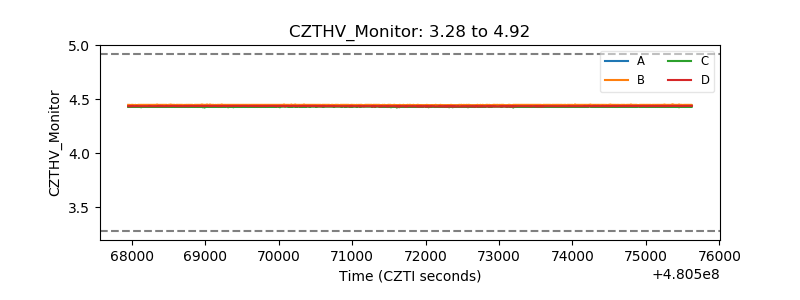 |
| D_VDD | 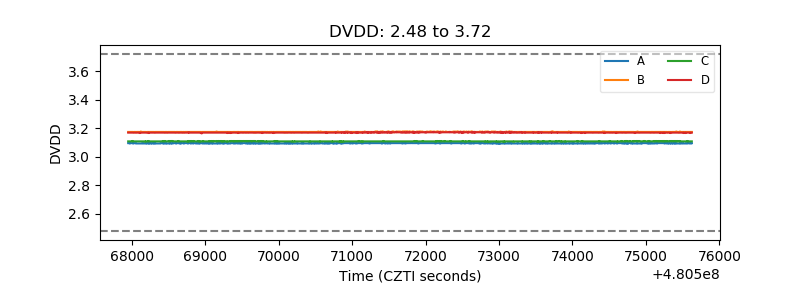 |
| Temperature 1 | 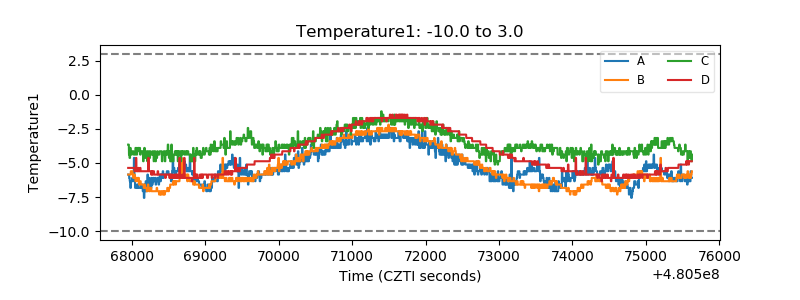 |
| Veto HV Monitor | 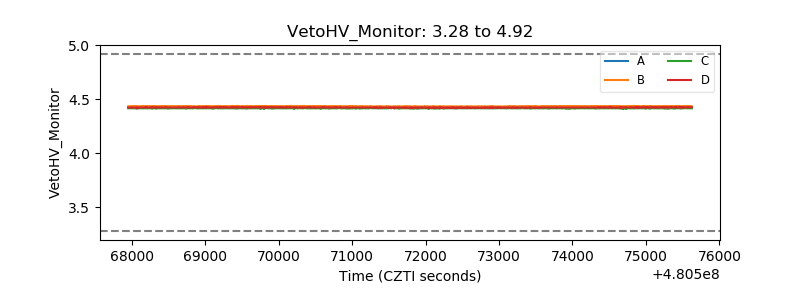 |
| Veto LLD | 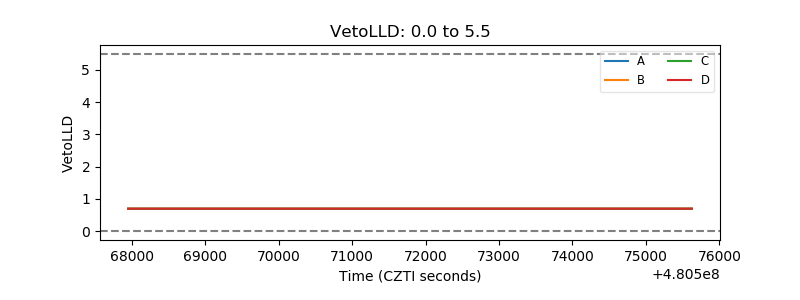 |
| Alpha Counter | 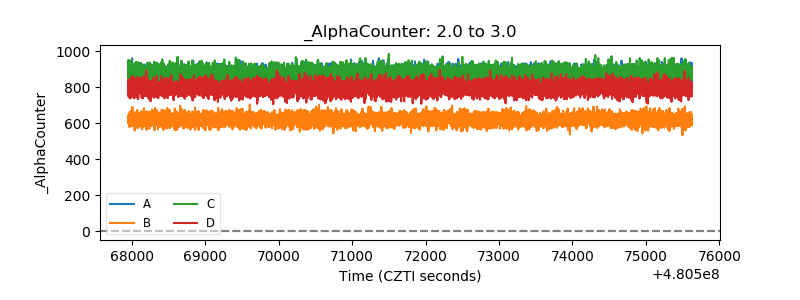 |
| _CPM_Rate | 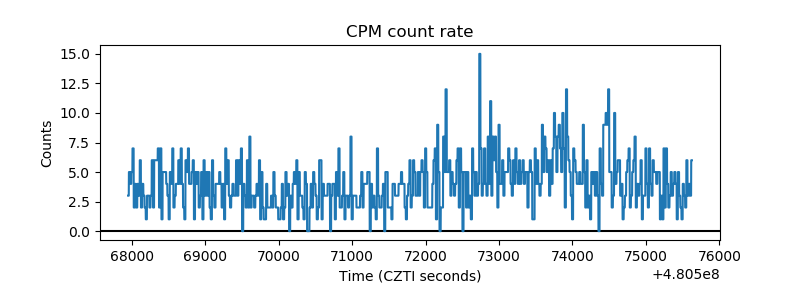 |
| CZT Counter | 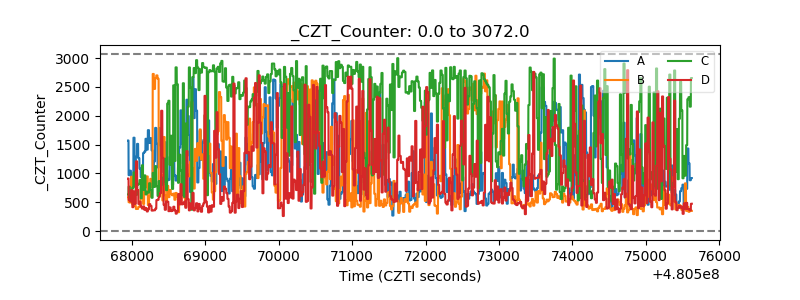 |
| +2.5 Volts monitor | 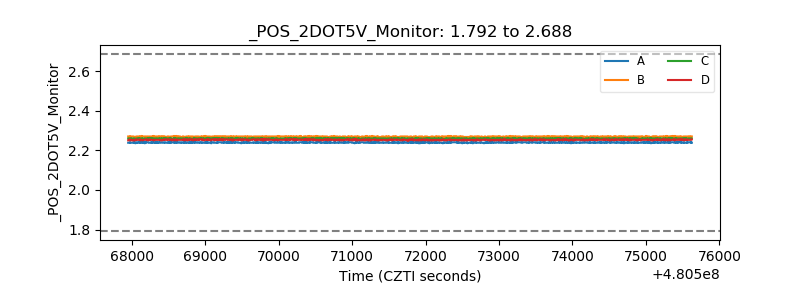 |
| +5 Volts monitor | 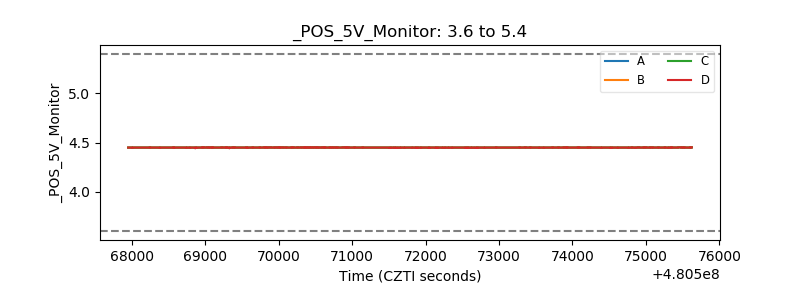 |
| _ROLL_ROT | 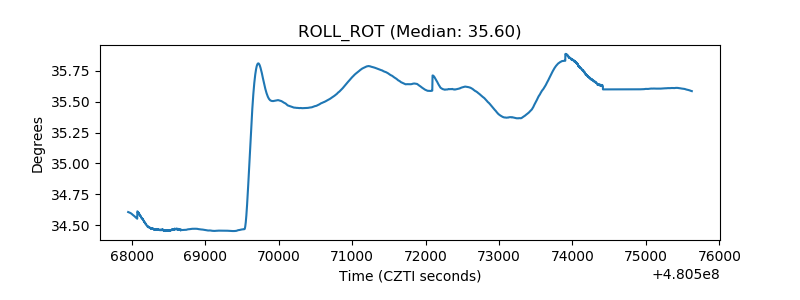 |
| _Roll_DEC | 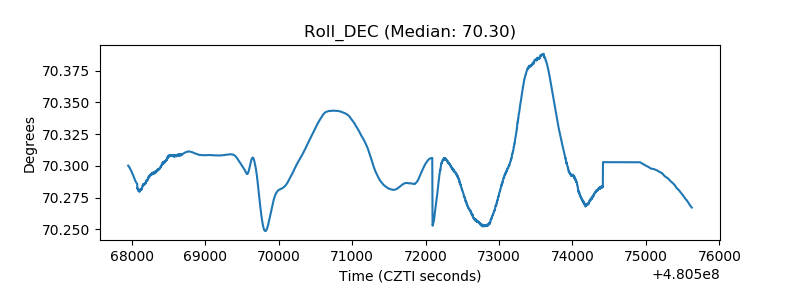 |
| _Roll_RA | 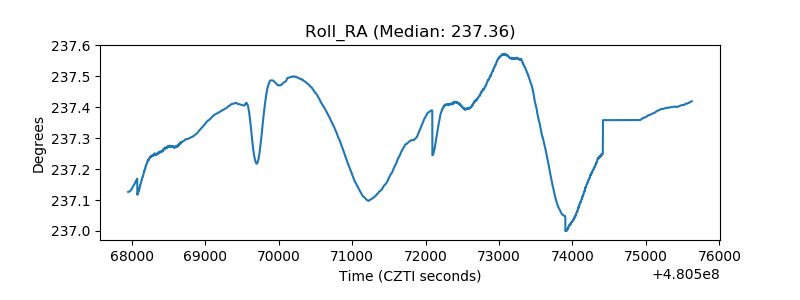 |
| Veto Counter | 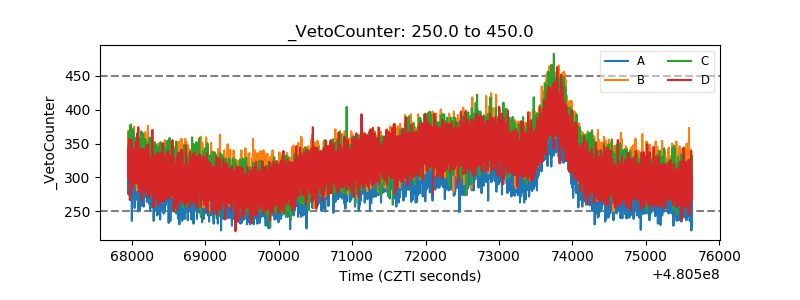 |