| Param | Original file | Final file |
|---|---|---|
| Filename | modeM0/AS1C07_001T03_9000006456_51326cztM0_level2.fits | modeM0/AS1C07_001T03_9000006456_51326cztM0_level2_quad_clean.evt |
| Size (bytes) | 746,628,480 | 91,543,680 |
| Size | 712.0 MB | 87.3 MB |
| Events in quadrant A | 6,335,823 | 613,563 |
| Events in quadrant B | 4,171,192 | 676,774 |
| Events in quadrant C | 9,872,257 | 459,678 |
| Events in quadrant D | 6,721,588 | 537,135 |
| Mode SS | |||
|---|---|---|---|
| Quadrant | BADHDUFLAG | Total packets | Discarded packets |
| A | 0 | 140 | 0 |
| B | 0 | 140 | 0 |
| C | 0 | 140 | 0 |
| D | 0 | 140 | 0 |
| Mode M0 | |||
|---|---|---|---|
| Quadrant | BADHDUFLAG | Total packets | Discarded packets |
| A | 0 | 23795 | 0 |
| B | 0 | 17275 | 0 |
| C | 0 | 34130 | 0 |
| D | 0 | 24901 | 0 |
| Quadrant | Total seconds | Saturated seconds | Saturation percentage |
|---|---|---|---|
| A | 6949 | 218 | 3.137142% |
| B | 6949 | 198 | 2.849331% |
| C | 6949 | 2161 | 31.098000% |
| D | 6950 | 680 | 9.784173% |
Noise dominated data is calculated using 1-second bins in cleaned event files. If a bin has >2000 counts, and if more than 50% of those come from <1% of pixels, then it is considered to be noise-dominated and hence unusable.
| Quadrant | # 1 sec bins | Bins with >0 counts | Bins with >2000 counts | High rate bins dominated by noise | Noise dominated (total time) | Noise dominated (detector-on time) | Marked lightcurve |
|---|---|---|---|---|---|---|---|
| A | 6949 | 6949 | 163 | 163 | 2.35% | 2.35% | 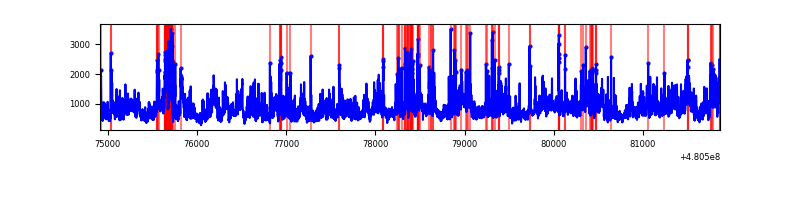 |
| B | 6949 | 6949 | 154 | 154 | 2.22% | 2.22% | 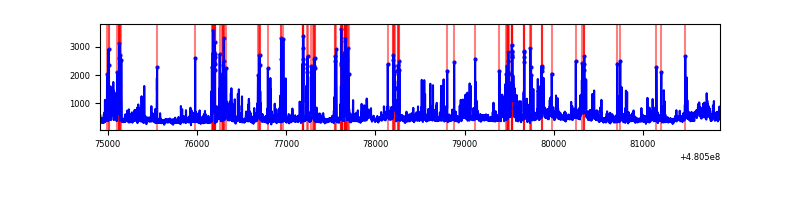 |
| C | 6949 | 6949 | 1960 | 1960 | 28.21% | 28.21% | 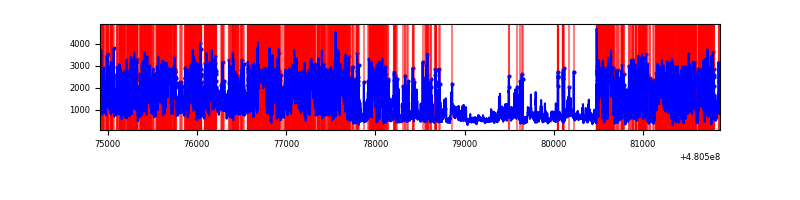 |
| D | 6950 | 6950 | 710 | 710 | 10.22% | 10.22% |  |
Top three noisy pixels from each quadrant. If the there are fewer than three noisy pixels in the level2.evt file, extra rows are filled as -1
| Pixel properties | Quadrant properties | ||||||
|---|---|---|---|---|---|---|---|
| Quadrant | DetID | PixID | Counts | Sigma | Mean | Median | Sigma |
| A | 12 | 3 | 1904778 | 10738.19 | 696 | 678 | 177.3 |
| A | 4 | 175 | 428615 | 2413.36 | 696 | 678 | 177.3 |
| A | 12 | 250 | 341060 | 1919.59 | 696 | 678 | 177.3 |
| B | 5 | 185 | 444800 | 2972.24 | 694 | 670 | 149.4 |
| B | 10 | 254 | 176094 | 1173.99 | 694 | 670 | 149.4 |
| B | 4 | 81 | 148568 | 989.78 | 694 | 670 | 149.4 |
| C | 4 | 12 | 2887136 | 17966.77 | 580 | 576 | 160.7 |
| C | 15 | 205 | 2631851 | 16377.81 | 580 | 576 | 160.7 |
| C | 3 | 233 | 531011 | 3301.58 | 580 | 576 | 160.7 |
| D | 11 | 176 | 1432577 | 7931.19 | 652 | 630 | 180.5 |
| D | 7 | 60 | 507600 | 2807.98 | 652 | 630 | 180.5 |
| D | 8 | 176 | 474931 | 2627.03 | 652 | 630 | 180.5 |
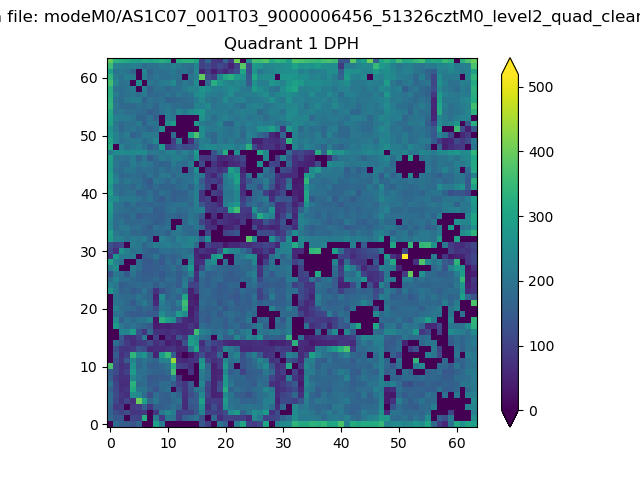
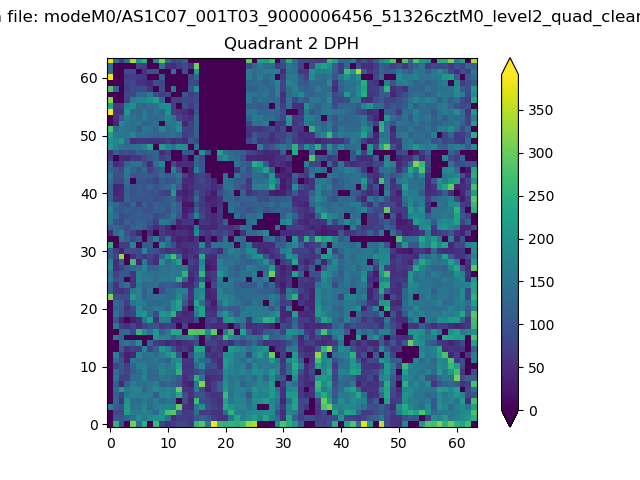
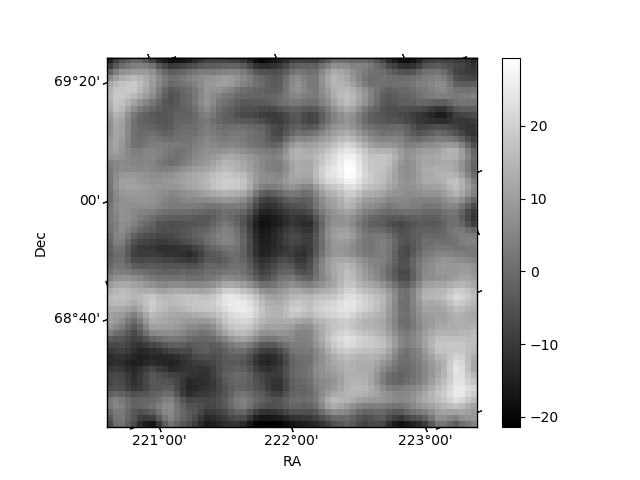
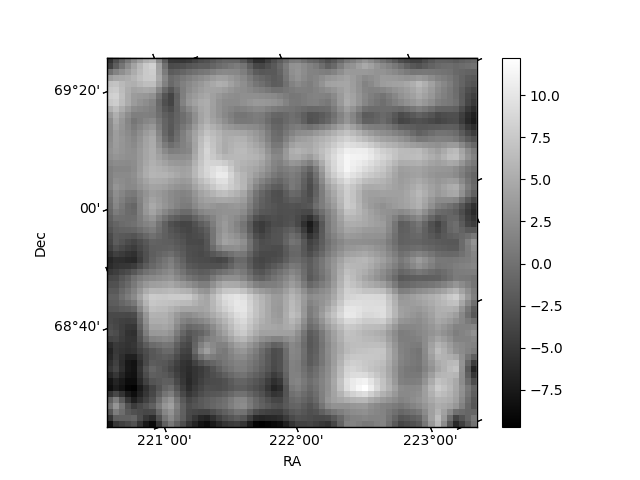
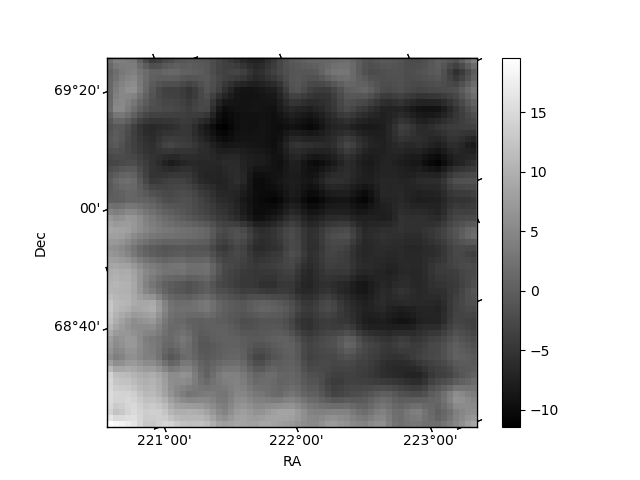
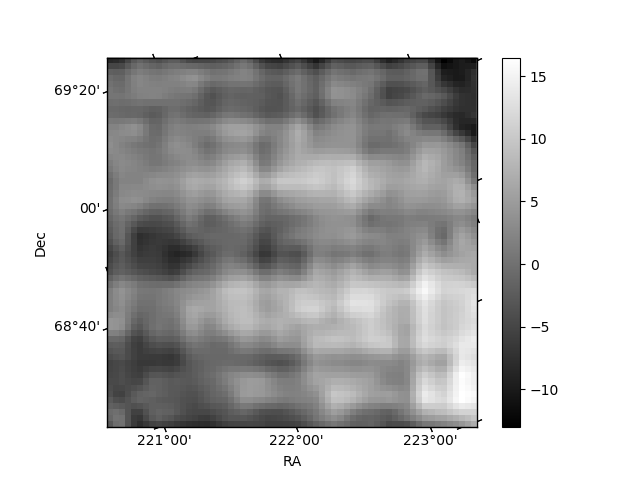
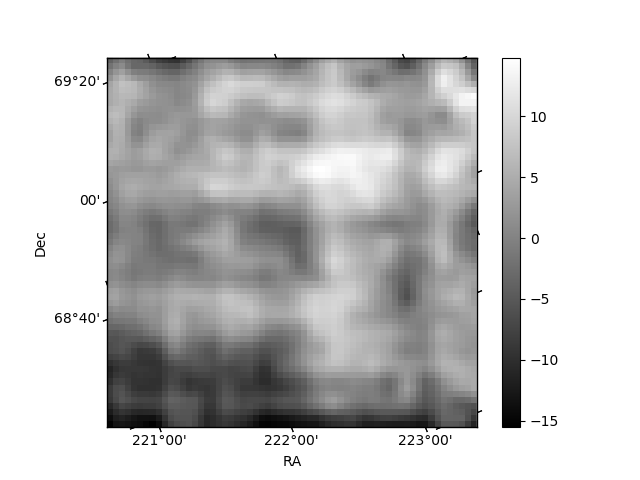
Histogram calculated using DETX and DETY for each event in the final _common_clean file
| Quadrant A | 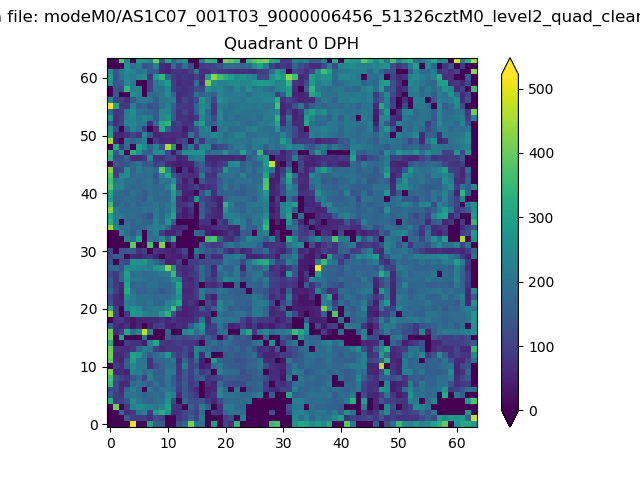 |
 |
Quadrant B |
|---|---|---|---|
| Quadrant D | 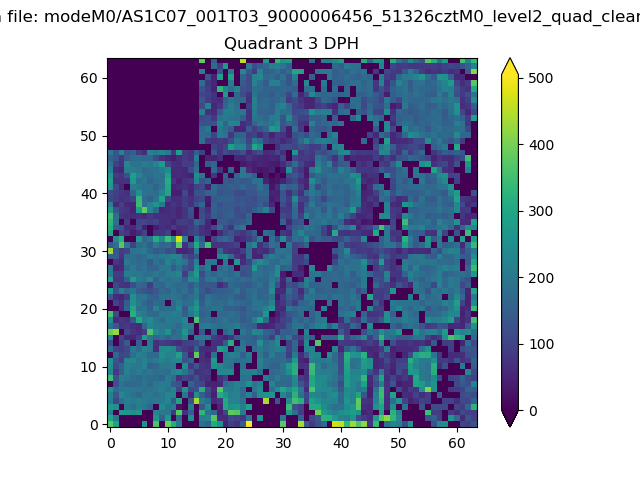 |
 |
Quadrant C |
| Plot type | Count rate plots | Images |
|---|---|---|
| Comparison with Poisson distribution Blue bars denote a histogram of data divided into 1 sec bins. Red curve is a Poisson curve with rate = median count rate of data. |
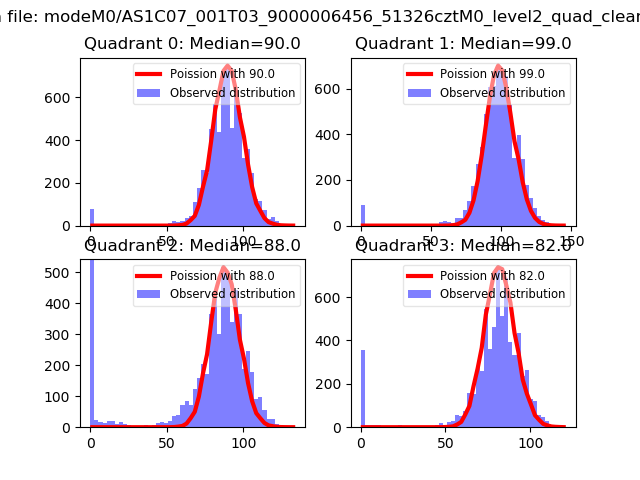 |
 |
| Quadrant-wise count rates Data is divided into 100 sec bins |
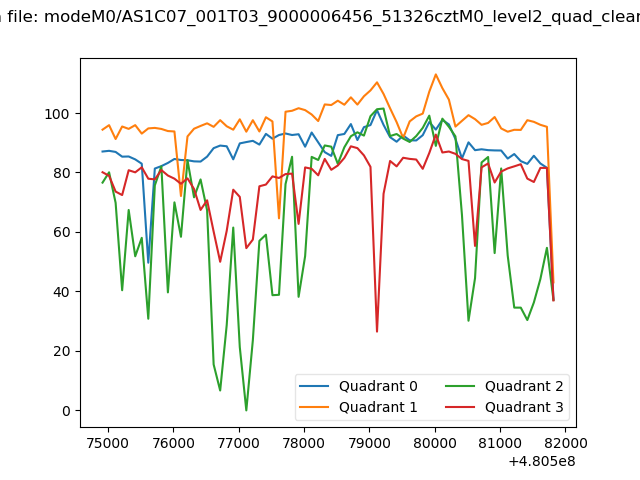 |
|
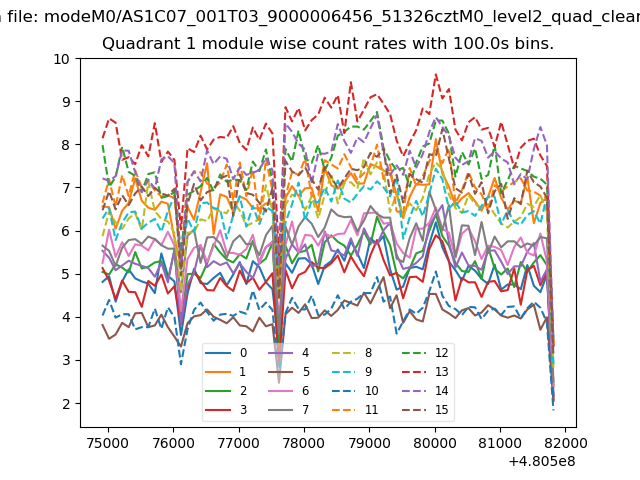
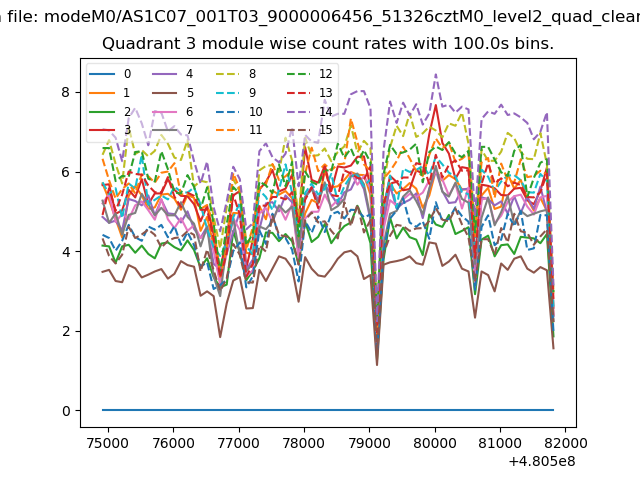
| Module-wise count rates for Quadrant A Data is divided into 100 sec bins |
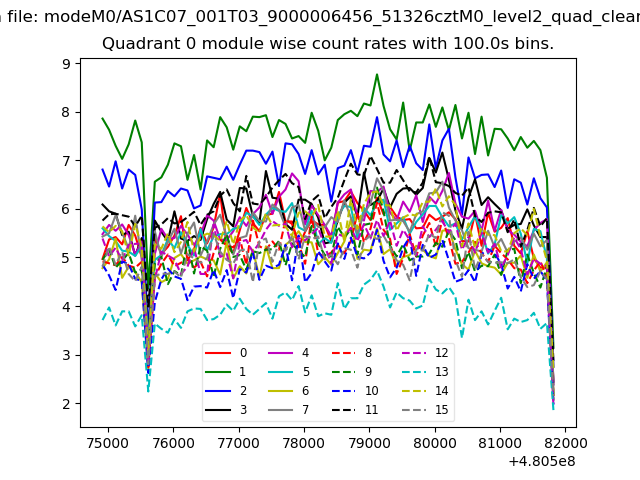 |
 |
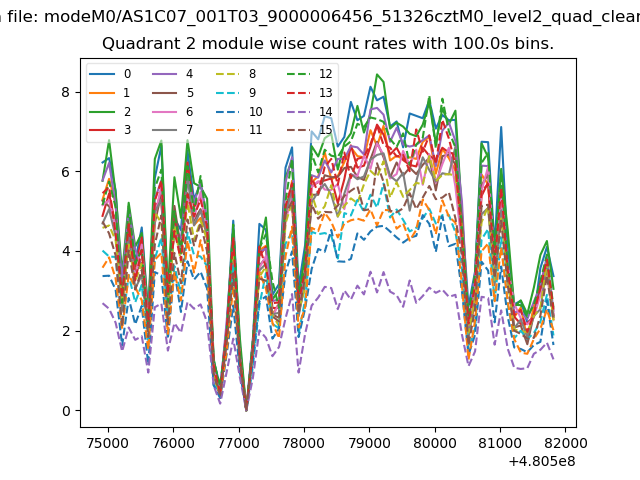
| Module-wise count rates for Quadrant B Data is divided into 100 sec bins |
 |
 |
| Module-wise count rates for Quadrant C Data is divided into 100 sec bins |
 |
 |
| Module-wise count rates for Quadrant D Data is divided into 100 sec bins |
 |
 |
| Parameter | Plot |
|---|---|
| CZT HV Monitor | 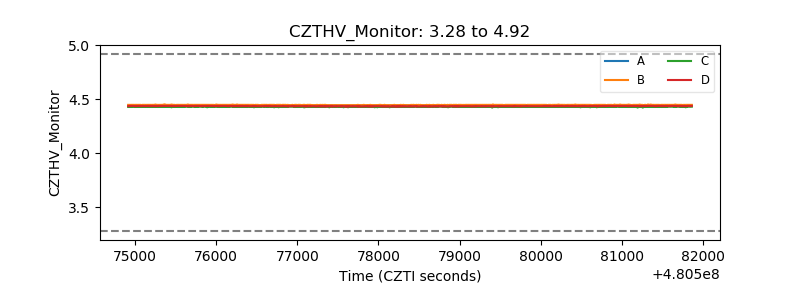 |
| D_VDD | 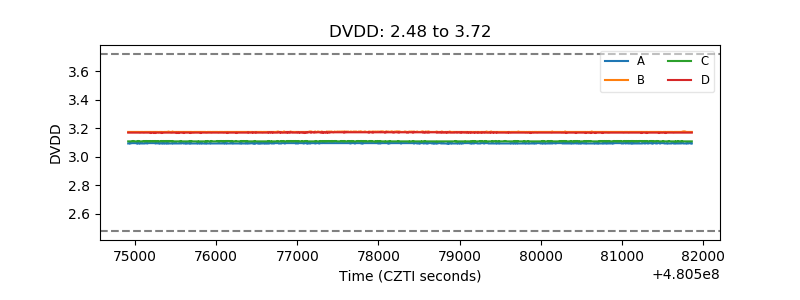 |
| Temperature 1 | 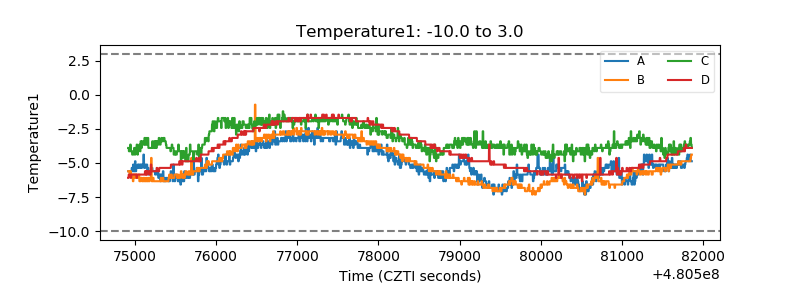 |
| Veto HV Monitor | 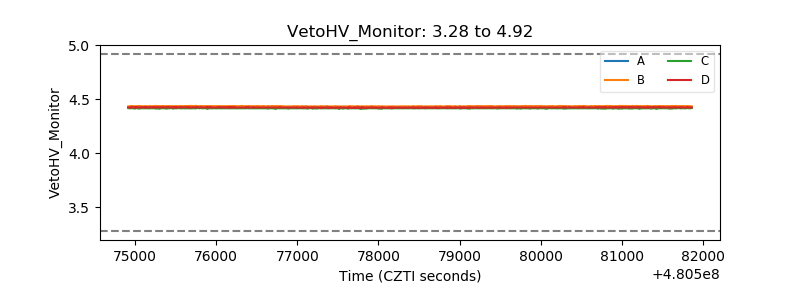 |
| Veto LLD | 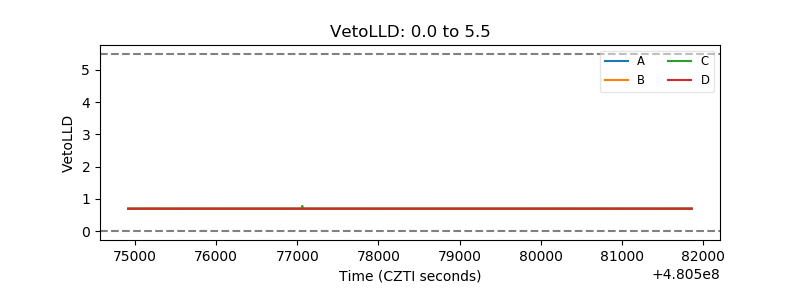 |
| Alpha Counter | 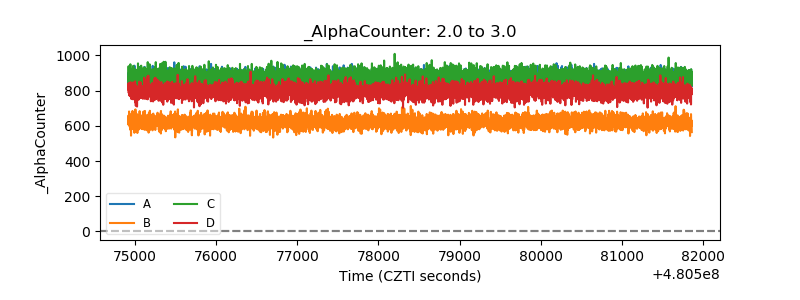 |
| _CPM_Rate | 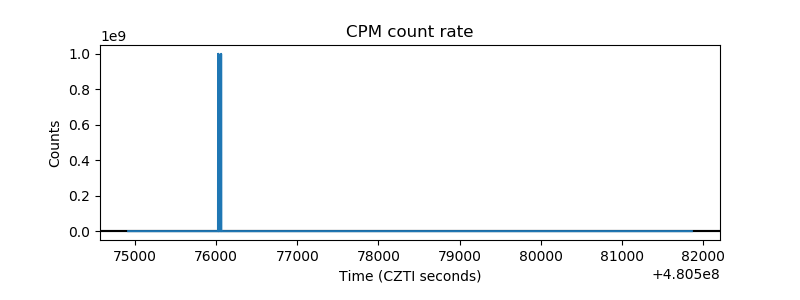 |
| CZT Counter | 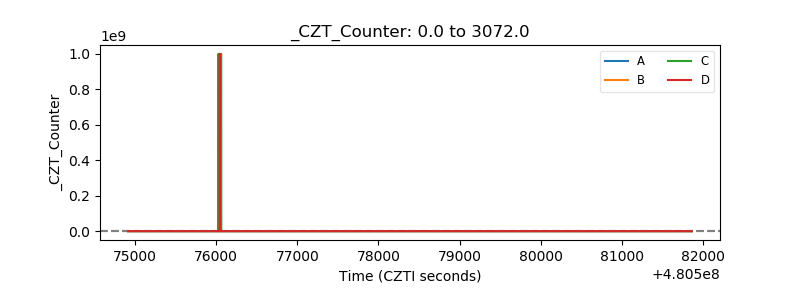 |
| +2.5 Volts monitor | 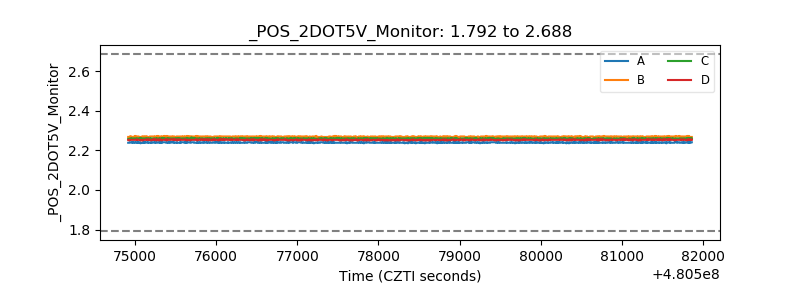 |
| +5 Volts monitor | 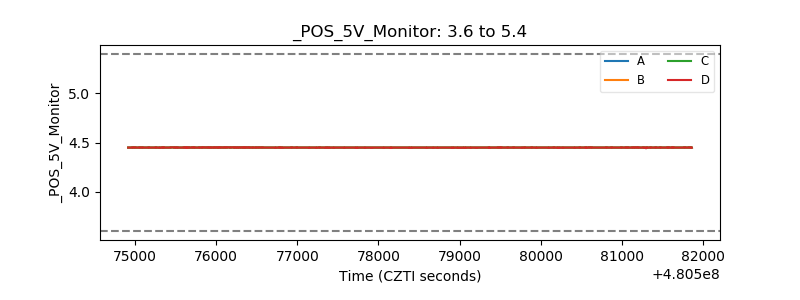 |
| _ROLL_ROT | 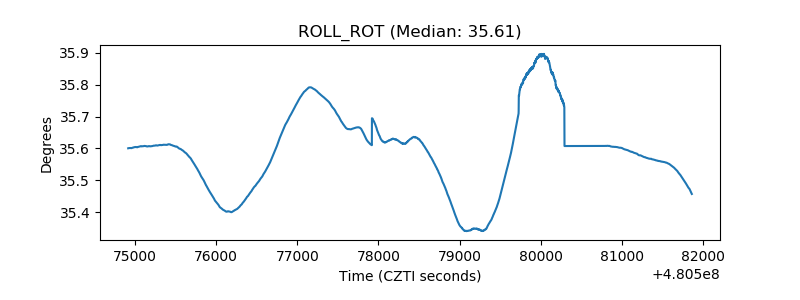 |
| _Roll_DEC | 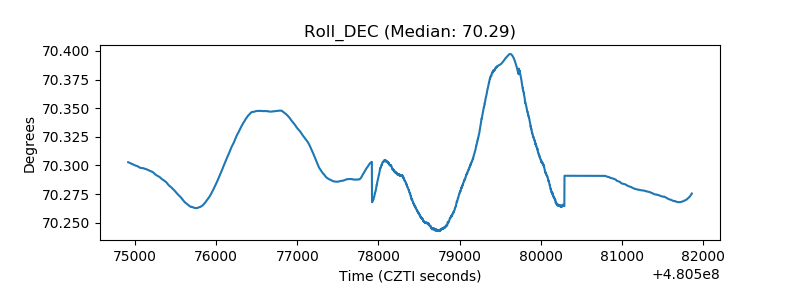 |
| _Roll_RA | 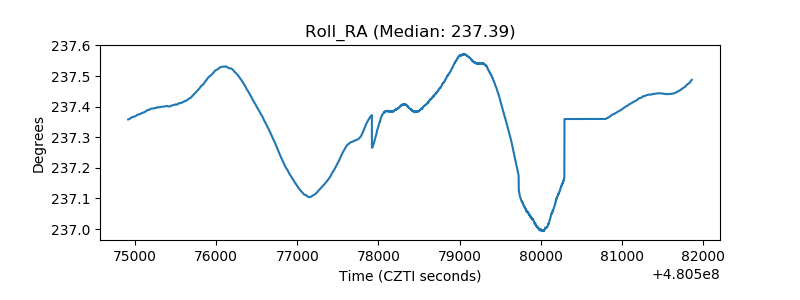 |
| Veto Counter | 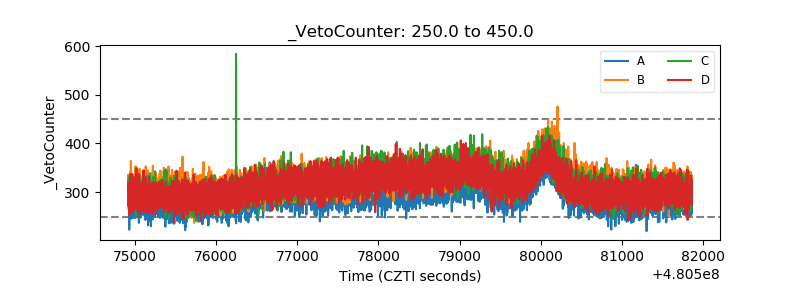 |