| Param | Original file | Final file |
|---|---|---|
| Filename | modeM0/AS1C07_001T03_9000006456_51329cztM0_level2.fits | modeM0/AS1C07_001T03_9000006456_51329cztM0_level2_quad_clean.evt |
| Size (bytes) | 2,003,063,040 | 243,627,840 |
| Size | 1.9 GB | 232.3 MB |
| Events in quadrant A | 20,959,073 | 1,533,146 |
| Events in quadrant B | 14,386,139 | 1,769,826 |
| Events in quadrant C | 15,952,367 | 1,533,770 |
| Events in quadrant D | 21,375,405 | 1,219,131 |
| Mode SS | |||
|---|---|---|---|
| Quadrant | BADHDUFLAG | Total packets | Discarded packets |
| A | 0 | 388 | 0 |
| B | 0 | 388 | 0 |
| C | 0 | 388 | 0 |
| D | 0 | 388 | 0 |
| Mode M0 | |||
|---|---|---|---|
| Quadrant | BADHDUFLAG | Total packets | Discarded packets |
| A | 0 | 75821 | 3 |
| B | 0 | 56059 | 3 |
| C | 0 | 60812 | 3 |
| D | 0 | 76928 | 3 |
| Mode M9 | |||
|---|---|---|---|
| Quadrant | BADHDUFLAG | Total packets | Discarded packets |
| A | 0 | 6 | 0 |
| B | 0 | 6 | 0 |
| C | 0 | 6 | 0 |
| D | 0 | 6 | 0 |
| Quadrant | Total seconds | Saturated seconds | Saturation percentage |
|---|---|---|---|
| A | 19145 | 2105 | 10.995038% |
| B | 19145 | 1435 | 7.495430% |
| C | 19146 | 1845 | 9.636478% |
| D | 19146 | 3770 | 19.690797% |
Noise dominated data is calculated using 1-second bins in cleaned event files. If a bin has >2000 counts, and if more than 50% of those come from <1% of pixels, then it is considered to be noise-dominated and hence unusable.
| Quadrant | # 1 sec bins | Bins with >0 counts | Bins with >2000 counts | High rate bins dominated by noise | Noise dominated (total time) | Noise dominated (detector-on time) | Marked lightcurve |
|---|---|---|---|---|---|---|---|
| A | 19835 | 19146 | 1427 | 1427 | 7.19% | 7.45% | 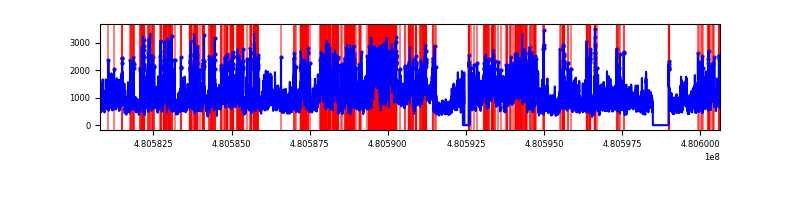 |
| B | 19835 | 19145 | 777 | 777 | 3.92% | 4.06% | 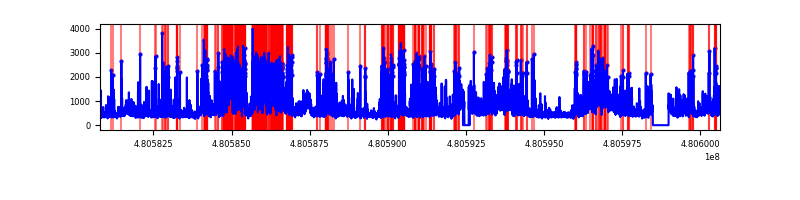 |
| C | 19836 | 19148 | 1430 | 1430 | 7.21% | 7.47% | 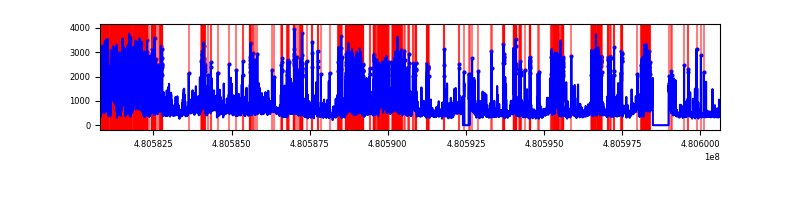 |
| D | 19836 | 19146 | 3539 | 3539 | 17.84% | 18.48% | 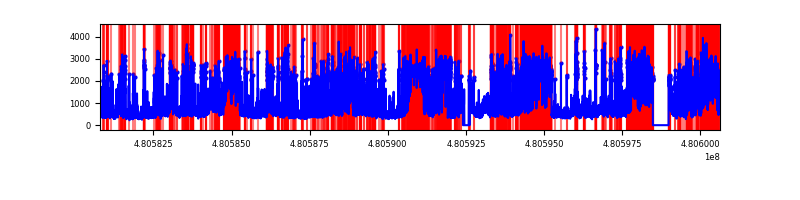 |
Top three noisy pixels from each quadrant. If the there are fewer than three noisy pixels in the level2.evt file, extra rows are filled as -1
| Pixel properties | Quadrant properties | ||||||
|---|---|---|---|---|---|---|---|
| Quadrant | DetID | PixID | Counts | Sigma | Mean | Median | Sigma |
| A | 12 | 3 | 6313720 | 13171.49 | 1935 | 1881 | 479.2 |
| A | 12 | 250 | 2959638 | 6172.22 | 1935 | 1881 | 479.2 |
| A | 9 | 160 | 1025773 | 2136.65 | 1935 | 1881 | 479.2 |
| B | 10 | 254 | 2005079 | 4844.11 | 1946 | 1875 | 413.5 |
| B | 12 | 32 | 1888884 | 4563.13 | 1946 | 1875 | 413.5 |
| B | 5 | 185 | 734318 | 1771.18 | 1946 | 1875 | 413.5 |
| C | 15 | 205 | 4025404 | 7711.09 | 1896 | 1878 | 521.8 |
| C | 12 | 112 | 804400 | 1538.03 | 1896 | 1878 | 521.8 |
| C | 13 | 3 | 713426 | 1363.68 | 1896 | 1878 | 521.8 |
| D | 11 | 176 | 4307656 | 8756.06 | 1766 | 1703 | 491.8 |
| D | 3 | 12 | 3248399 | 6602.09 | 1766 | 1703 | 491.8 |
| D | 7 | 60 | 2719191 | 5525.95 | 1766 | 1703 | 491.8 |
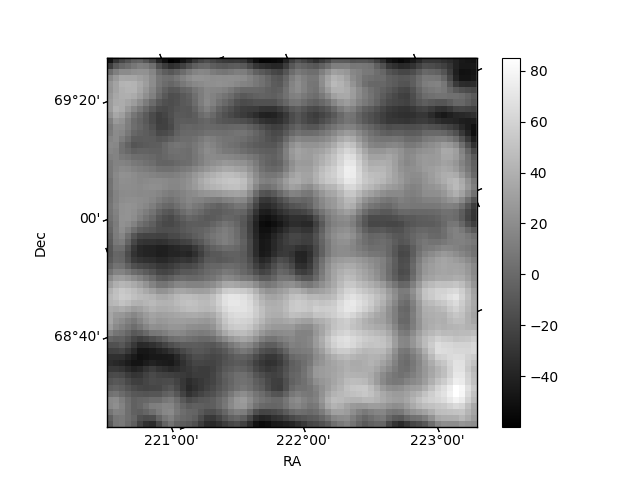
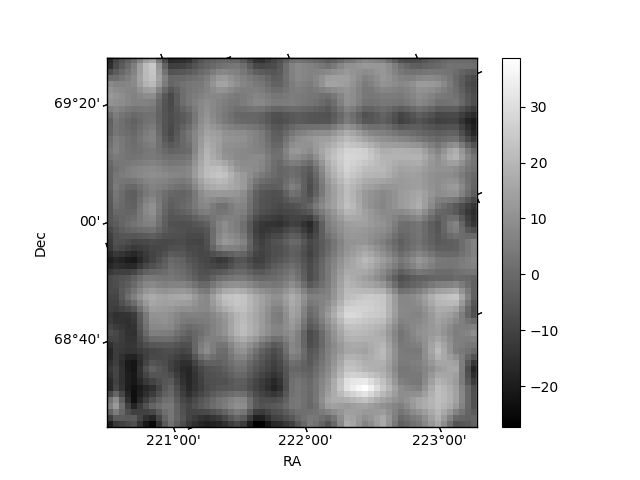
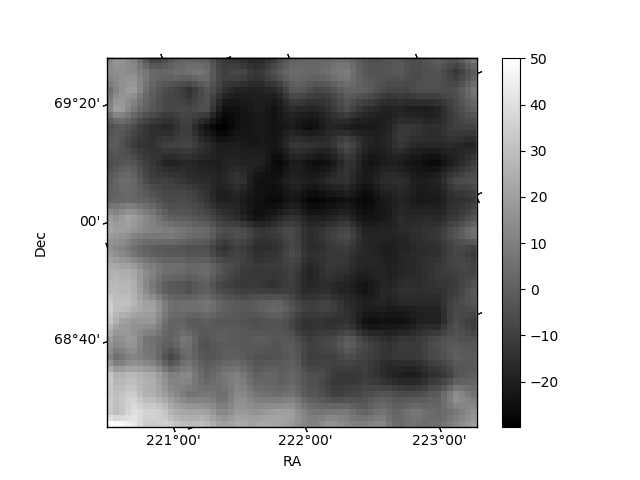
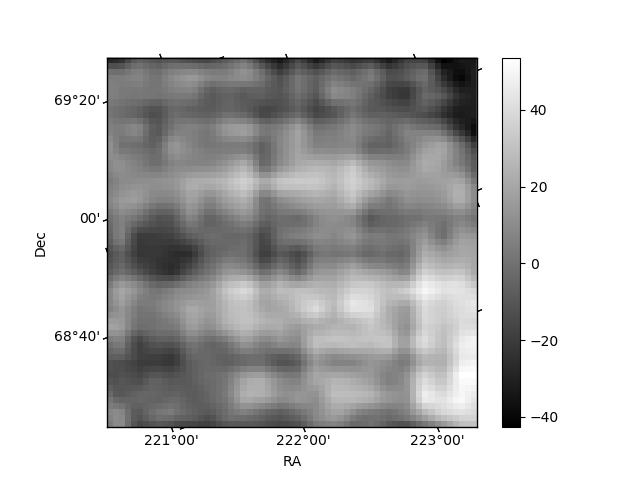
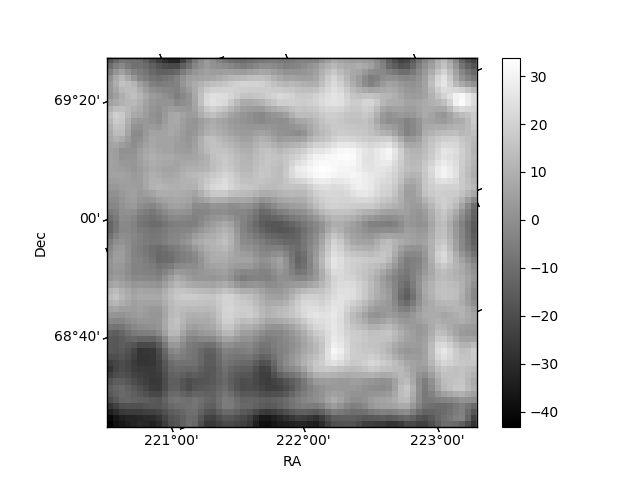
Histogram calculated using DETX and DETY for each event in the final _common_clean file
| Quadrant A | 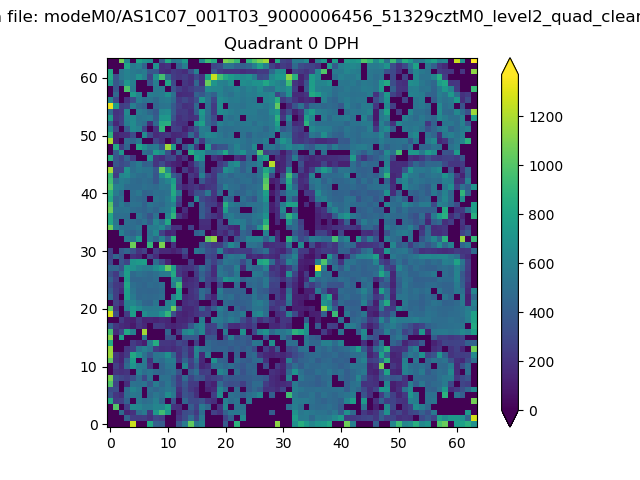 |
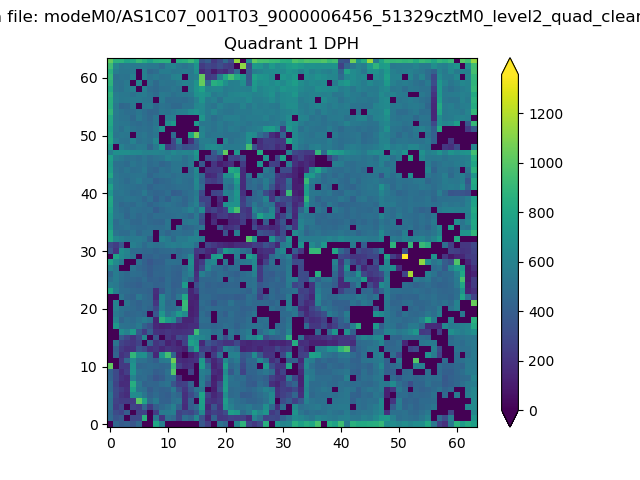 |
Quadrant B |
|---|---|---|---|
| Quadrant D | 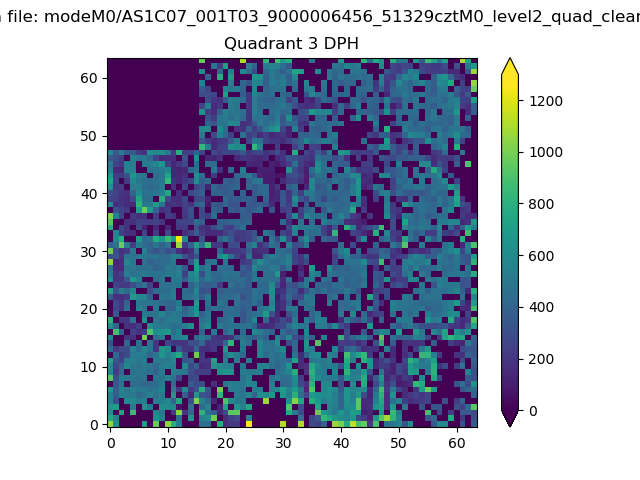 |
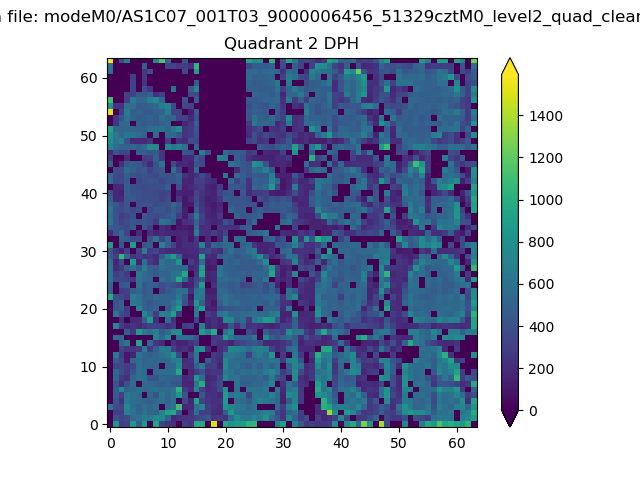 |
Quadrant C |
| Plot type | Count rate plots | Images |
|---|---|---|
| Comparison with Poisson distribution Blue bars denote a histogram of data divided into 1 sec bins. Red curve is a Poisson curve with rate = median count rate of data. |
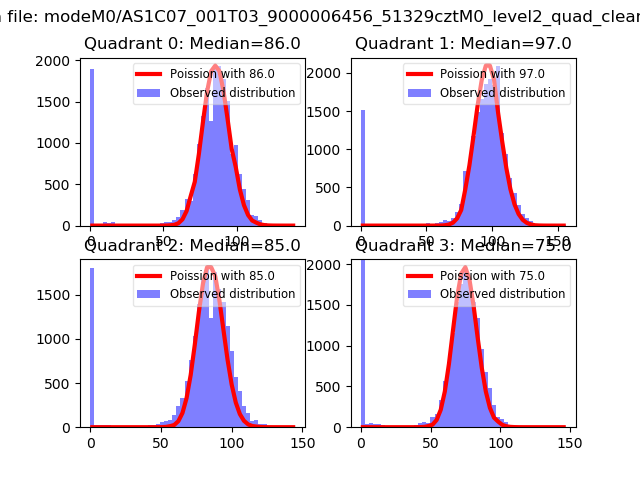 |
 |
| Quadrant-wise count rates Data is divided into 100 sec bins |
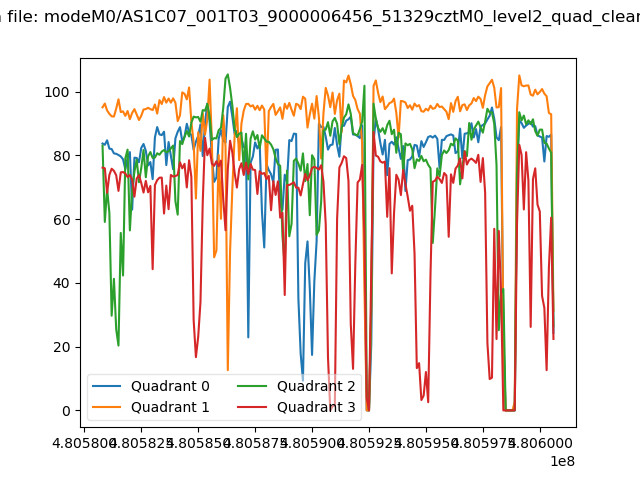 |
|
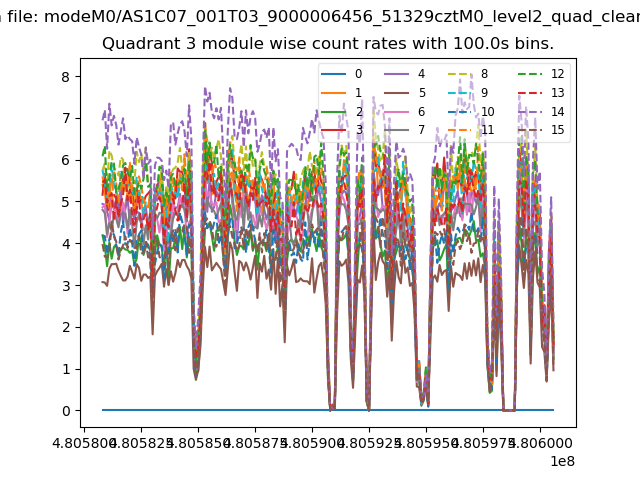
| Module-wise count rates for Quadrant A Data is divided into 100 sec bins |
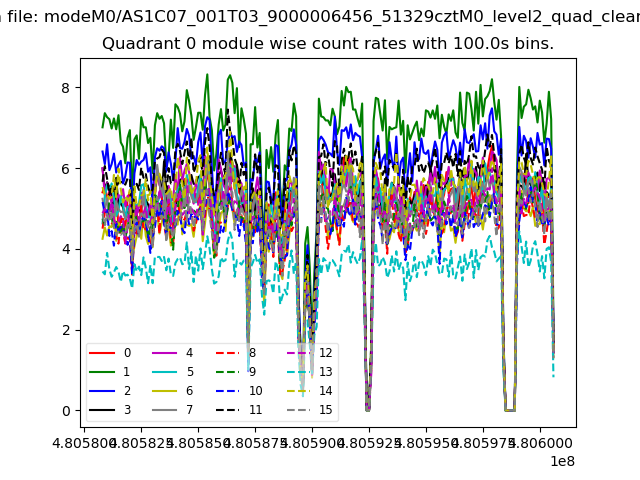 |
 |
| Module-wise count rates for Quadrant B Data is divided into 100 sec bins |
 |
 |
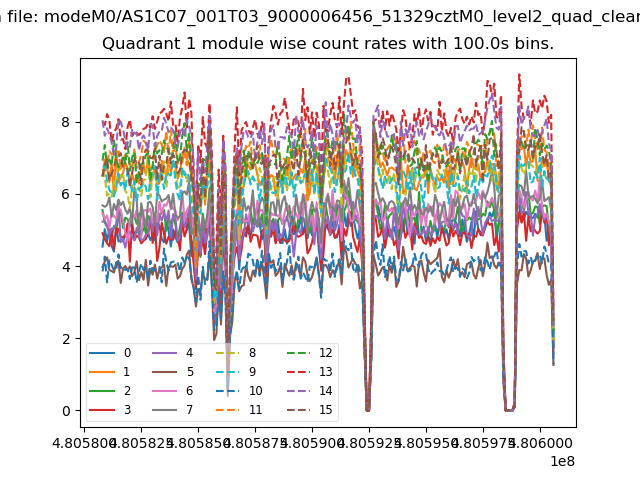
| Module-wise count rates for Quadrant C Data is divided into 100 sec bins |
 |
 |
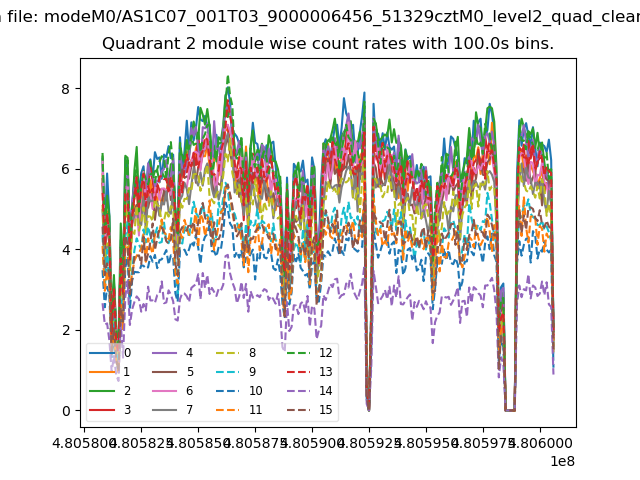
| Module-wise count rates for Quadrant D Data is divided into 100 sec bins |
 |
 |
| Parameter | Plot |
|---|---|
| CZT HV Monitor | 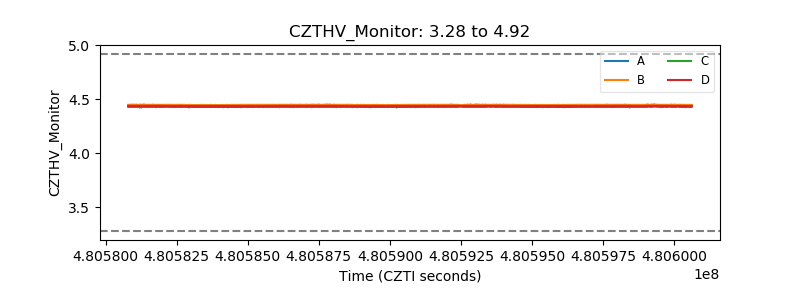 |
| D_VDD | 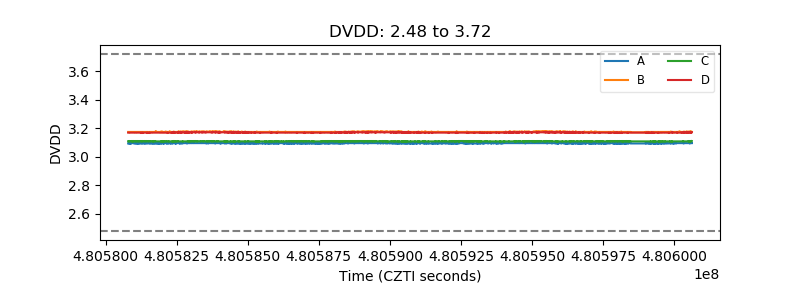 |
| Temperature 1 | 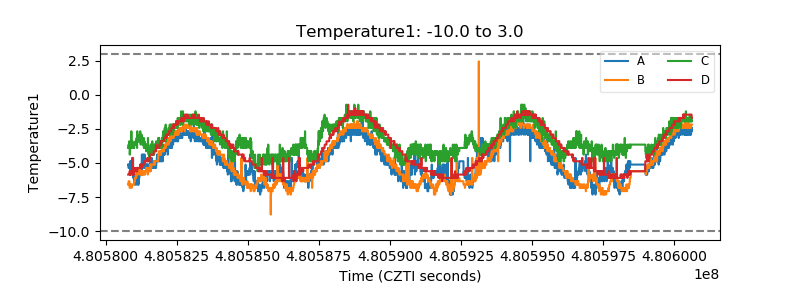 |
| Veto HV Monitor | 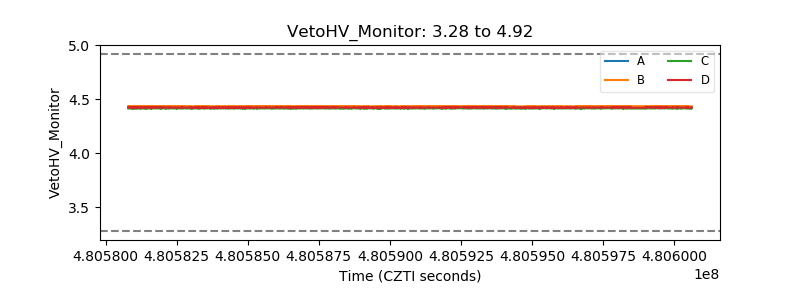 |
| Veto LLD | 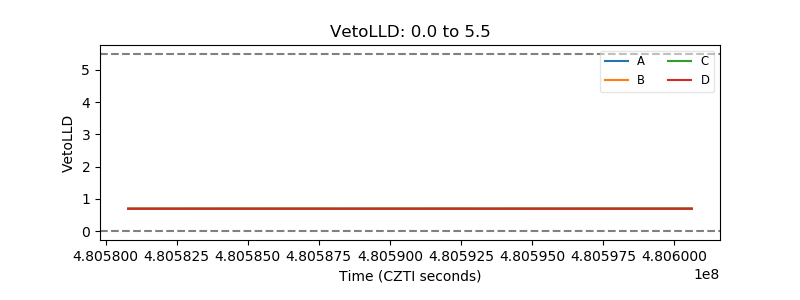 |
| Alpha Counter | 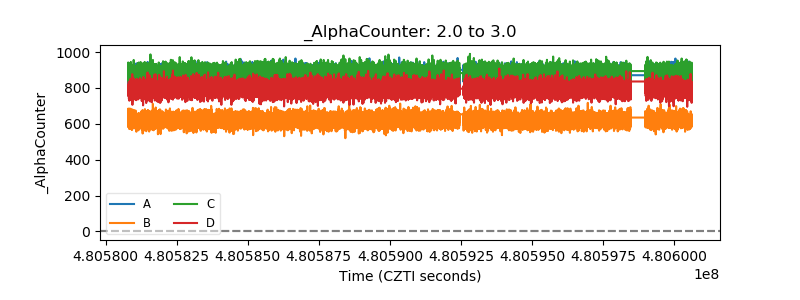 |
| _CPM_Rate | 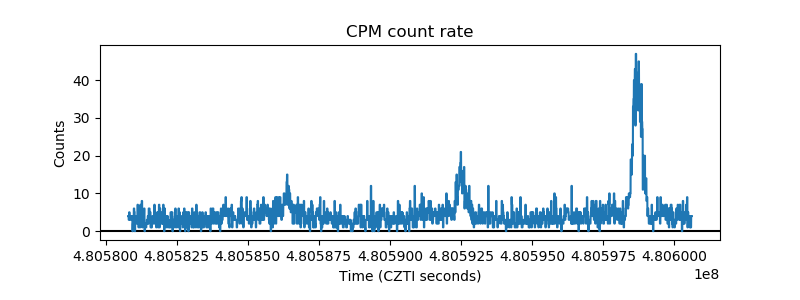 |
| CZT Counter | 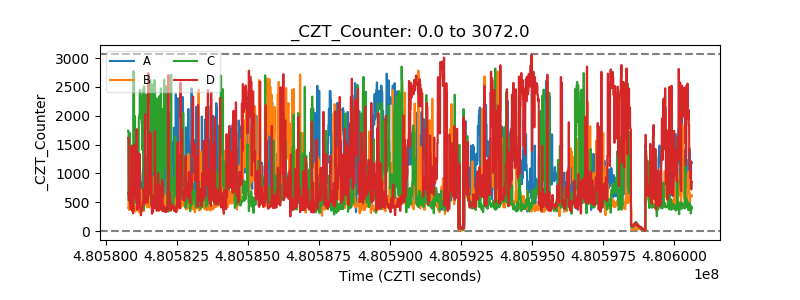 |
| +2.5 Volts monitor | 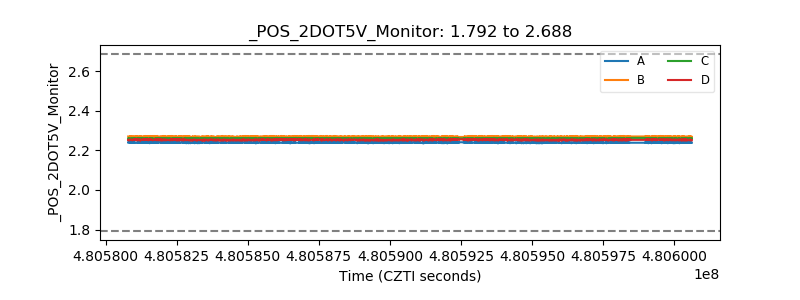 |
| +5 Volts monitor | 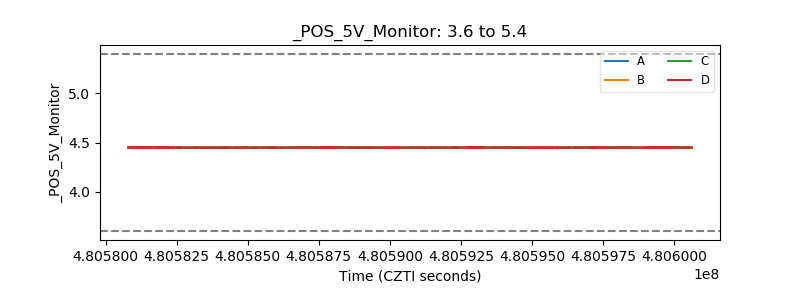 |
| _ROLL_ROT | 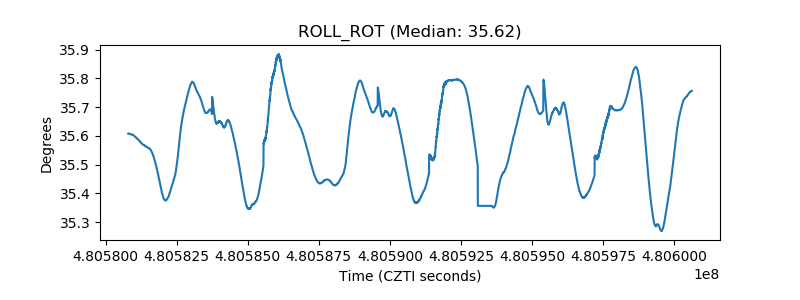 |
| _Roll_DEC | 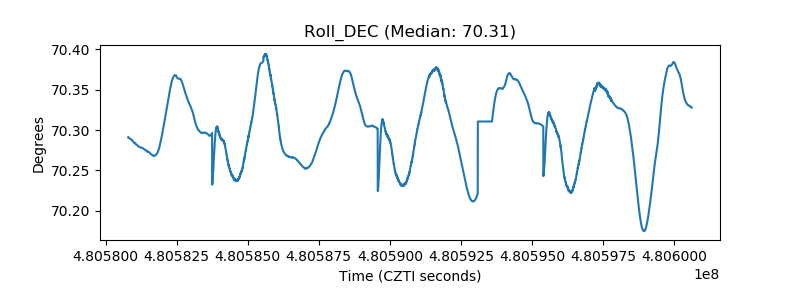 |
| _Roll_RA | 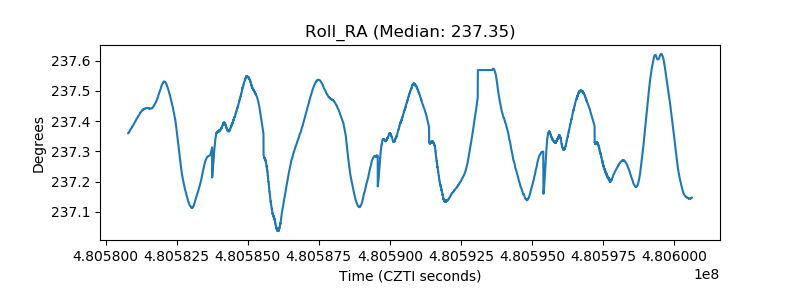 |
| Veto Counter | 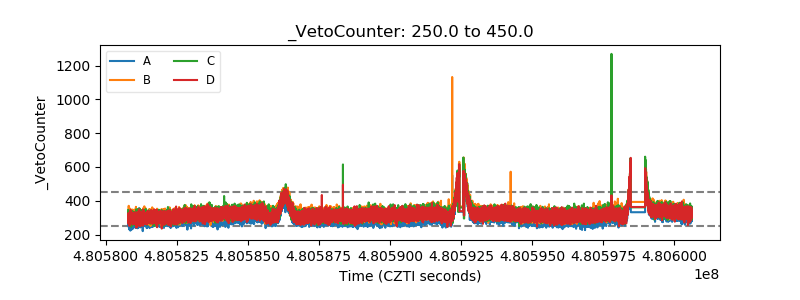 |