| Param | Original file | Final file |
|---|---|---|
| Filename | modeM0/AS1C07_001T03_9000006456_51369cztM0_level2.fits | modeM0/AS1C07_001T03_9000006456_51369cztM0_level2_quad_clean.evt |
| Size (bytes) | 1,021,973,760 | 91,336,320 |
| Size | 974.6 MB | 87.1 MB |
| Events in quadrant A | 6,947,285 | 725,531 |
| Events in quadrant B | 4,793,721 | 832,028 |
| Events in quadrant C | 16,450,403 | 3,678 |
| Events in quadrant D | 8,991,130 | 624,937 |
| Mode SS | |||
|---|---|---|---|
| Quadrant | BADHDUFLAG | Total packets | Discarded packets |
| A | 0 | 166 | 0 |
| B | 0 | 166 | 0 |
| C | 0 | 166 | 0 |
| D | 0 | 166 | 0 |
| Mode M0 | |||
|---|---|---|---|
| Quadrant | BADHDUFLAG | Total packets | Discarded packets |
| A | 0 | 26364 | 0 |
| B | 0 | 20322 | 1 |
| C | 0 | 54587 | 0 |
| D | 0 | 32596 | 0 |
| Quadrant | Total seconds | Saturated seconds | Saturation percentage |
|---|---|---|---|
| A | 8338 | 574 | 6.884145% |
| B | 8337 | 224 | 2.686818% |
| C | 8337 | 8310 | 99.676142% |
| D | 8337 | 1244 | 14.921435% |
Noise dominated data is calculated using 1-second bins in cleaned event files. If a bin has >2000 counts, and if more than 50% of those come from <1% of pixels, then it is considered to be noise-dominated and hence unusable.
| Quadrant | # 1 sec bins | Bins with >0 counts | Bins with >2000 counts | High rate bins dominated by noise | Noise dominated (total time) | Noise dominated (detector-on time) | Marked lightcurve |
|---|---|---|---|---|---|---|---|
| A | 8338 | 8338 | 448 | 448 | 5.37% | 5.37% | 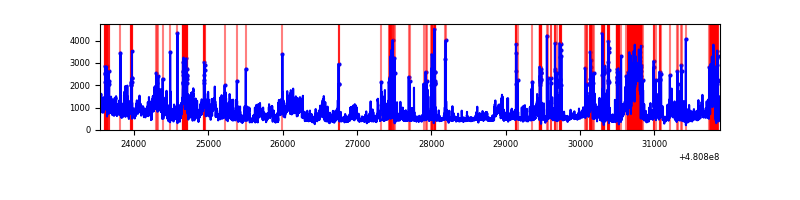 |
| B | 8337 | 8337 | 120 | 120 | 1.44% | 1.44% | 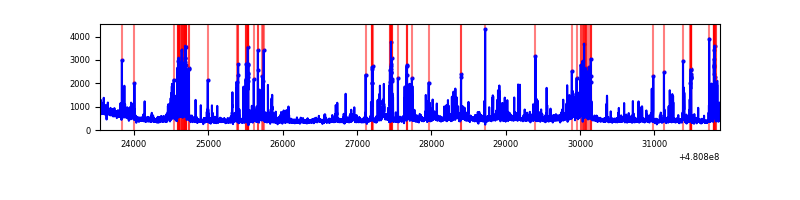 |
| C | 8336 | 8336 | 3864 | 3864 | 46.35% | 46.35% | 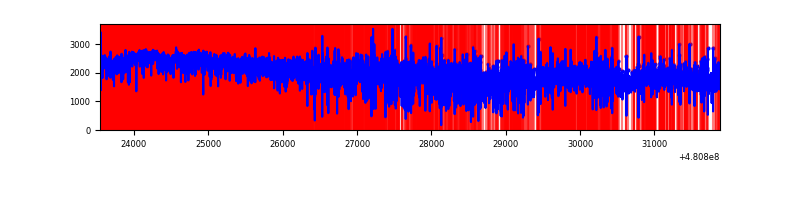 |
| D | 8337 | 8337 | 1036 | 1036 | 12.43% | 12.43% | 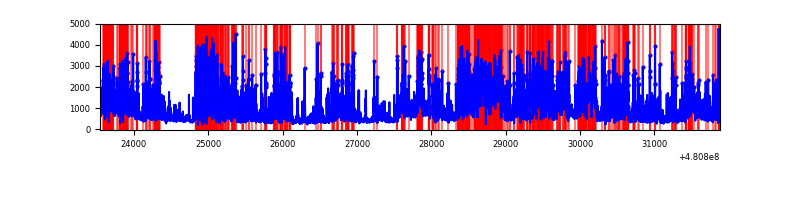 |
Top three noisy pixels from each quadrant. If the there are fewer than three noisy pixels in the level2.evt file, extra rows are filled as -1
| Pixel properties | Quadrant properties | ||||||
|---|---|---|---|---|---|---|---|
| Quadrant | DetID | PixID | Counts | Sigma | Mean | Median | Sigma |
| A | 15 | 174 | 1284400 | 6149.71 | 839 | 816 | 208.7 |
| A | 12 | 3 | 1236917 | 5922.21 | 839 | 816 | 208.7 |
| A | 4 | 175 | 183285 | 874.22 | 839 | 816 | 208.7 |
| B | 5 | 185 | 515393 | 2790.07 | 866 | 836 | 184.4 |
| B | 4 | 206 | 211874 | 1144.31 | 866 | 836 | 184.4 |
| B | 8 | 234 | 147563 | 795.59 | 866 | 836 | 184.4 |
| C | 15 | 179 | 12474264 | 184999.81 | 242 | 241 | 67.4 |
| C | 4 | 12 | 1528478 | 22664.99 | 242 | 241 | 67.4 |
| C | 0 | 177 | 1190916 | 17658.67 | 242 | 241 | 67.4 |
| D | 11 | 176 | 3842331 | 17535.84 | 789 | 761 | 219.1 |
| D | 2 | 153 | 415695 | 1894.07 | 789 | 761 | 219.1 |
| D | 10 | 172 | 407980 | 1858.86 | 789 | 761 | 219.1 |
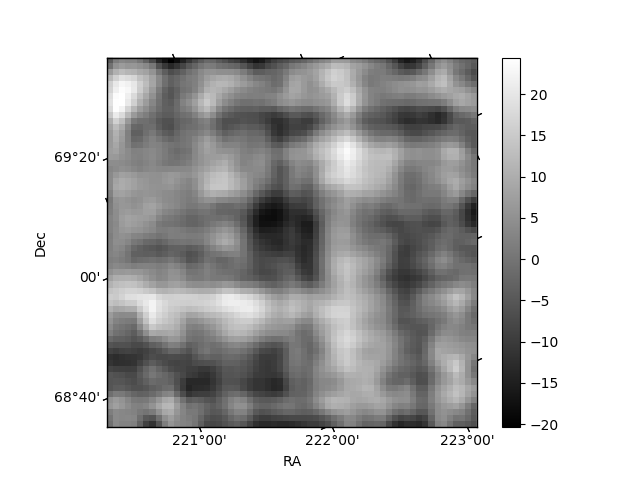
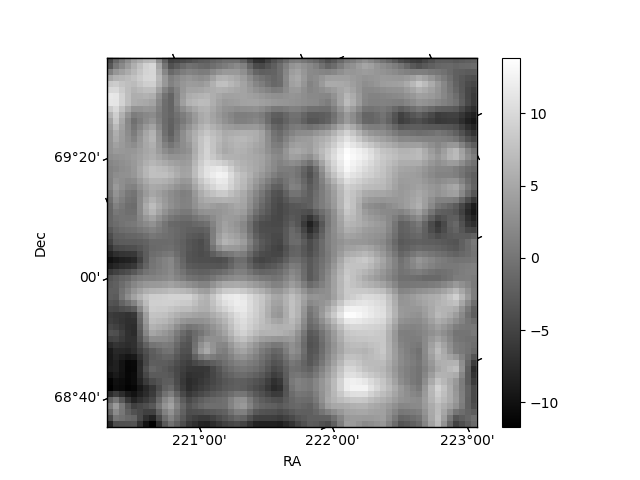
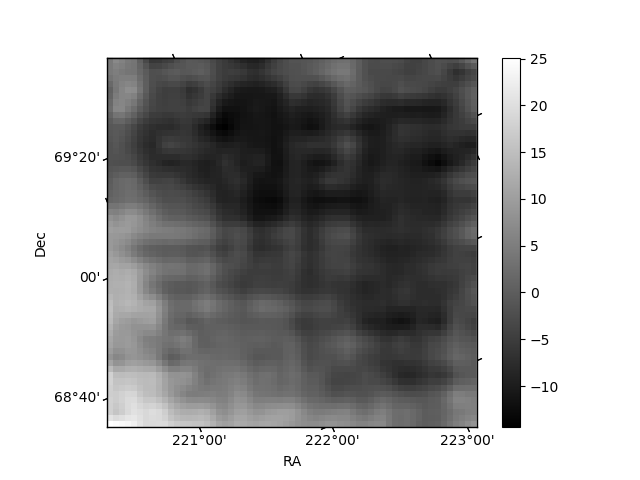
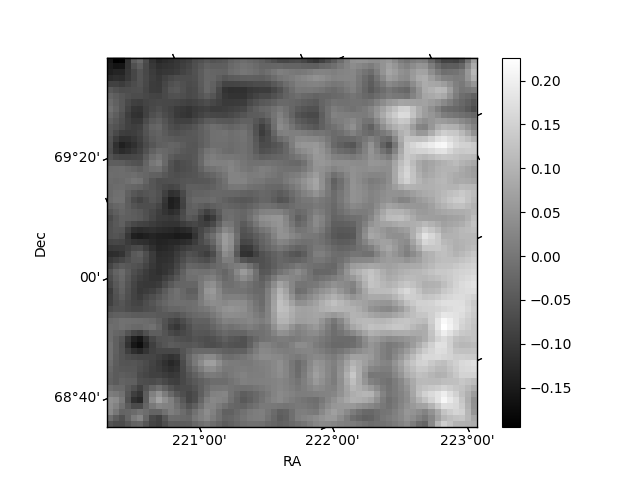
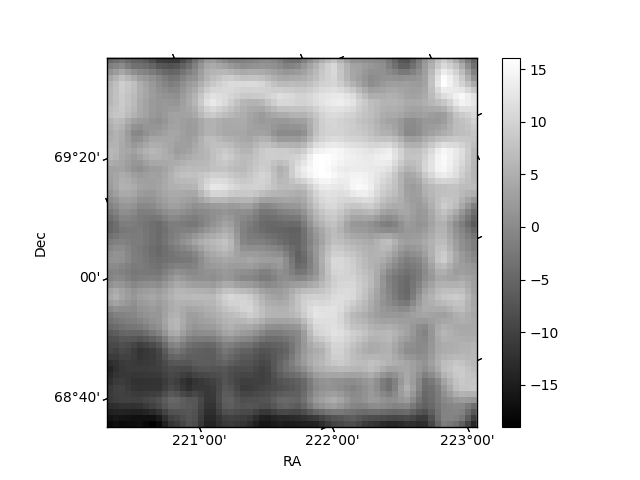
Histogram calculated using DETX and DETY for each event in the final _common_clean file
| Quadrant A | 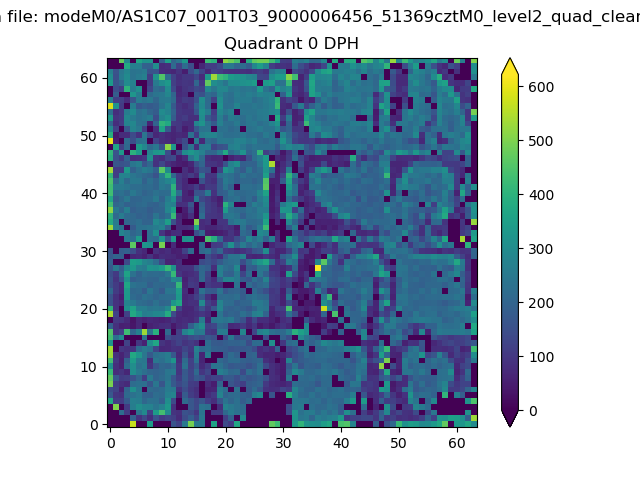 |
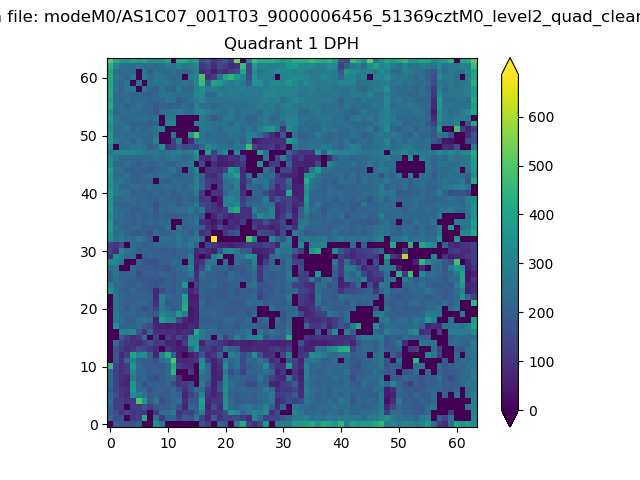 |
Quadrant B |
|---|---|---|---|
| Quadrant D | 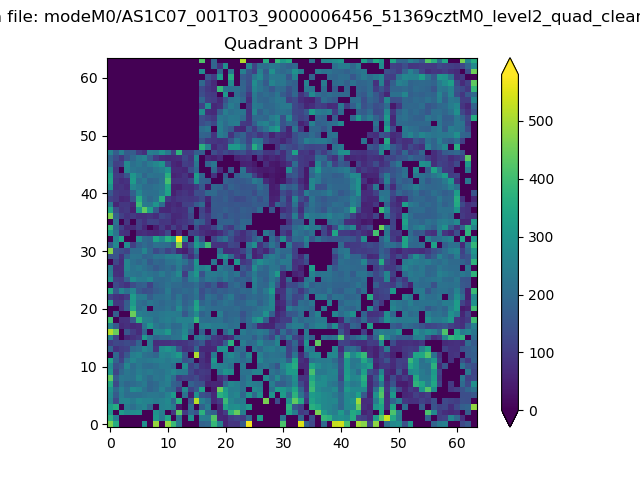 |
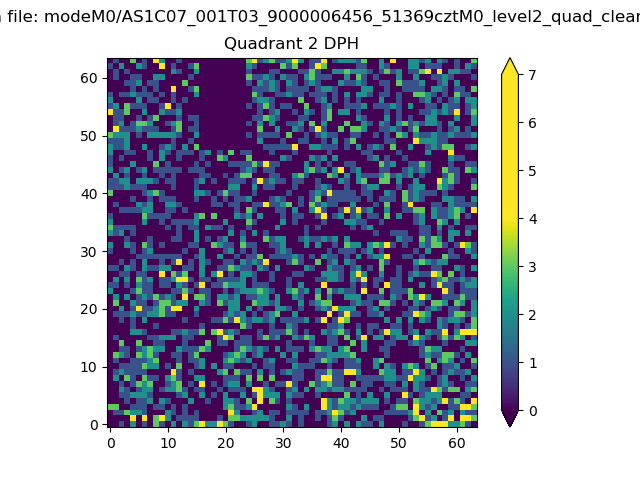 |
Quadrant C |
| Plot type | Count rate plots | Images |
|---|---|---|
| Comparison with Poisson distribution Blue bars denote a histogram of data divided into 1 sec bins. Red curve is a Poisson curve with rate = median count rate of data. |
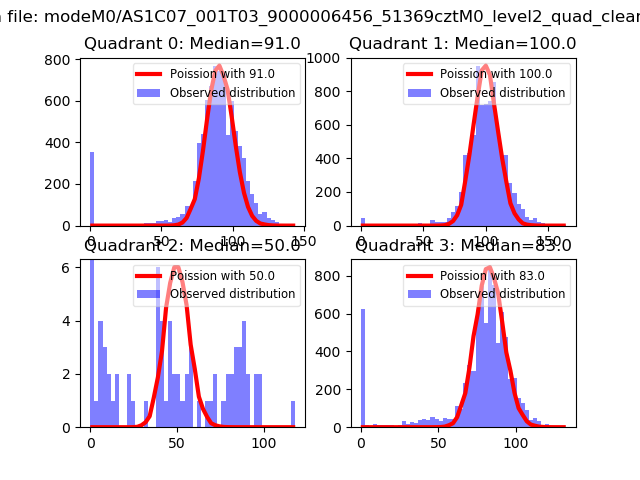 |
 |
| Quadrant-wise count rates Data is divided into 100 sec bins |
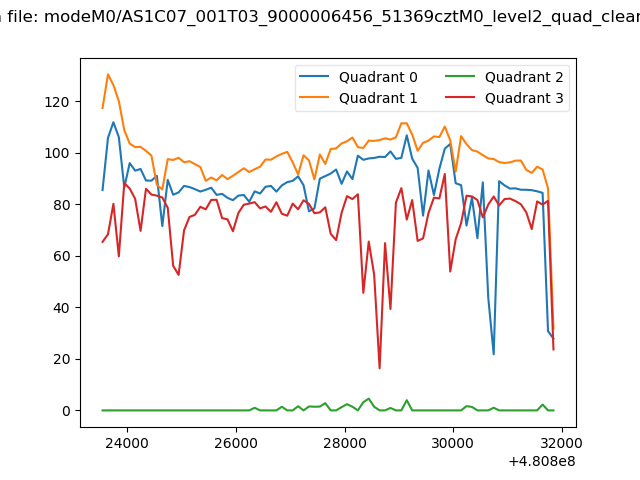 |
|
| Module-wise count rates for Quadrant A Data is divided into 100 sec bins |
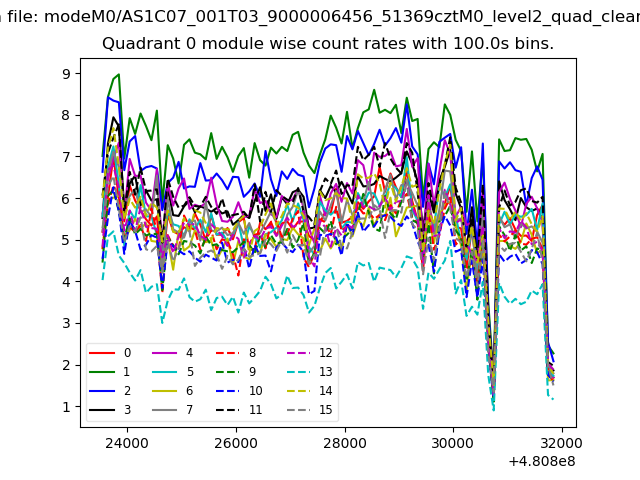 |
 |
| Module-wise count rates for Quadrant B Data is divided into 100 sec bins |
 |
 |
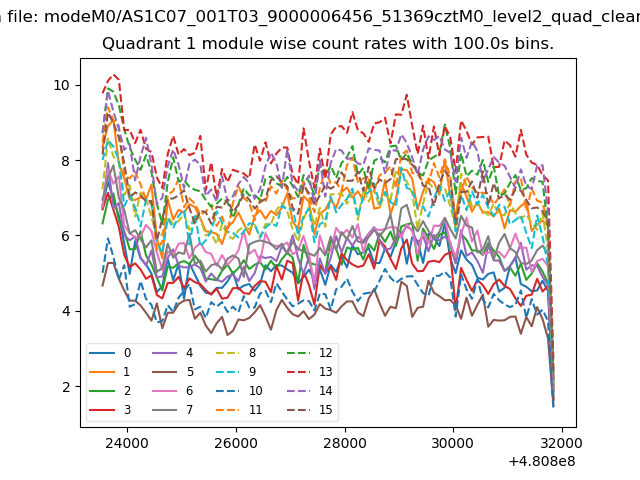
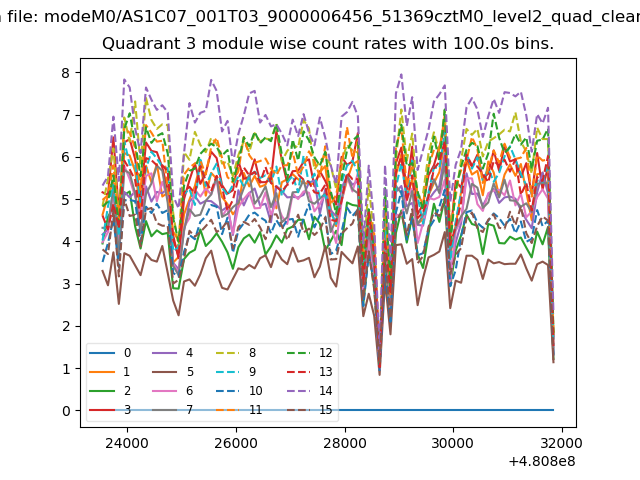
| Module-wise count rates for Quadrant C Data is divided into 100 sec bins |
 |
 |
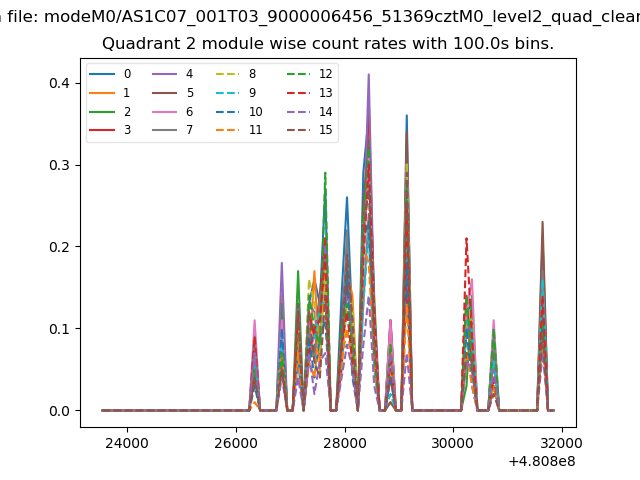
| Module-wise count rates for Quadrant D Data is divided into 100 sec bins |
 |
 |
| Parameter | Plot |
|---|---|
| CZT HV Monitor | 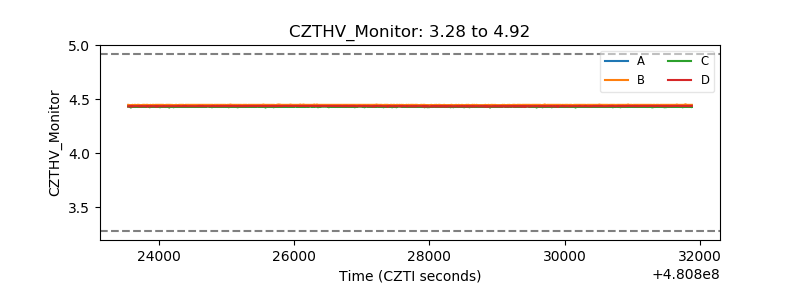 |
| D_VDD | 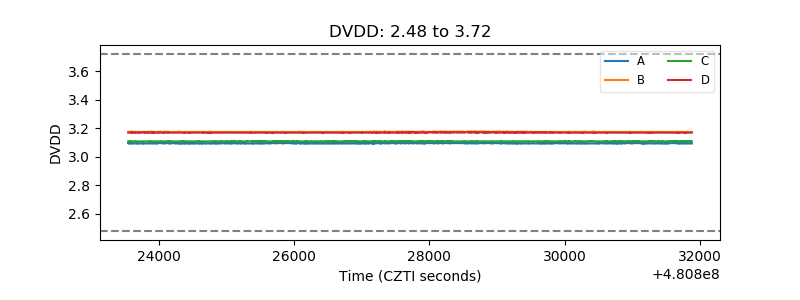 |
| Temperature 1 | 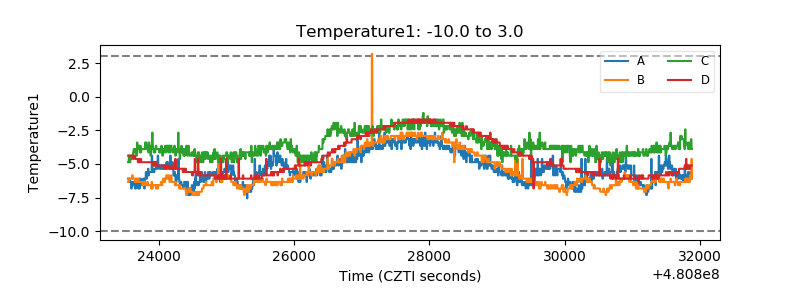 |
| Veto HV Monitor | 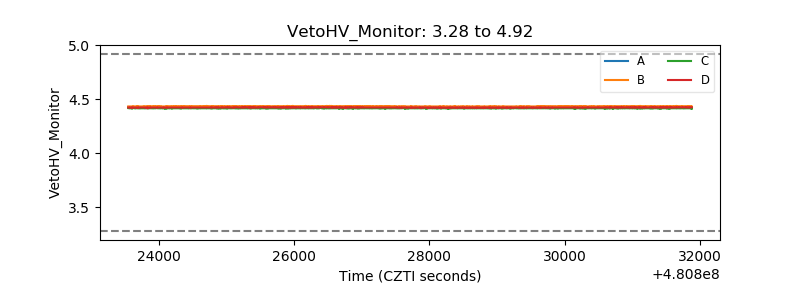 |
| Veto LLD | 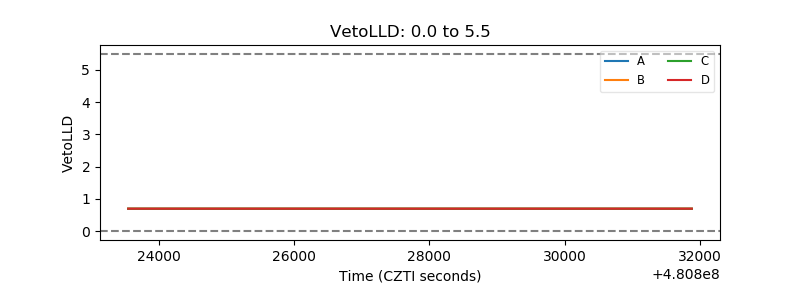 |
| Alpha Counter | 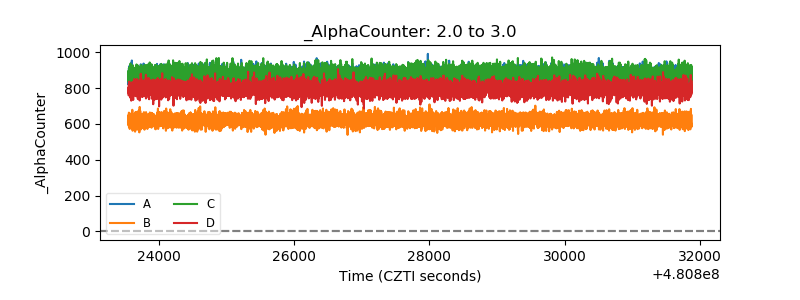 |
| _CPM_Rate | 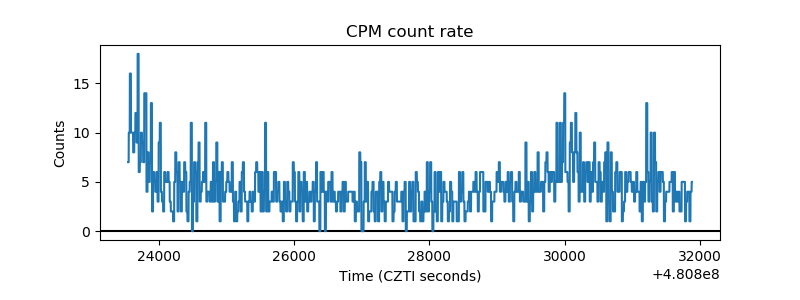 |
| CZT Counter | 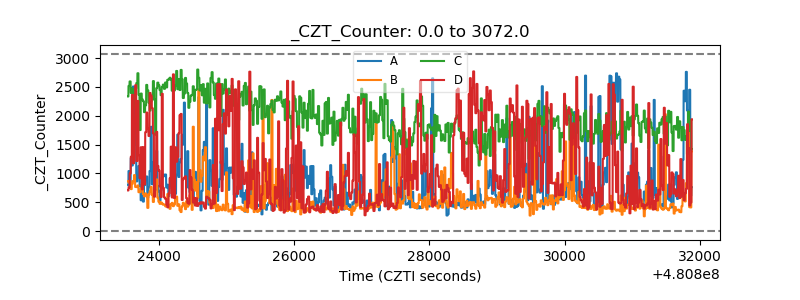 |
| +2.5 Volts monitor | 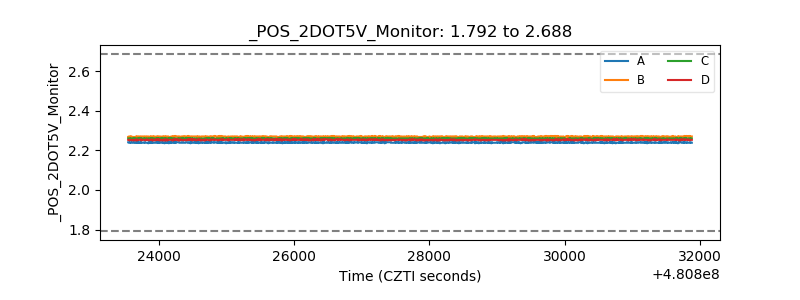 |
| +5 Volts monitor | 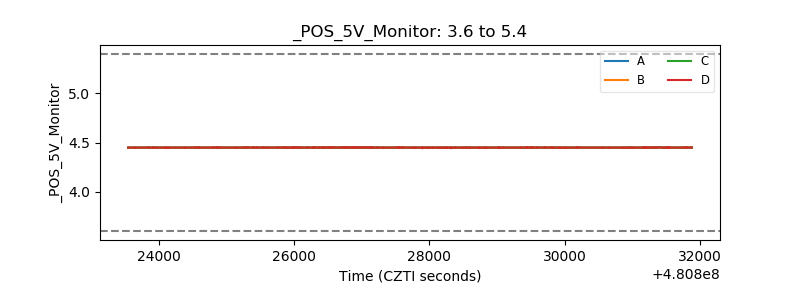 |
| _ROLL_ROT | 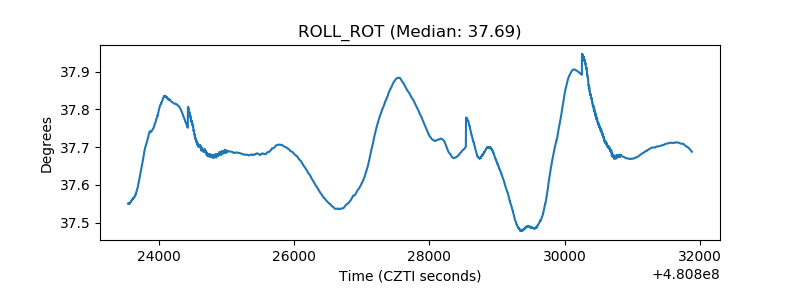 |
| _Roll_DEC | 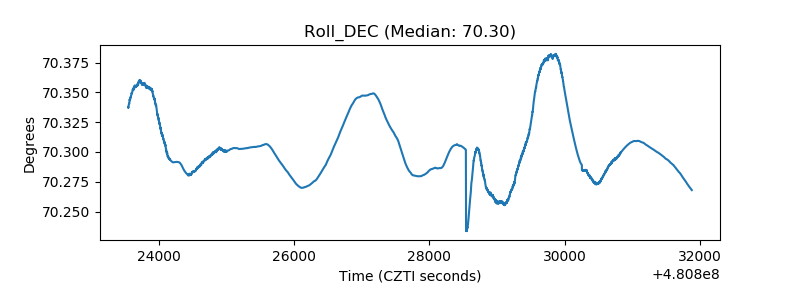 |
| _Roll_RA | 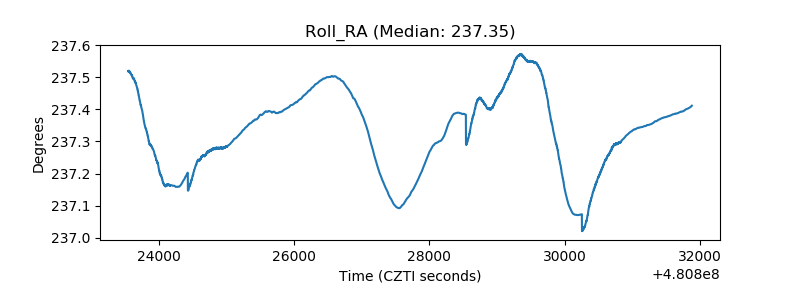 |
| Veto Counter | 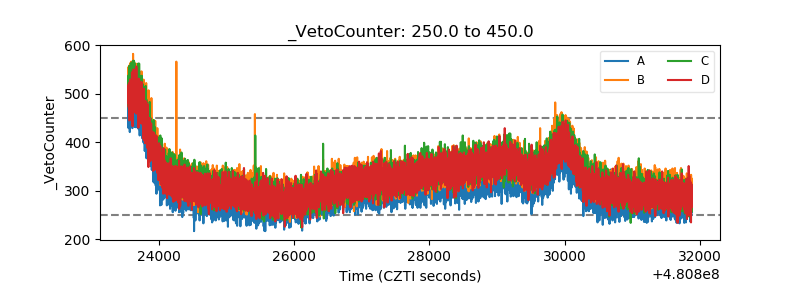 |