| Param | Original file | Final file |
|---|---|---|
| Filename | modeM0/AS1C07_001T03_9000006456_51370cztM0_level2.fits | modeM0/AS1C07_001T03_9000006456_51370cztM0_level2_quad_clean.evt |
| Size (bytes) | 595,224,000 | 39,003,840 |
| Size | 567.6 MB | 37.2 MB |
| Events in quadrant A | 3,952,203 | 287,303 |
| Events in quadrant B | 2,668,437 | 312,175 |
| Events in quadrant C | 8,090,454 | 23,261 |
| Events in quadrant D | 6,949,809 | 220,817 |
| Mode SS | |||
|---|---|---|---|
| Quadrant | BADHDUFLAG | Total packets | Discarded packets |
| A | 0 | 97 | 0 |
| B | 0 | 96 | 0 |
| C | 0 | 98 | 0 |
| D | 0 | 98 | 0 |
| Mode M0 | |||
|---|---|---|---|
| Quadrant | BADHDUFLAG | Total packets | Discarded packets |
| A | 0 | 15084 | 0 |
| B | 0 | 11380 | 0 |
| C | 0 | 27331 | 0 |
| D | 0 | 23965 | 0 |
| Mode M9 | |||
|---|---|---|---|
| Quadrant | BADHDUFLAG | Total packets | Discarded packets |
| A | 1 | 139733429127208 | 139732466008110 |
| B | 1 | -1 | -1 |
| C | 1 | -1 | -1 |
| D | 1 | -1 | -1 |
| Quadrant | Total seconds | Saturated seconds | Saturation percentage |
|---|---|---|---|
| A | 4785 | 237 | 4.952978% |
| B | 4805 | 109 | 2.268470% |
| C | 4740 | 4739 | 99.978903% |
| D | 4754 | 1509 | 31.741691% |
Noise dominated data is calculated using 1-second bins in cleaned event files. If a bin has >2000 counts, and if more than 50% of those come from <1% of pixels, then it is considered to be noise-dominated and hence unusable.
| Quadrant | # 1 sec bins | Bins with >0 counts | Bins with >2000 counts | High rate bins dominated by noise | Noise dominated (total time) | Noise dominated (detector-on time) | Marked lightcurve |
|---|---|---|---|---|---|---|---|
| A | 6250 | 4840 | 200 | 200 | 3.20% | 4.13% | 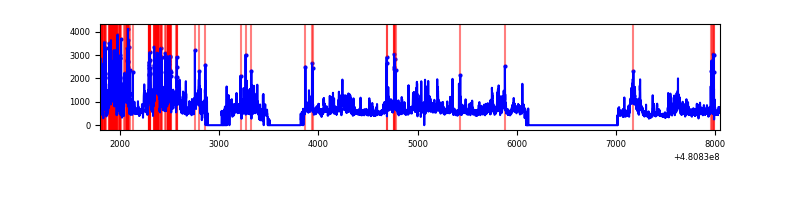 |
| B | 6250 | 4855 | 70 | 70 | 1.12% | 1.44% | 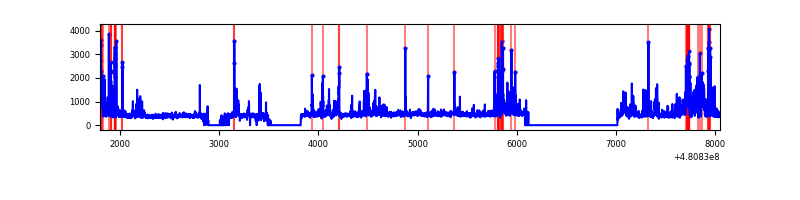 |
| C | 6249 | 4739 | 474 | 474 | 7.59% | 10.00% | 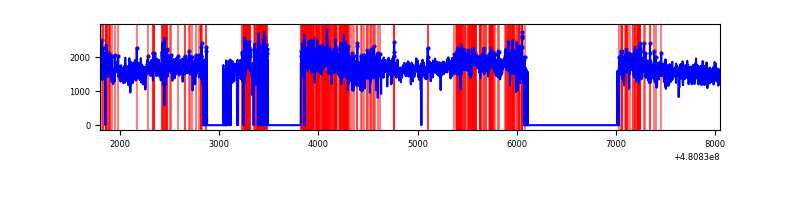 |
| D | 6250 | 4809 | 1356 | 1356 | 21.70% | 28.20% | 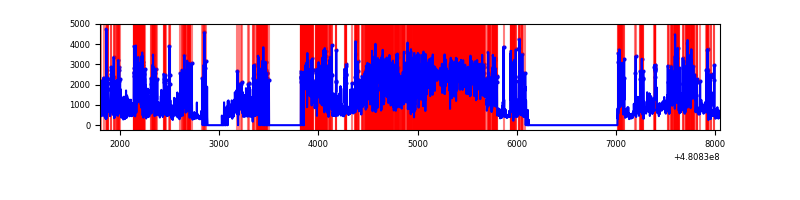 |
Top three noisy pixels from each quadrant. If the there are fewer than three noisy pixels in the level2.evt file, extra rows are filled as -1
| Pixel properties | Quadrant properties | ||||||
|---|---|---|---|---|---|---|---|
| Quadrant | DetID | PixID | Counts | Sigma | Mean | Median | Sigma |
| A | 12 | 3 | 890724 | 7570.58 | 477 | 465 | 117.6 |
| A | 15 | 174 | 656501 | 5578.8 | 477 | 465 | 117.6 |
| A | 12 | 250 | 146689 | 1243.46 | 477 | 465 | 117.6 |
| B | 5 | 185 | 411049 | 3917.93 | 486 | 471 | 104.8 |
| B | 3 | 214 | 94954 | 901.6 | 486 | 471 | 104.8 |
| B | 4 | 206 | 81142 | 769.8 | 486 | 471 | 104.8 |
| C | 15 | 179 | 4841188 | 271458.7 | 58 | 57 | 17.8 |
| C | 4 | 12 | 2342609 | 131354.87 | 58 | 57 | 17.8 |
| C | 0 | 177 | 632474 | 35461.77 | 58 | 57 | 17.8 |
| D | 11 | 176 | 2675416 | 23484.56 | 407 | 393 | 113.9 |
| D | 7 | 60 | 1777676 | 15603.12 | 407 | 393 | 113.9 |
| D | 7 | 126 | 450014 | 3947.31 | 407 | 393 | 113.9 |
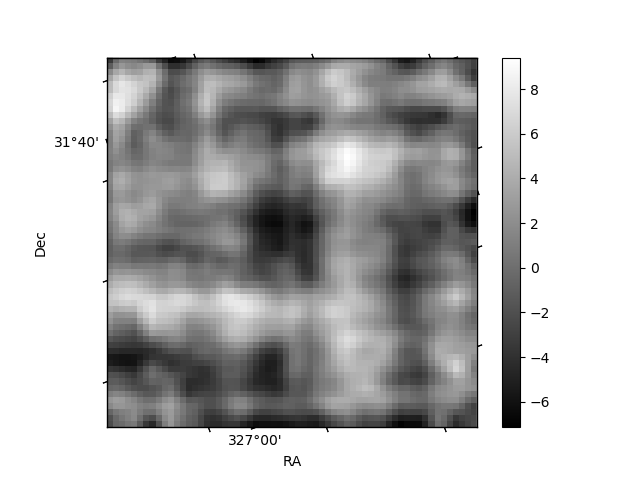
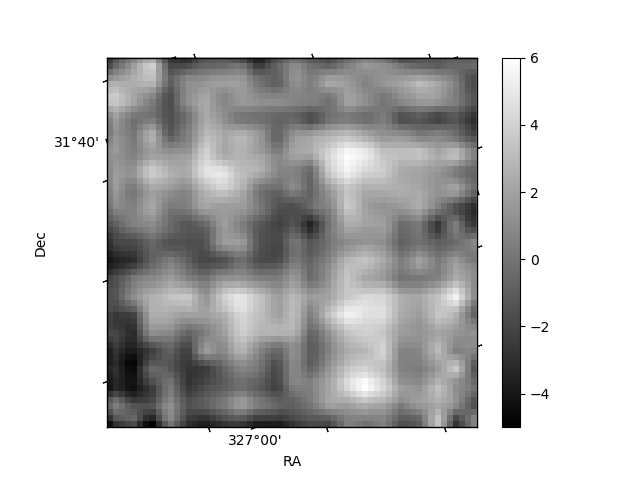
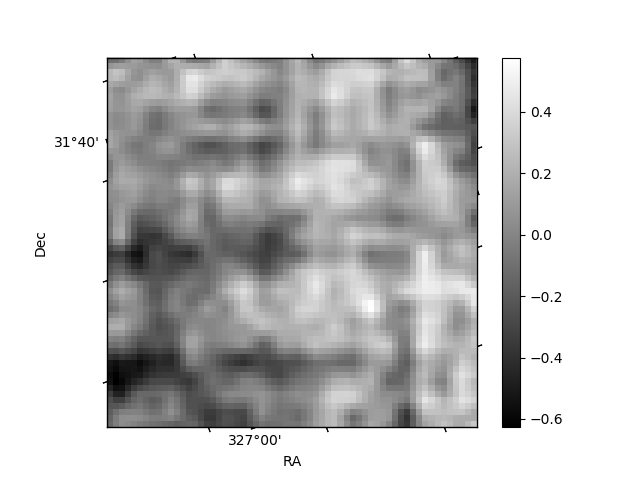
Histogram calculated using DETX and DETY for each event in the final _common_clean file
| Quadrant A | 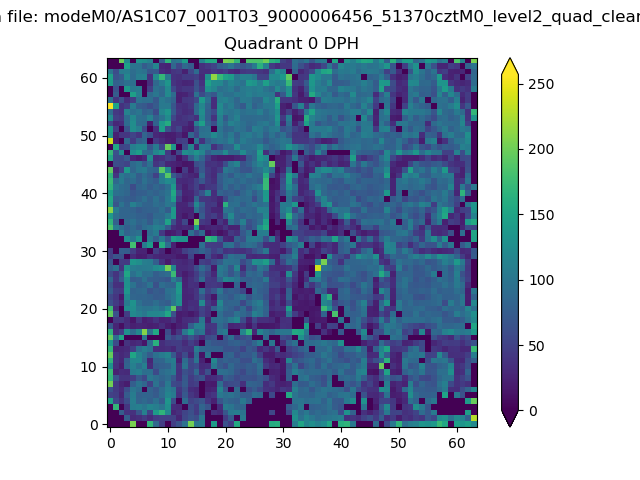 |
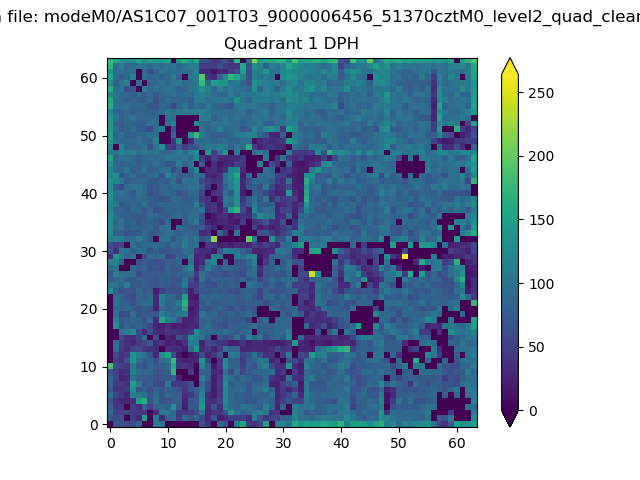 |
Quadrant B |
|---|---|---|---|
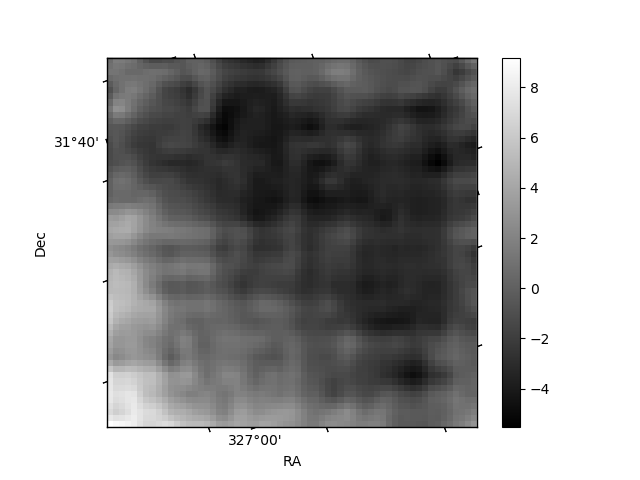
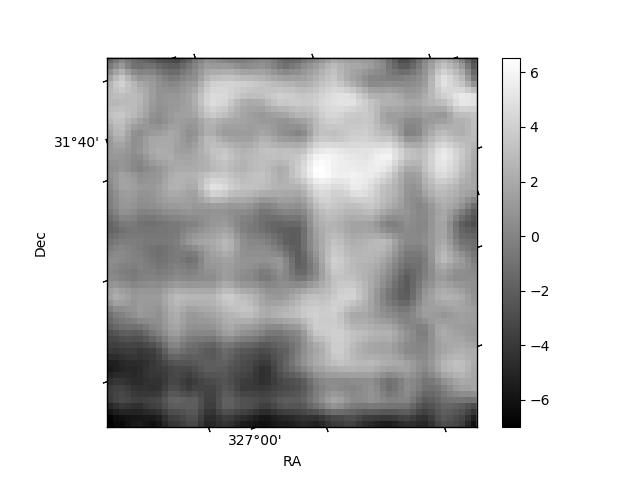
| Quadrant D | 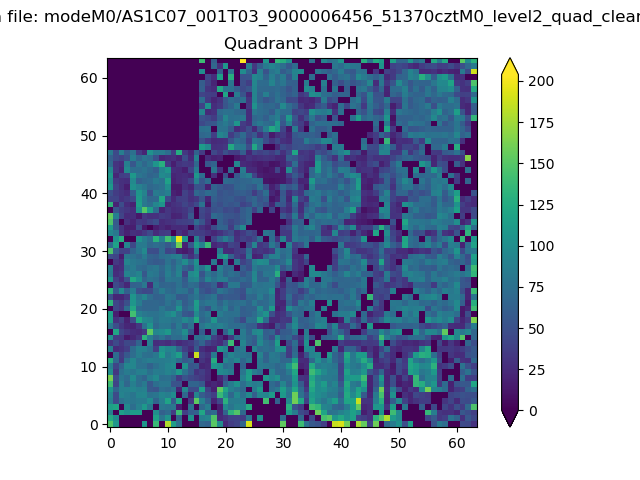 |
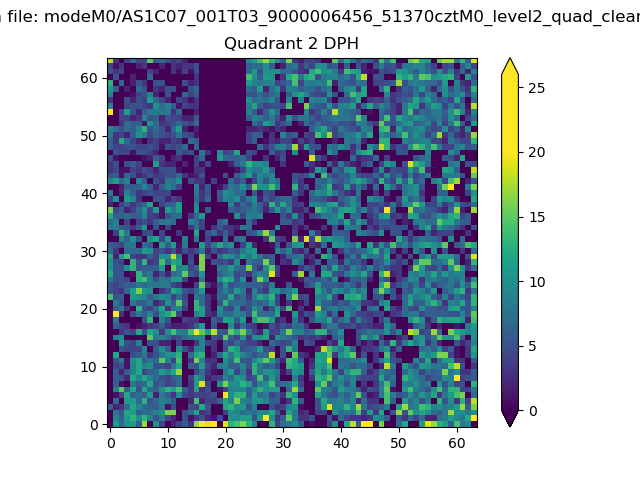 |
Quadrant C |
| Plot type | Count rate plots | Images |
|---|---|---|
| Comparison with Poisson distribution Blue bars denote a histogram of data divided into 1 sec bins. Red curve is a Poisson curve with rate = median count rate of data. |
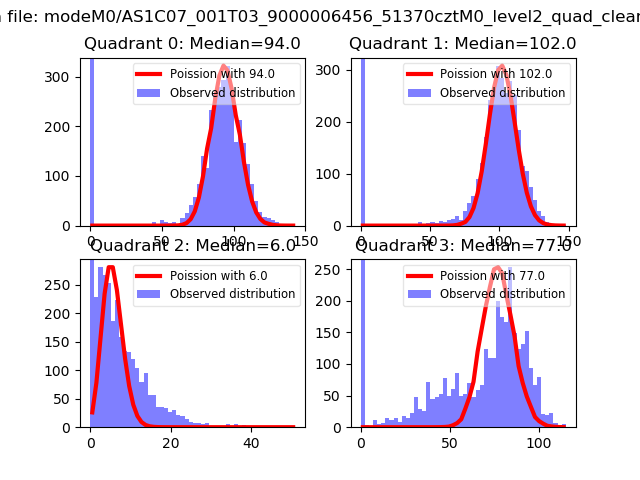 |
 |
| Quadrant-wise count rates Data is divided into 100 sec bins |
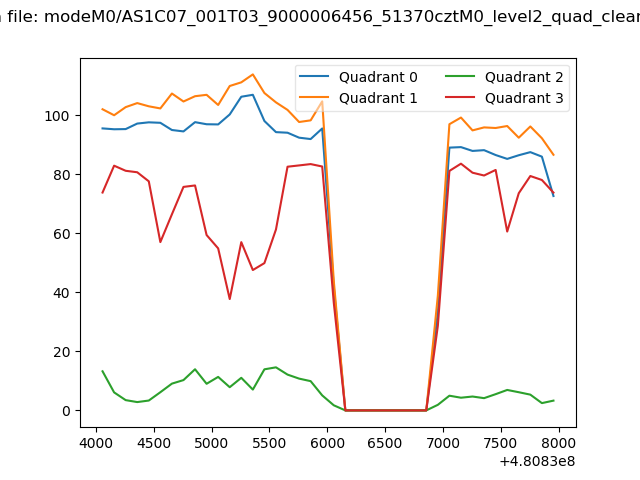 |
|
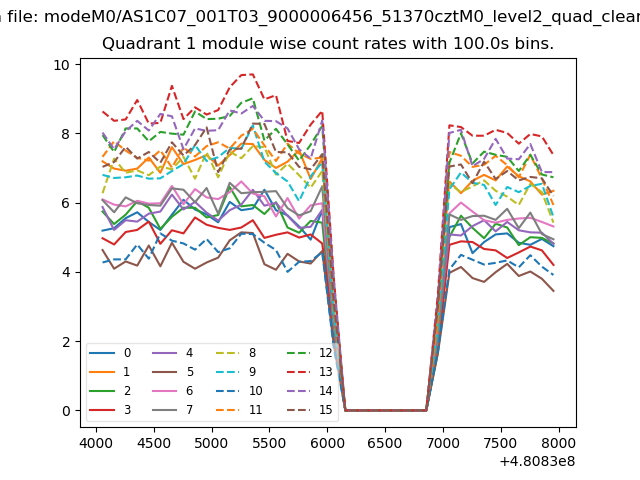
| Module-wise count rates for Quadrant A Data is divided into 100 sec bins |
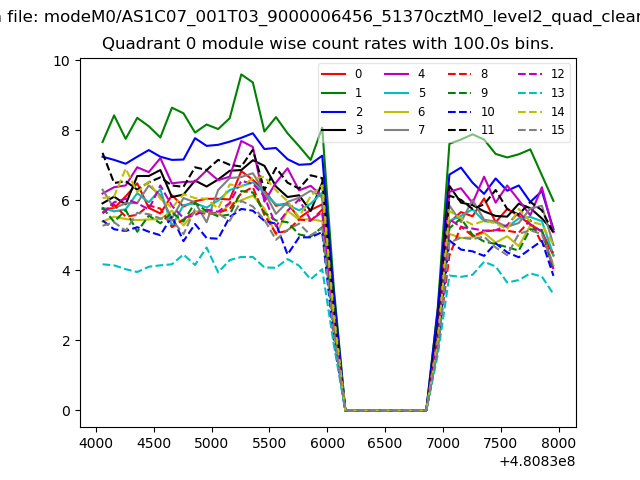 |
 |
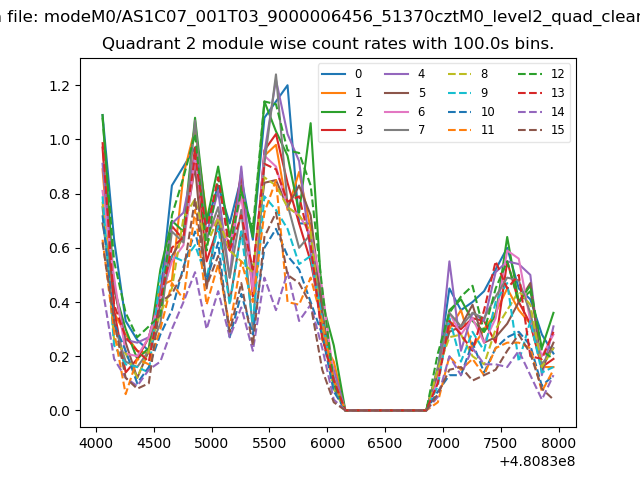
| Module-wise count rates for Quadrant B Data is divided into 100 sec bins |
 |
 |
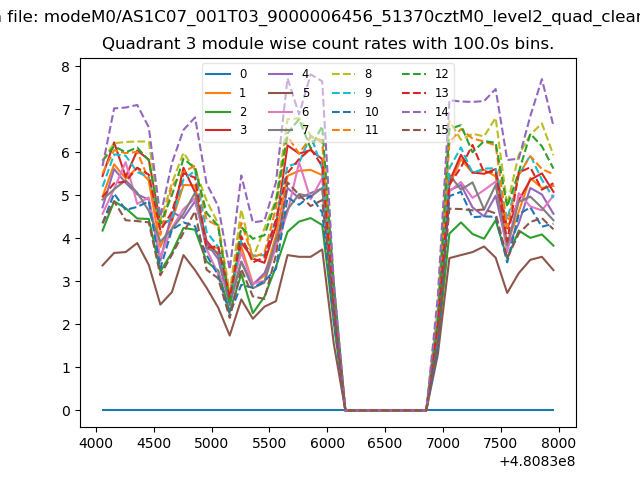
| Module-wise count rates for Quadrant C Data is divided into 100 sec bins |
 |
 |
| Module-wise count rates for Quadrant D Data is divided into 100 sec bins |
 |
 |
| Parameter | Plot |
|---|---|
| CZT HV Monitor |  |
| D_VDD | 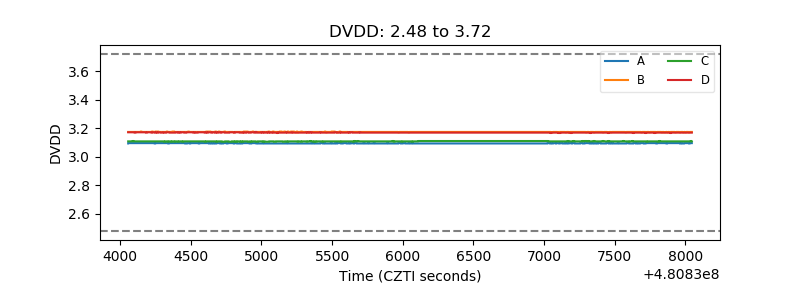 |
| Temperature 1 | 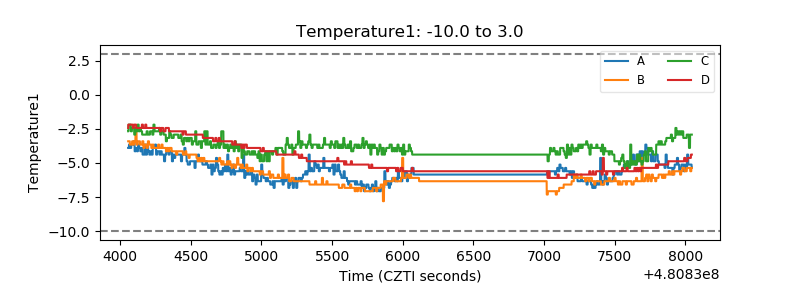 |
| Veto HV Monitor | 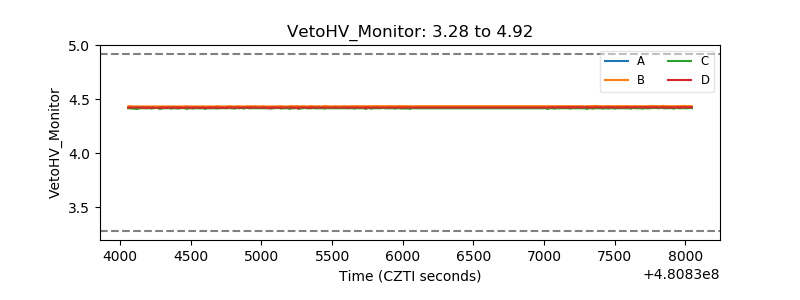 |
| Veto LLD | 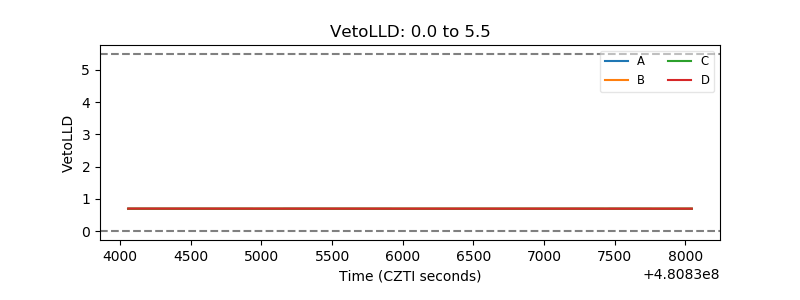 |
| Alpha Counter | 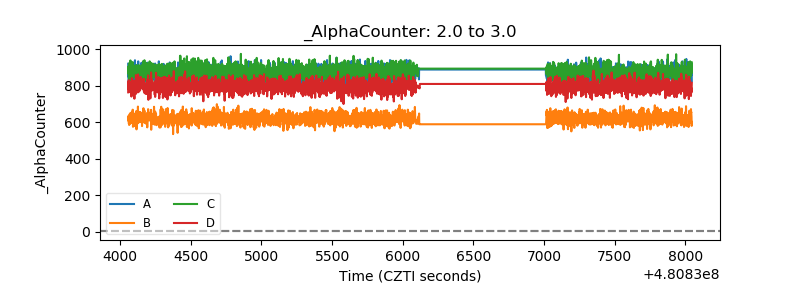 |
| _CPM_Rate | 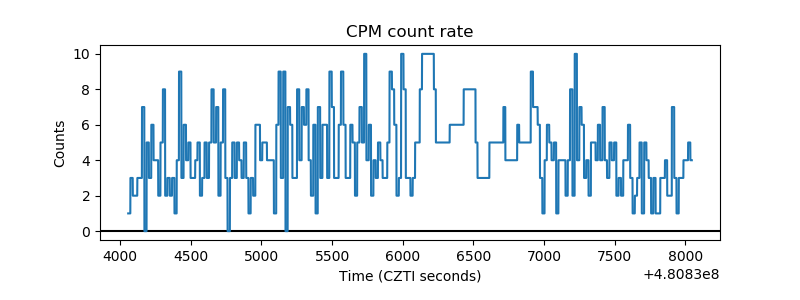 |
| CZT Counter | 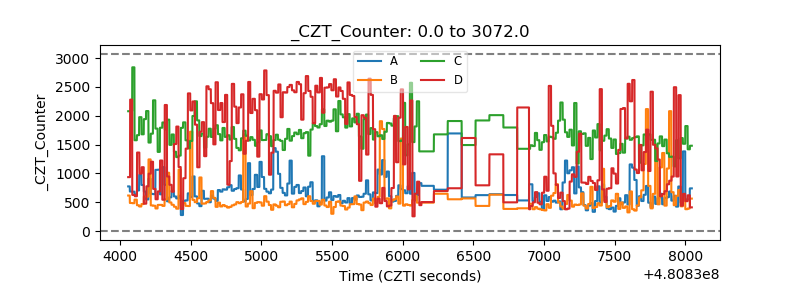 |
| +2.5 Volts monitor | 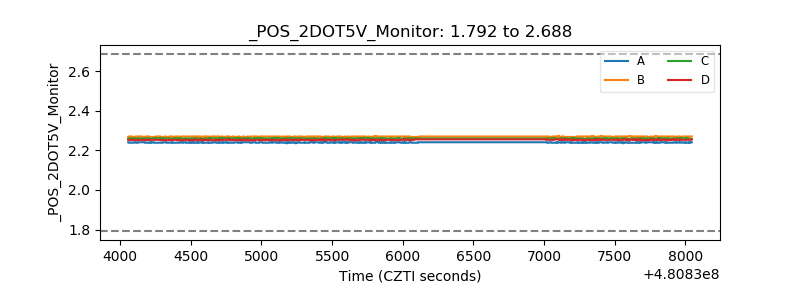 |
| +5 Volts monitor | 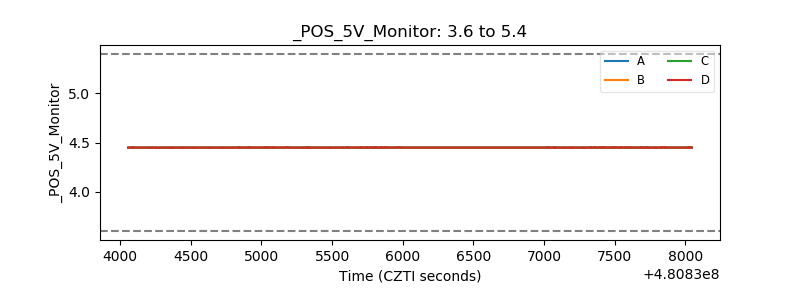 |
| _ROLL_ROT | 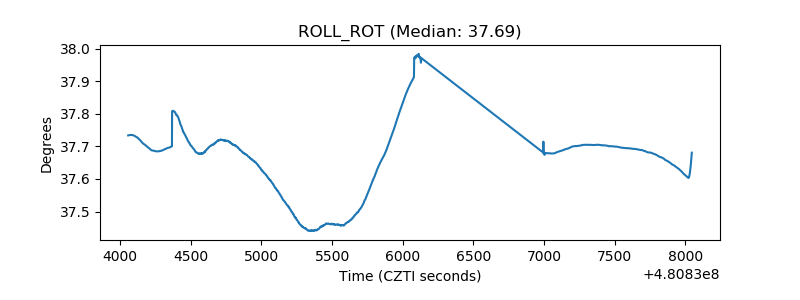 |
| _Roll_DEC | 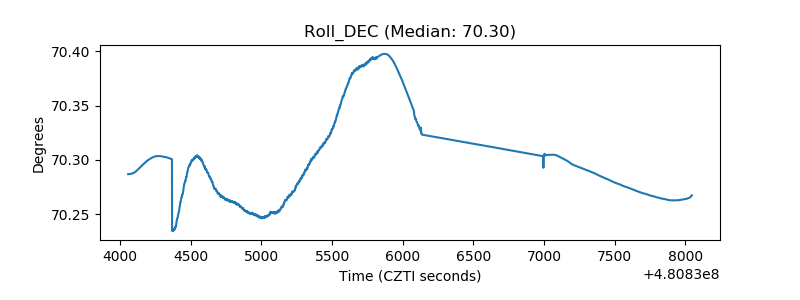 |
| _Roll_RA | 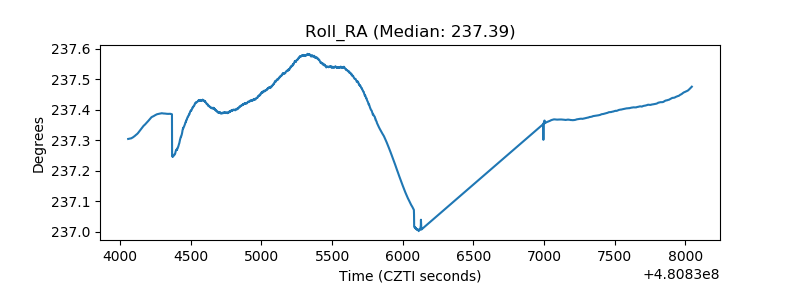 |
| Veto Counter | 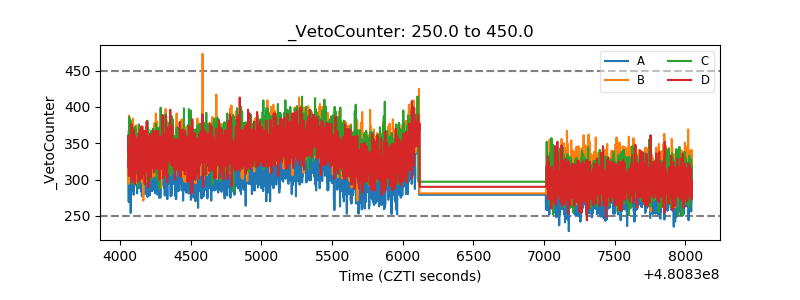 |