| Param | Original file | Final file |
|---|---|---|
| Filename | modeM0/AS1C07_001T03_9000006456_51373cztM0_level2.fits | modeM0/AS1C07_001T03_9000006456_51373cztM0_level2_quad_clean.evt |
| Size (bytes) | 2,308,648,320 | 191,931,840 |
| Size | 2.2 GB | 183.0 MB |
| Events in quadrant A | 15,889,672 | 1,568,809 |
| Events in quadrant B | 11,559,261 | 1,738,687 |
| Events in quadrant C | 32,872,967 | 99,187 |
| Events in quadrant D | 23,712,791 | 1,135,740 |
| Mode SS | |||
|---|---|---|---|
| Quadrant | BADHDUFLAG | Total packets | Discarded packets |
| A | 0 | 376 | 2 |
| B | 0 | 375 | 1 |
| C | 0 | 374 | 4 |
| D | 0 | 376 | 4 |
| Mode M0 | |||
|---|---|---|---|
| Quadrant | BADHDUFLAG | Total packets | Discarded packets |
| A | 0 | 60629 | 581 |
| B | 0 | 47442 | 241 |
| C | 0 | 111606 | 1205 |
| D | 0 | 83681 | 492 |
| Mode M9 | |||
|---|---|---|---|
| Quadrant | BADHDUFLAG | Total packets | Discarded packets |
| A | 0 | 10 | 0 |
| B | 0 | 10 | 0 |
| C | 0 | 12 | 2 |
| D | 0 | 10 | 0 |
| Quadrant | Total seconds | Saturated seconds | Saturation percentage |
|---|---|---|---|
| A | 18378 | 1360 | 7.400152% |
| B | 18435 | 1108 | 6.010306% |
| C | 18362 | 17408 | 94.804488% |
| D | 18393 | 5064 | 27.532213% |
Noise dominated data is calculated using 1-second bins in cleaned event files. If a bin has >2000 counts, and if more than 50% of those come from <1% of pixels, then it is considered to be noise-dominated and hence unusable.
| Quadrant | # 1 sec bins | Bins with >0 counts | Bins with >2000 counts | High rate bins dominated by noise | Noise dominated (total time) | Noise dominated (detector-on time) | Marked lightcurve |
|---|---|---|---|---|---|---|---|
| A | 19965 | 18446 | 785 | 785 | 3.93% | 4.26% | 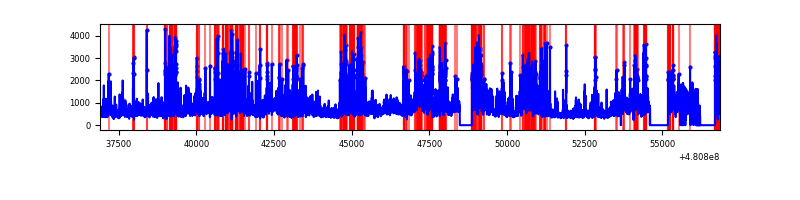 |
| B | 19965 | 18476 | 506 | 506 | 2.53% | 2.74% | 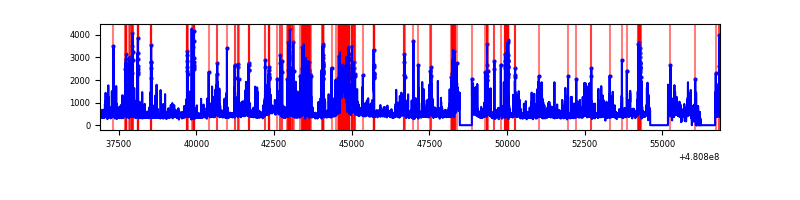 |
| C | 19964 | 18412 | 5296 | 5296 | 26.53% | 28.76% | 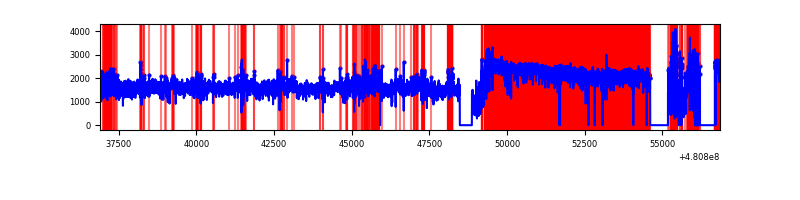 |
| D | 19964 | 18454 | 4400 | 4400 | 22.04% | 23.84% | 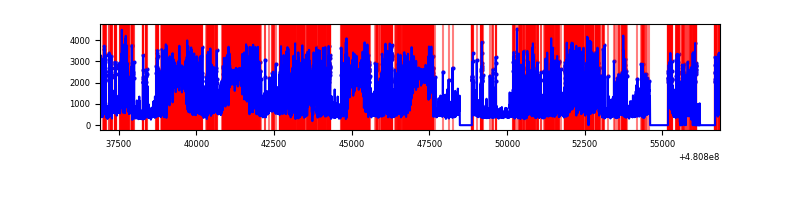 |
Top three noisy pixels from each quadrant. If the there are fewer than three noisy pixels in the level2.evt file, extra rows are filled as -1
| Pixel properties | Quadrant properties | ||||||
|---|---|---|---|---|---|---|---|
| Quadrant | DetID | PixID | Counts | Sigma | Mean | Median | Sigma |
| A | 12 | 3 | 3727843 | 8070.91 | 1886 | 1839 | 461.7 |
| A | 15 | 174 | 1556237 | 3366.99 | 1886 | 1839 | 461.7 |
| A | 12 | 250 | 677889 | 1464.39 | 1886 | 1839 | 461.7 |
| B | 5 | 185 | 1520169 | 3760.71 | 1890 | 1818 | 403.7 |
| B | 0 | 171 | 699660 | 1728.44 | 1890 | 1818 | 403.7 |
| B | 4 | 206 | 382618 | 943.18 | 1890 | 1818 | 403.7 |
| C | 15 | 179 | 27504009 | 262712.43 | 378 | 375 | 104.7 |
| C | 4 | 12 | 2759235 | 26352.4 | 378 | 375 | 104.7 |
| C | 0 | 177 | 584064 | 5575.35 | 378 | 375 | 104.7 |
| D | 11 | 176 | 7522552 | 16427.61 | 1632 | 1571 | 457.8 |
| D | 7 | 60 | 4916140 | 10734.58 | 1632 | 1571 | 457.8 |
| D | 7 | 126 | 1879324 | 4101.46 | 1632 | 1571 | 457.8 |
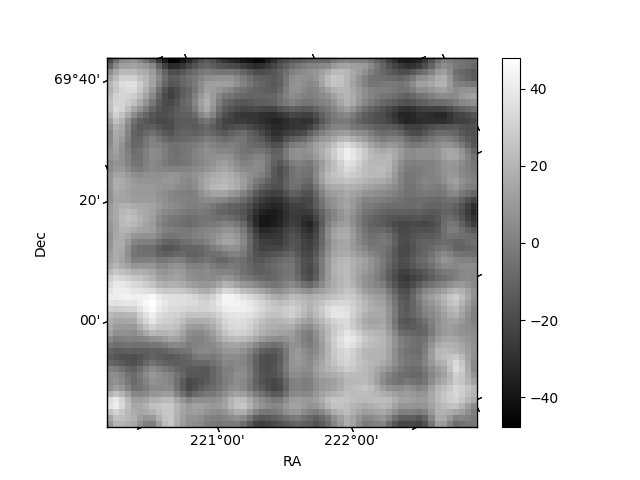
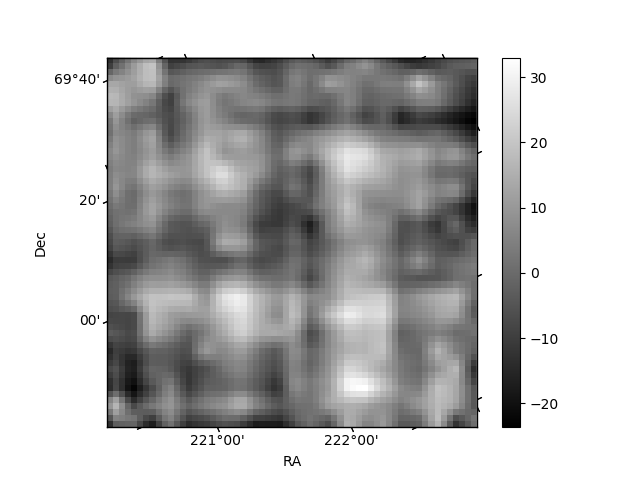
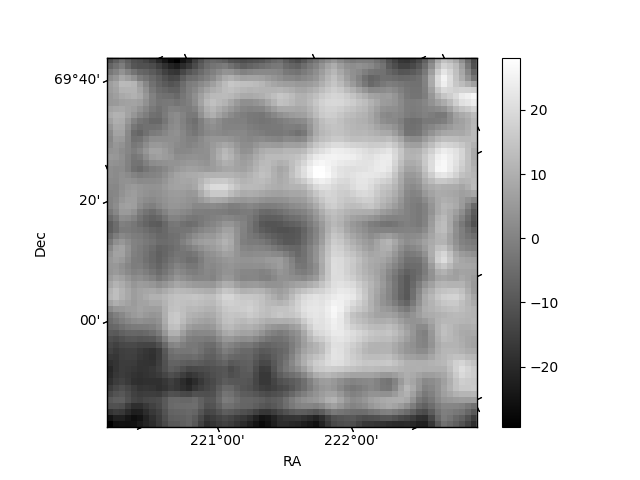
Histogram calculated using DETX and DETY for each event in the final _common_clean file
| Quadrant A | 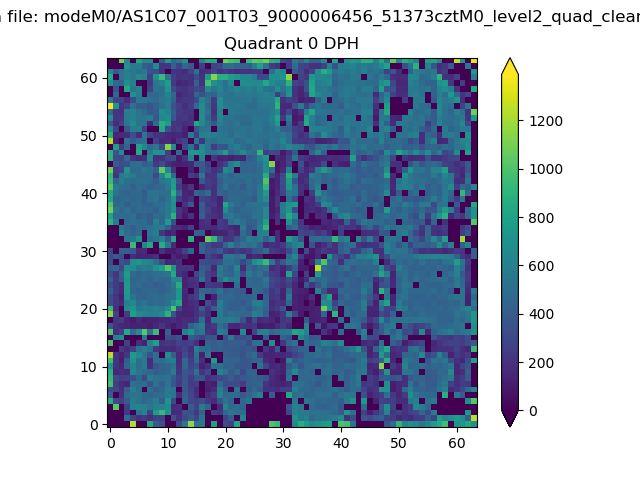 |
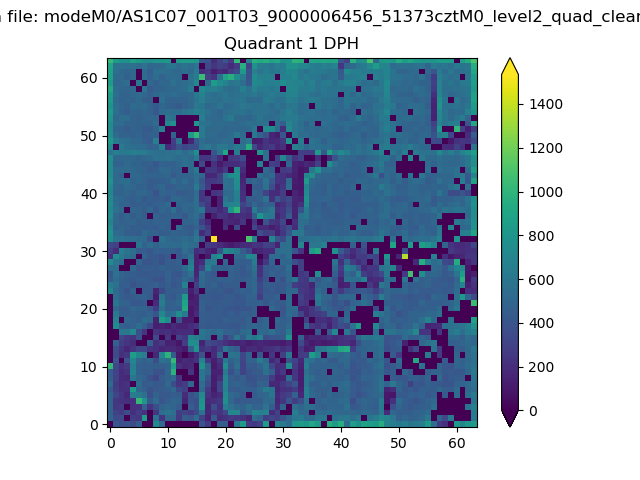 |
Quadrant B |
|---|---|---|---|
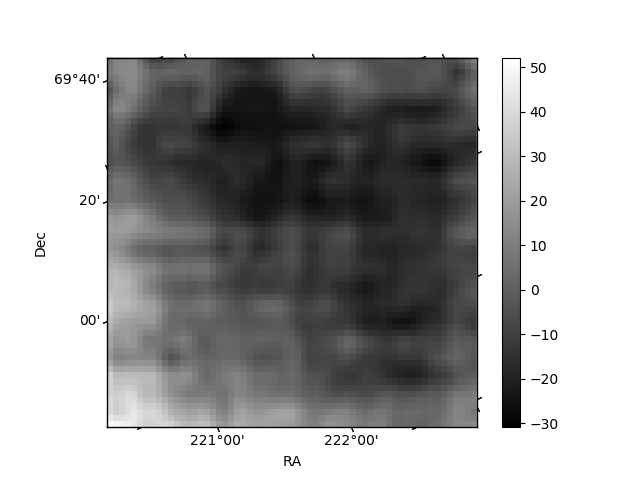
| Quadrant D | 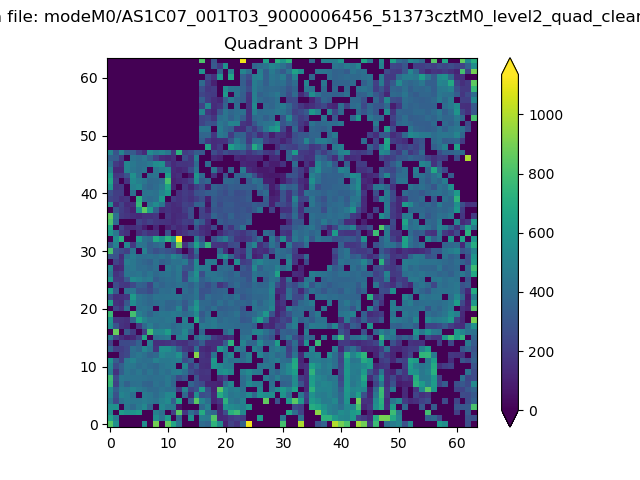 |
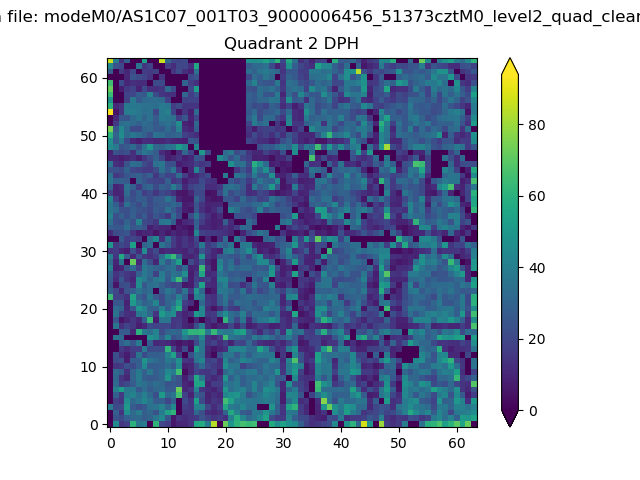 |
Quadrant C |
| Plot type | Count rate plots | Images |
|---|---|---|
| Comparison with Poisson distribution Blue bars denote a histogram of data divided into 1 sec bins. Red curve is a Poisson curve with rate = median count rate of data. |
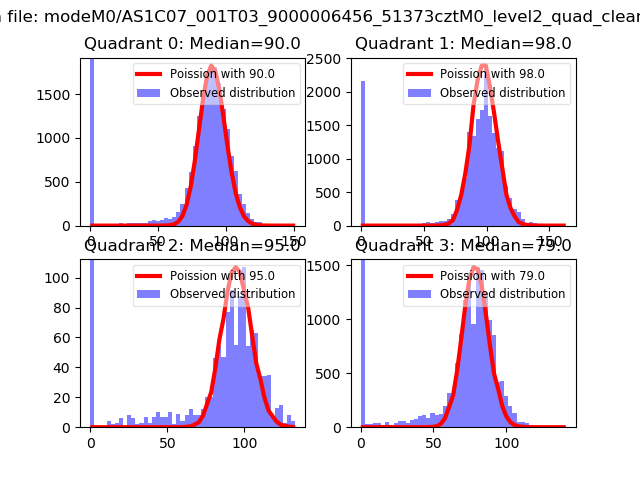 |
 |
| Quadrant-wise count rates Data is divided into 100 sec bins |
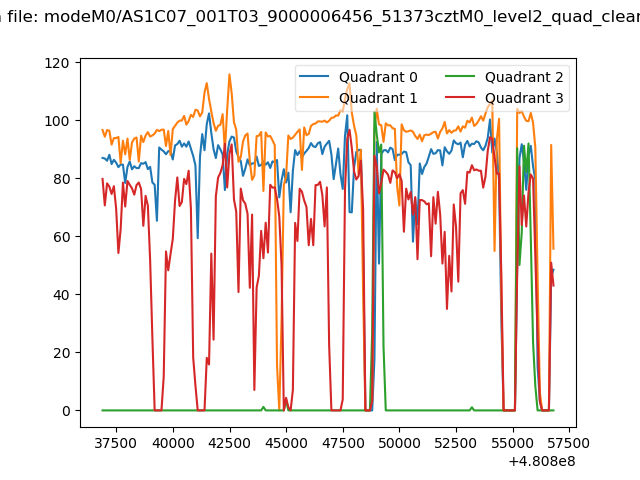 |
|
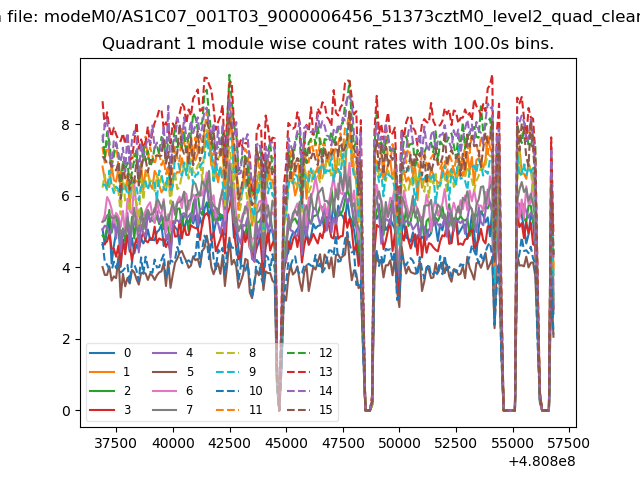
| Module-wise count rates for Quadrant A Data is divided into 100 sec bins |
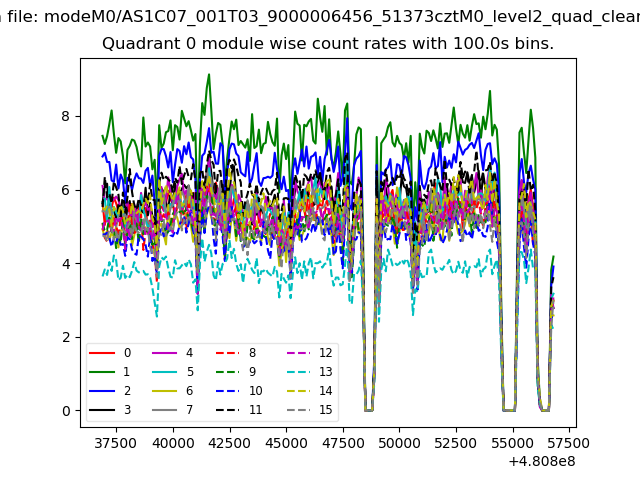 |
 |
| Module-wise count rates for Quadrant B Data is divided into 100 sec bins |
 |
 |
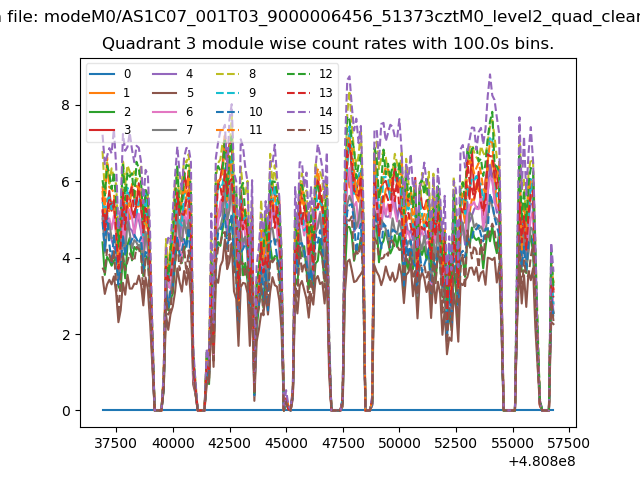
| Module-wise count rates for Quadrant C Data is divided into 100 sec bins |
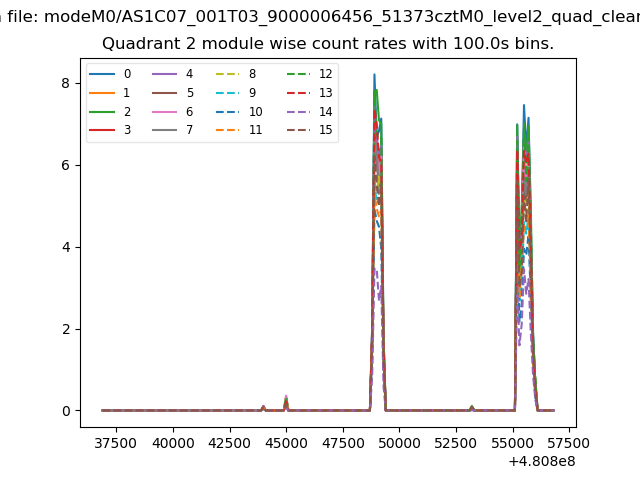 |
 |
| Module-wise count rates for Quadrant D Data is divided into 100 sec bins |
 |
 |
| Parameter | Plot |
|---|---|
| CZT HV Monitor | 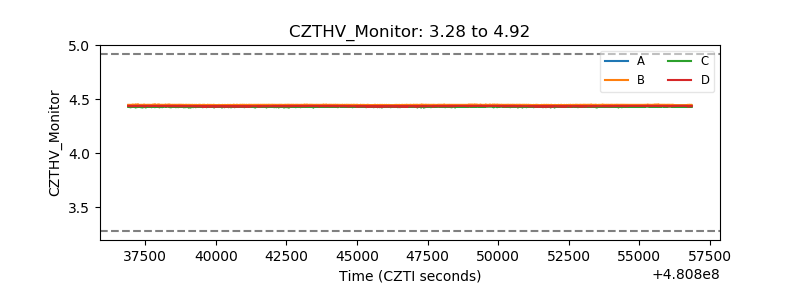 |
| D_VDD | 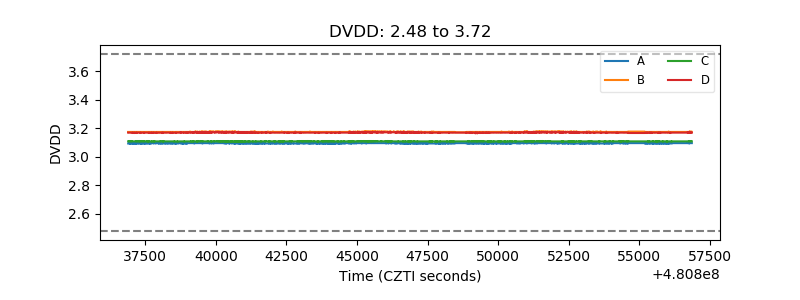 |
| Temperature 1 | 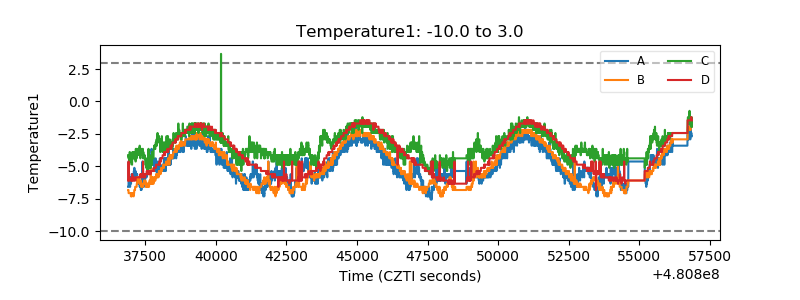 |
| Veto HV Monitor | 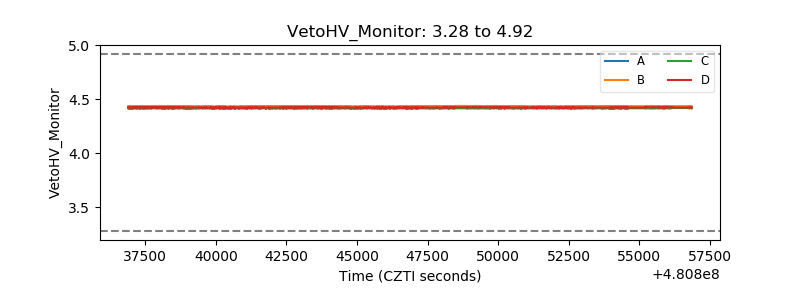 |
| Veto LLD | 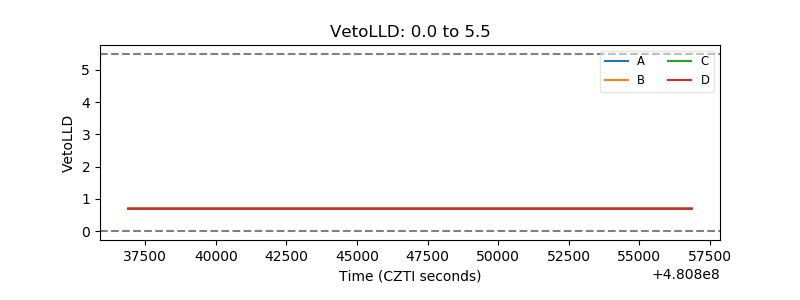 |
| Alpha Counter | 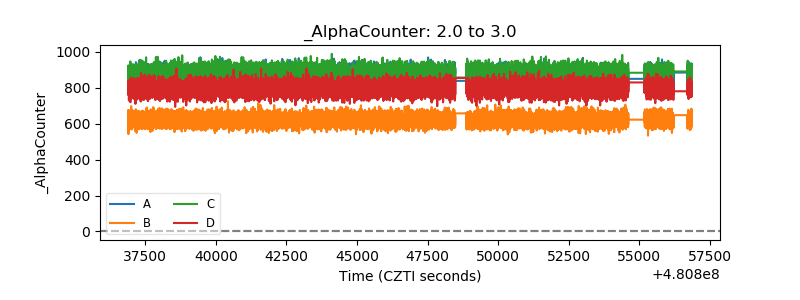 |
| _CPM_Rate | 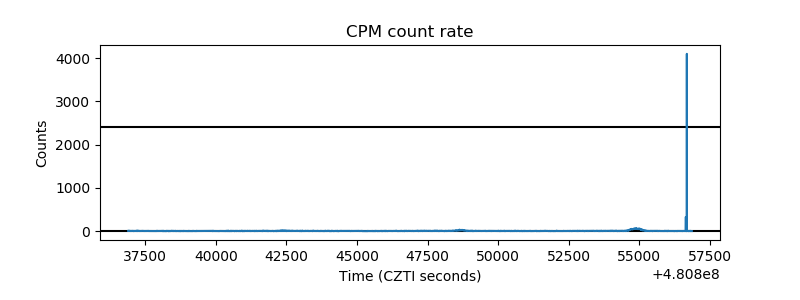 |
| CZT Counter | 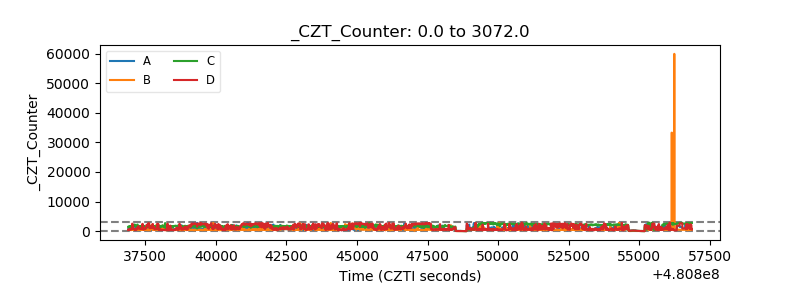 |
| +2.5 Volts monitor | 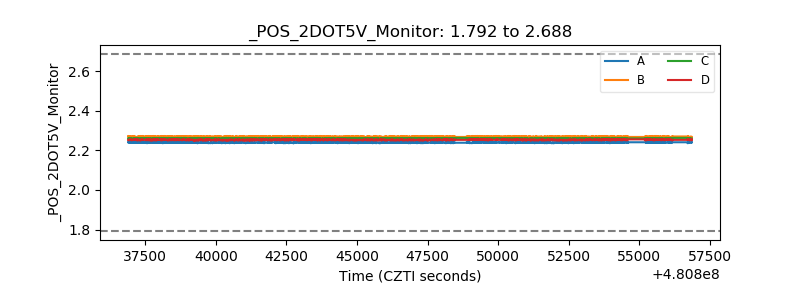 |
| +5 Volts monitor | 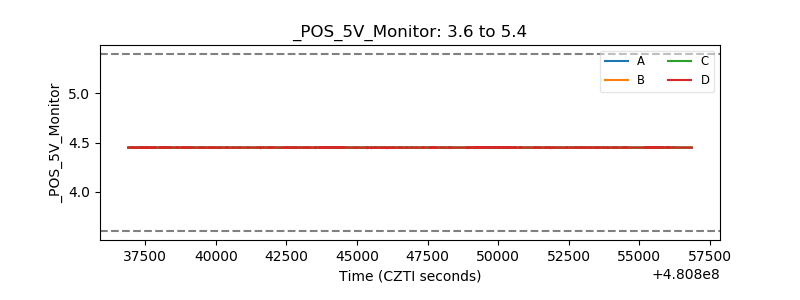 |
| _ROLL_ROT | 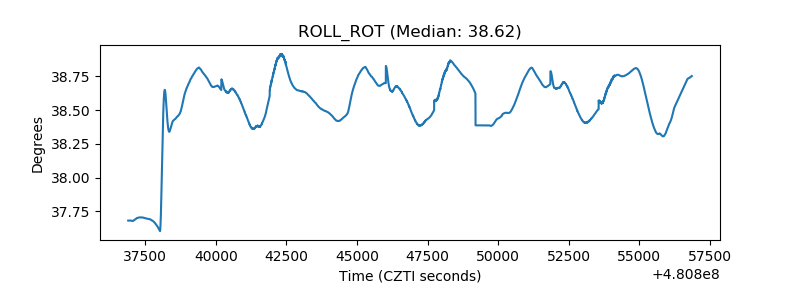 |
| _Roll_DEC | 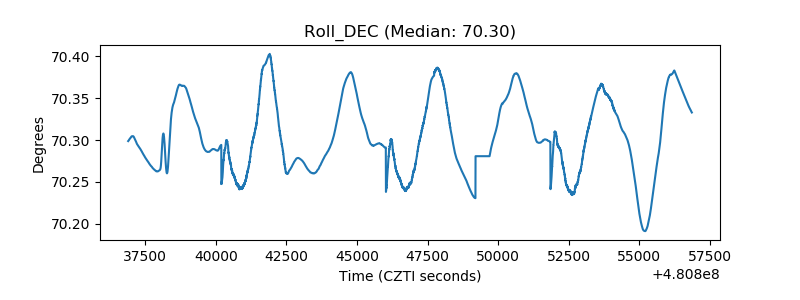 |
| _Roll_RA | 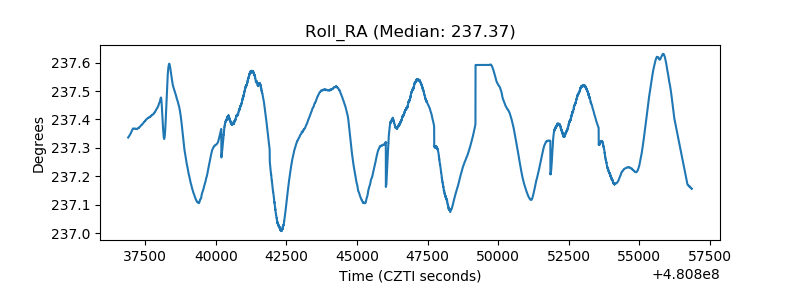 |
| Veto Counter | 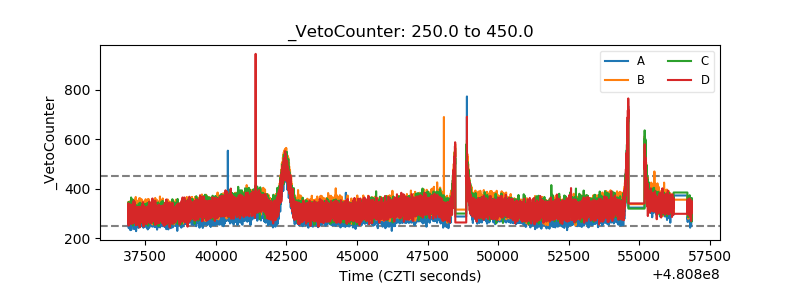 |