| Param | Original file | Final file |
|---|---|---|
| Filename | modeM0/AS1C07_001T03_9000006456_51374cztM0_level2.fits | modeM0/AS1C07_001T03_9000006456_51374cztM0_level2_quad_clean.evt |
| Size (bytes) | 415,745,280 | 35,824,320 |
| Size | 396.5 MB | 34.2 MB |
| Events in quadrant A | 3,064,057 | 276,012 |
| Events in quadrant B | 1,739,099 | 310,757 |
| Events in quadrant C | 6,303,869 | 60,557 |
| Events in quadrant D | 4,039,896 | 216,498 |
| Mode SS | |||
|---|---|---|---|
| Quadrant | BADHDUFLAG | Total packets | Discarded packets |
| A | 0 | 77 | 13 |
| B | 0 | 81 | 17 |
| C | 0 | 79 | 15 |
| D | 0 | 77 | 13 |
| Mode M0 | |||
|---|---|---|---|
| Quadrant | BADHDUFLAG | Total packets | Discarded packets |
| A | 0 | 13485 | 2154 |
| B | 0 | 8496 | 1163 |
| C | 0 | 25117 | 4324 |
| D | 0 | 16498 | 2331 |
| Mode M9 | |||
|---|---|---|---|
| Quadrant | BADHDUFLAG | Total packets | Discarded packets |
| A | 0 | 11 | 3 |
| B | 0 | 11 | 3 |
| C | 0 | 14 | 6 |
| D | 0 | 13 | 5 |
| Quadrant | Total seconds | Saturated seconds | Saturation percentage |
|---|---|---|---|
| A | 3114 | 229 | 7.353886% |
| B | 3134 | 117 | 3.733248% |
| C | 3080 | 2508 | 81.428571% |
| D | 3094 | 735 | 23.755656% |
Noise dominated data is calculated using 1-second bins in cleaned event files. If a bin has >2000 counts, and if more than 50% of those come from <1% of pixels, then it is considered to be noise-dominated and hence unusable.
| Quadrant | # 1 sec bins | Bins with >0 counts | Bins with >2000 counts | High rate bins dominated by noise | Noise dominated (total time) | Noise dominated (detector-on time) | Marked lightcurve |
|---|---|---|---|---|---|---|---|
| A | 5440 | 3155 | 89 | 89 | 1.64% | 2.82% | 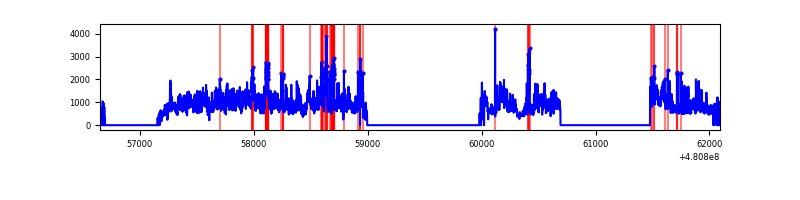 |
| B | 5433 | 3169 | 18 | 18 | 0.33% | 0.57% | 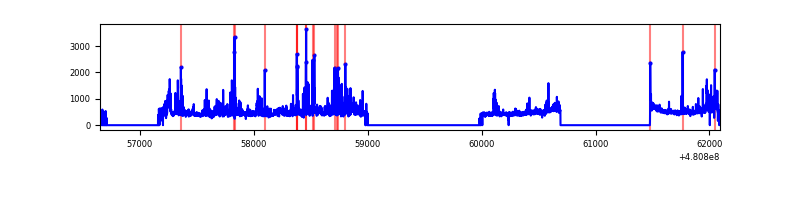 |
| C | 4916 | 3086 | 2424 | 2424 | 49.31% | 78.55% | 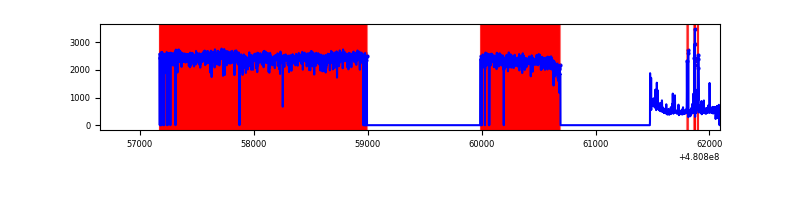 |
| D | 5411 | 3120 | 638 | 638 | 11.79% | 20.45% | 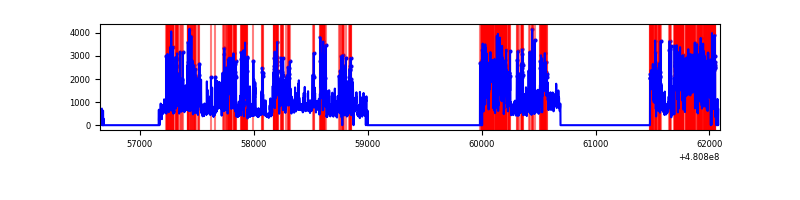 |
Top three noisy pixels from each quadrant. If the there are fewer than three noisy pixels in the level2.evt file, extra rows are filled as -1
| Pixel properties | Quadrant properties | ||||||
|---|---|---|---|---|---|---|---|
| Quadrant | DetID | PixID | Counts | Sigma | Mean | Median | Sigma |
| A | 12 | 3 | 1008786 | 12370.19 | 325 | 317 | 81.5 |
| A | 15 | 174 | 199182 | 2439.34 | 325 | 317 | 81.5 |
| A | 4 | 175 | 151175 | 1850.47 | 325 | 317 | 81.5 |
| B | 5 | 185 | 122193 | 1713.98 | 330 | 319 | 71.1 |
| B | 4 | 81 | 92936 | 1302.52 | 330 | 319 | 71.1 |
| B | 10 | 254 | 40808 | 569.42 | 330 | 319 | 71.1 |
| C | 15 | 179 | 5665808 | 171047.76 | 117 | 116 | 33.1 |
| C | 13 | 3 | 72372 | 2181.42 | 117 | 116 | 33.1 |
| C | 0 | 177 | 31362 | 943.32 | 117 | 116 | 33.1 |
| D | 11 | 176 | 2143369 | 26144.95 | 294 | 284 | 82.0 |
| D | 6 | 42 | 508243 | 6196.94 | 294 | 284 | 82.0 |
| D | 2 | 216 | 60300 | 732.18 | 294 | 284 | 82.0 |
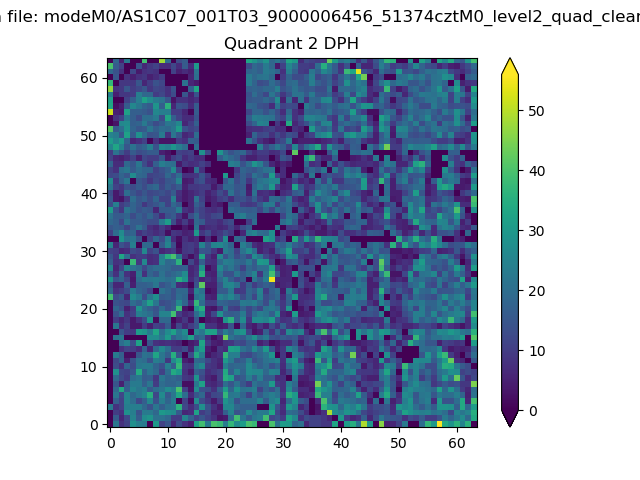
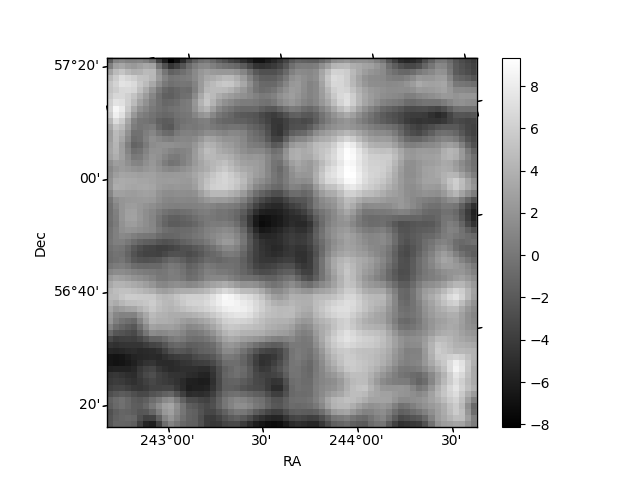
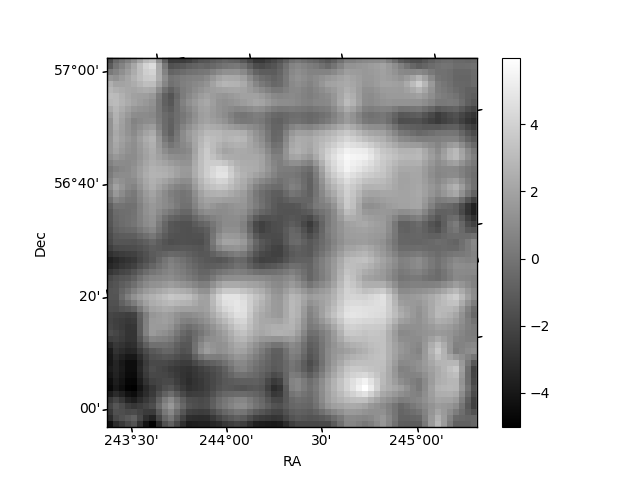
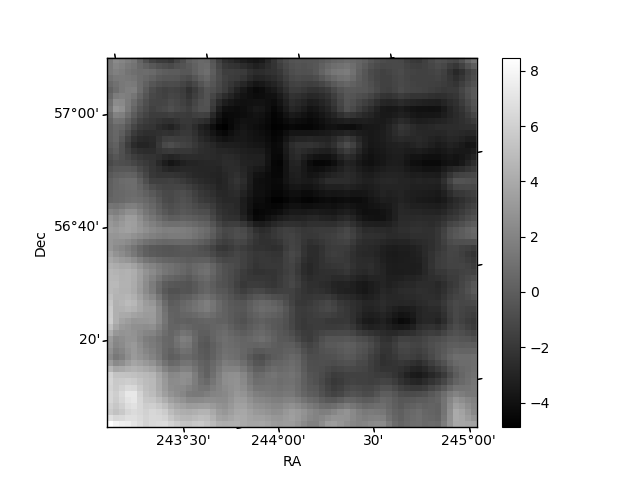
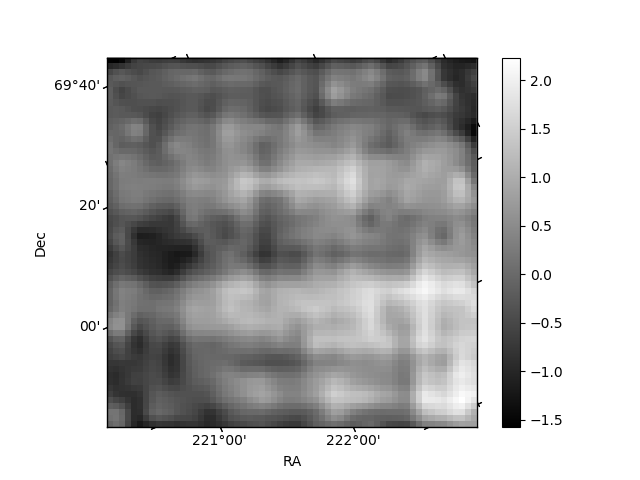
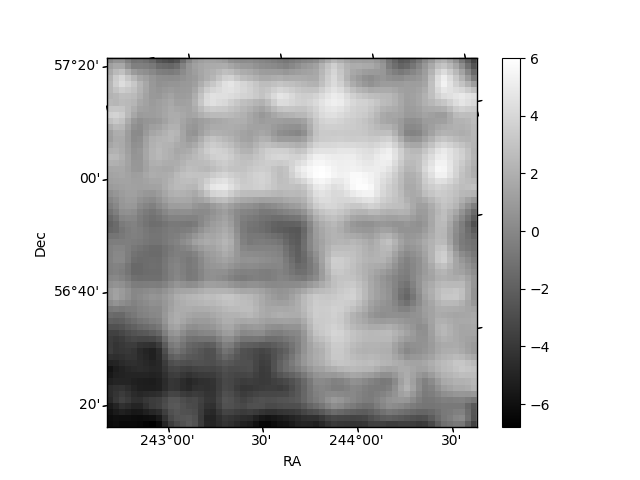
Histogram calculated using DETX and DETY for each event in the final _common_clean file
| Quadrant A | 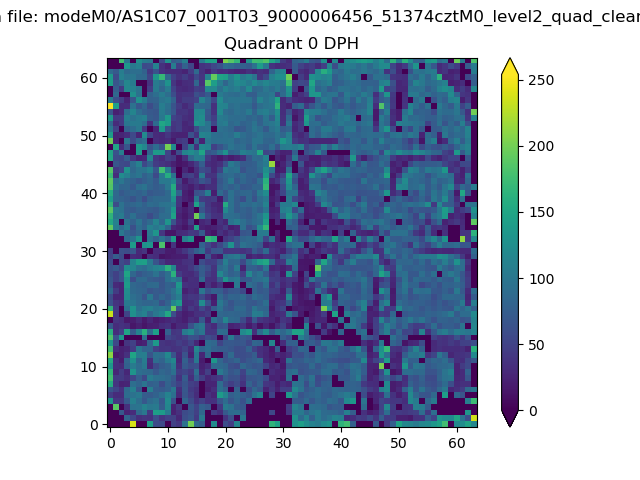 |
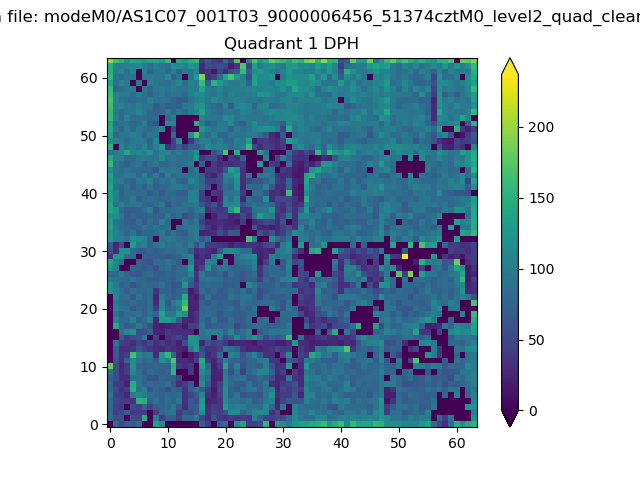 |
Quadrant B |
|---|---|---|---|
| Quadrant D | 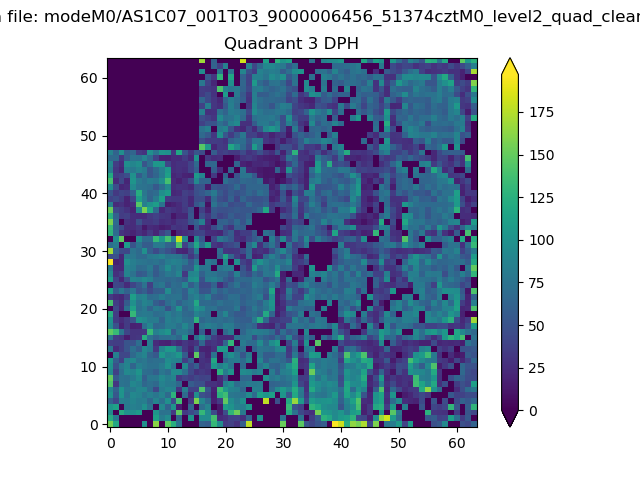 |
 |
Quadrant C |
| Plot type | Count rate plots | Images |
|---|---|---|
| Comparison with Poisson distribution Blue bars denote a histogram of data divided into 1 sec bins. Red curve is a Poisson curve with rate = median count rate of data. |
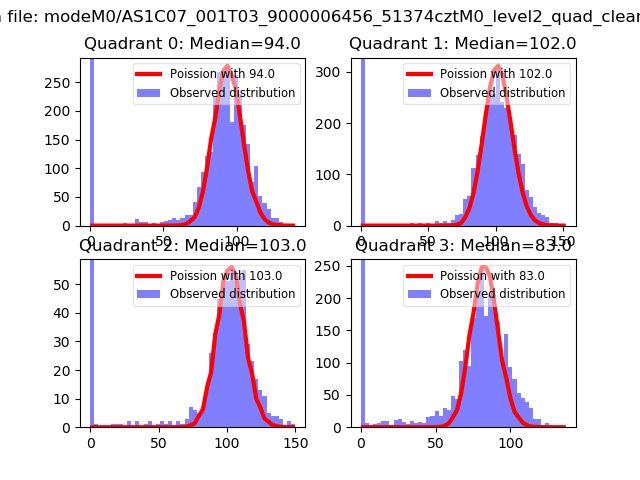 |
 |
| Quadrant-wise count rates Data is divided into 100 sec bins |
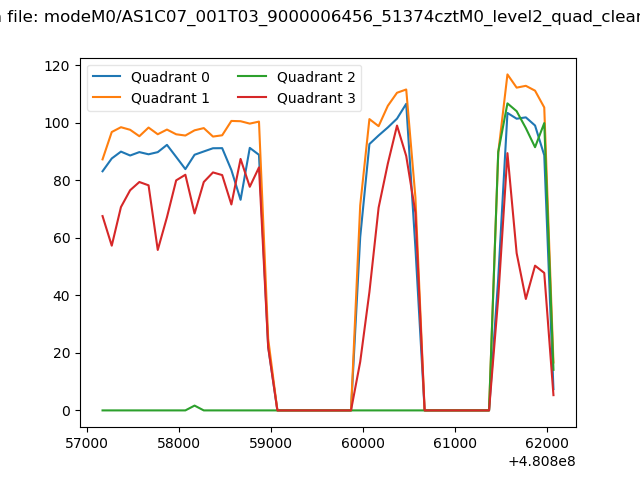 |
|
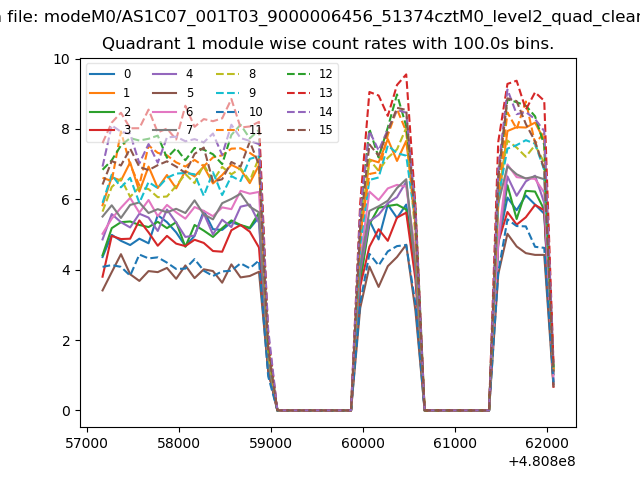
| Module-wise count rates for Quadrant A Data is divided into 100 sec bins |
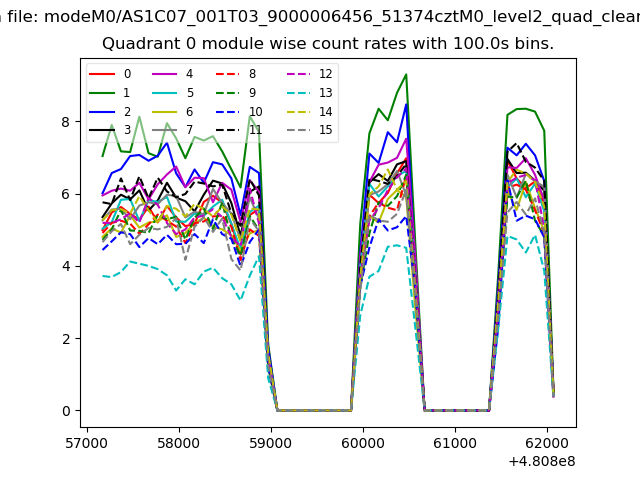 |
 |
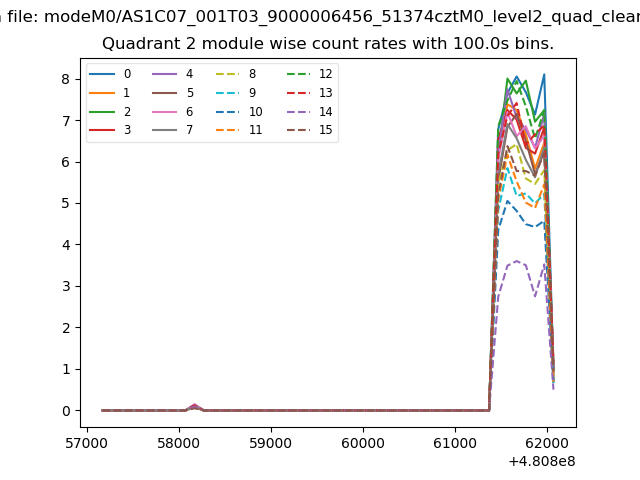
| Module-wise count rates for Quadrant B Data is divided into 100 sec bins |
 |
 |
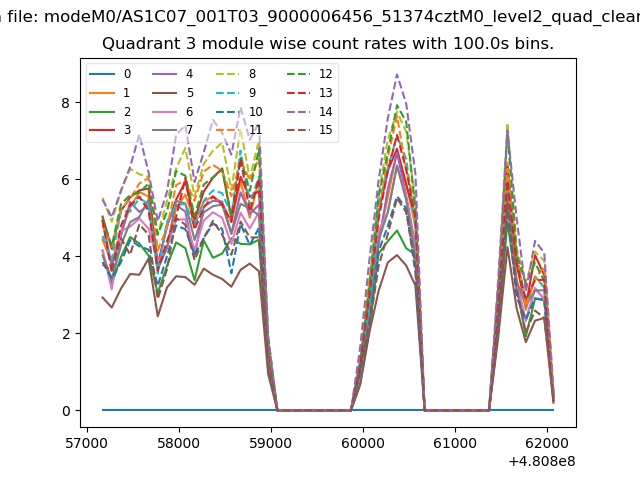
| Module-wise count rates for Quadrant C Data is divided into 100 sec bins |
 |
 |
| Module-wise count rates for Quadrant D Data is divided into 100 sec bins |
 |
 |
| Parameter | Plot |
|---|---|
| CZT HV Monitor | 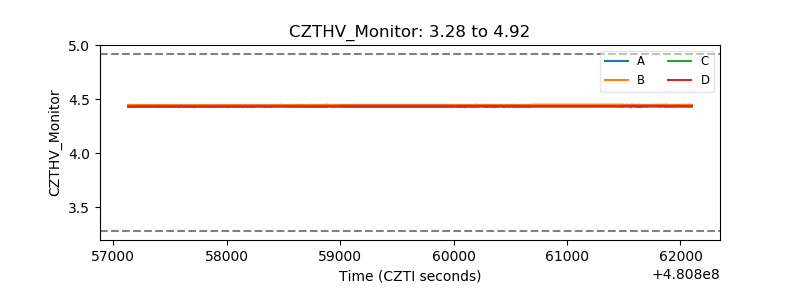 |
| D_VDD | 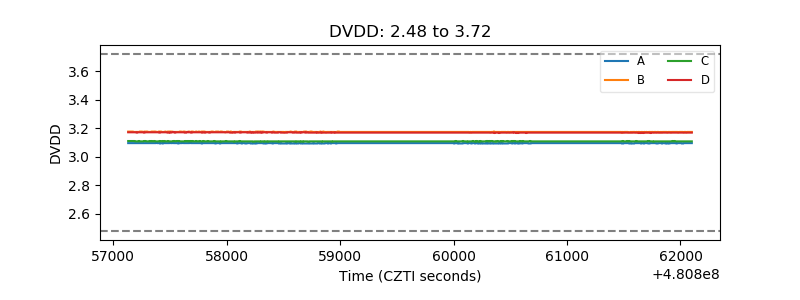 |
| Temperature 1 | 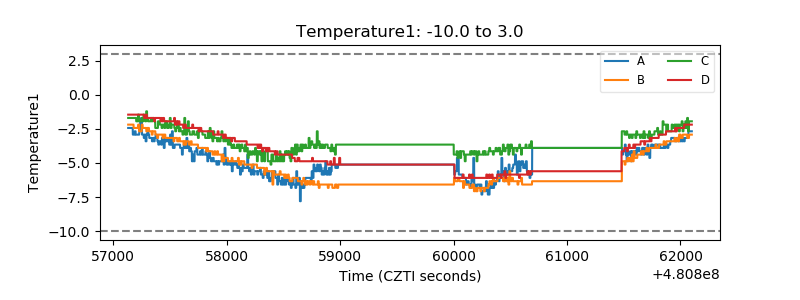 |
| Veto HV Monitor | 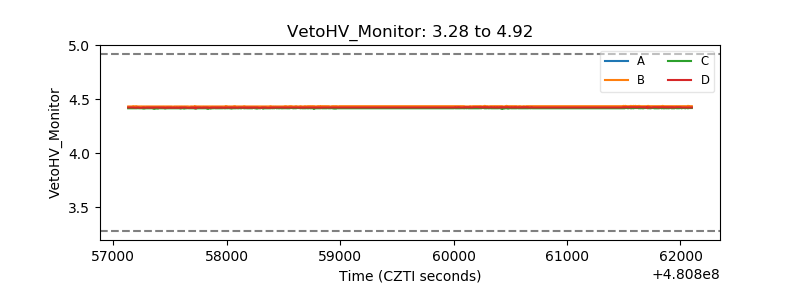 |
| Veto LLD | 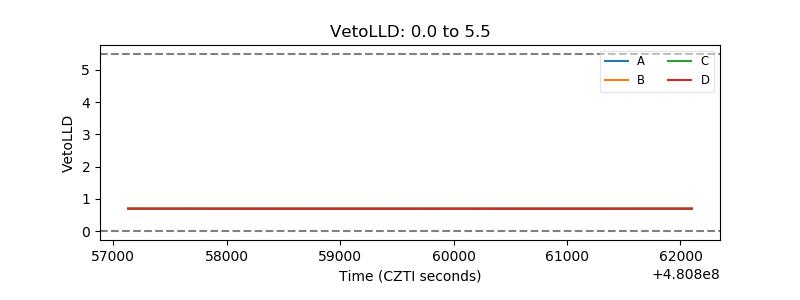 |
| Alpha Counter | 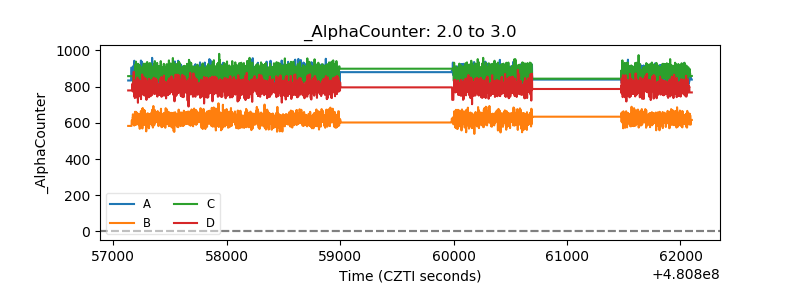 |
| _CPM_Rate | 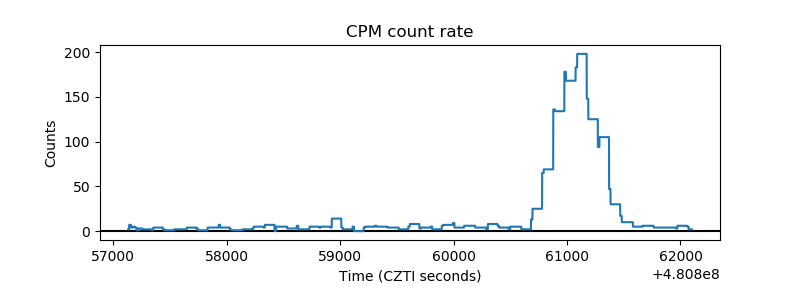 |
| CZT Counter | 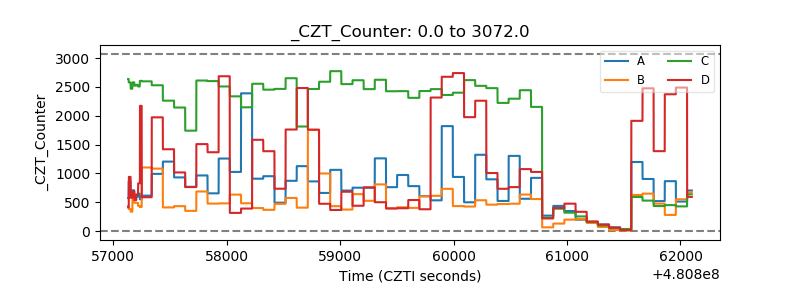 |
| +2.5 Volts monitor | 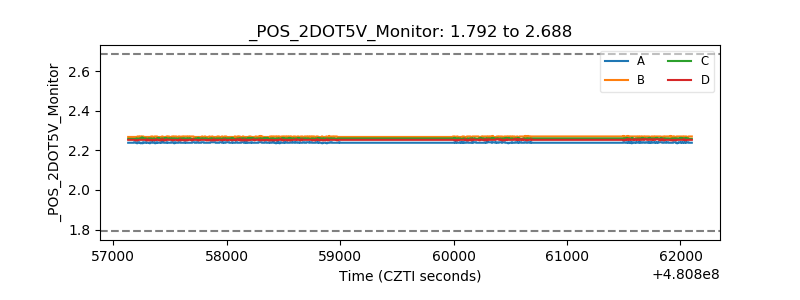 |
| +5 Volts monitor | 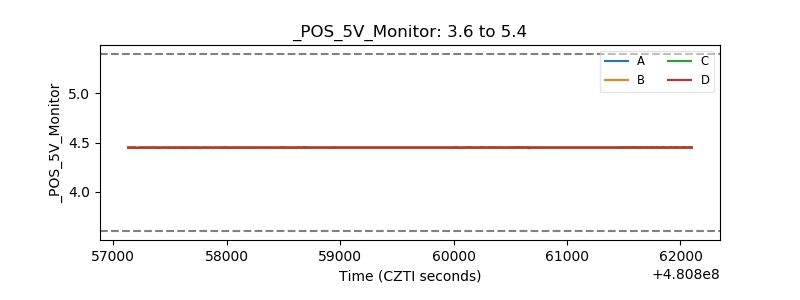 |
| _ROLL_ROT | 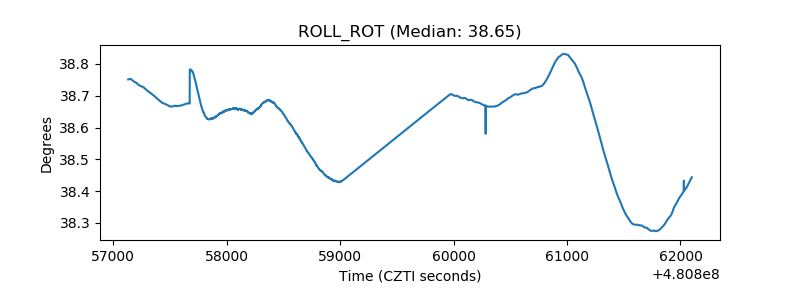 |
| _Roll_DEC | 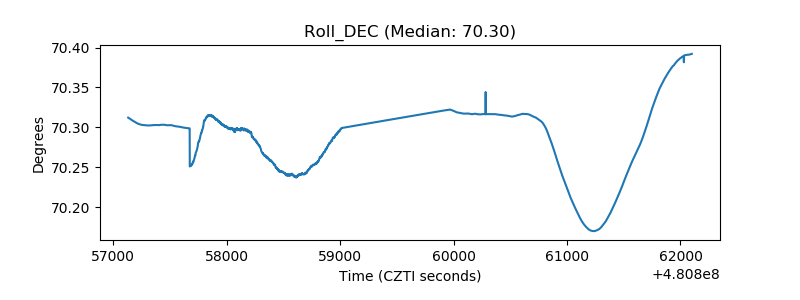 |
| _Roll_RA | 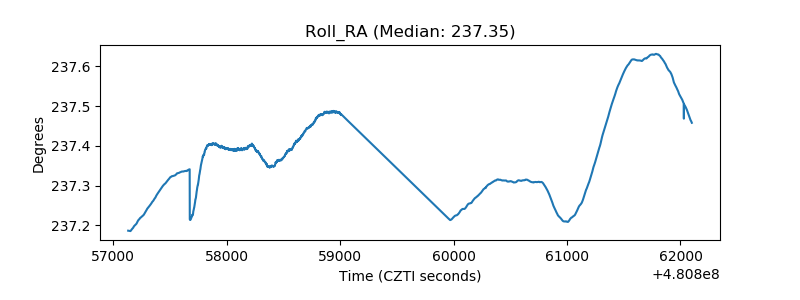 |
| Veto Counter | 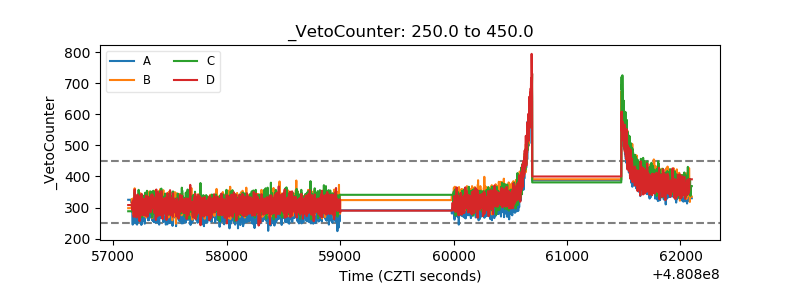 |