| Param | Original file | Final file |
|---|---|---|
| Filename | modeM0/AS1C07_001T03_9000006456_51378cztM0_level2.fits | modeM0/AS1C07_001T03_9000006456_51378cztM0_level2_quad_clean.evt |
| Size (bytes) | 198,745,920 | 17,498,880 |
| Size | 189.5 MB | 16.7 MB |
| Events in quadrant A | 1,105,953 | 134,649 |
| Events in quadrant B | 800,578 | 159,948 |
| Events in quadrant C | 3,156,201 | 29,157 |
| Events in quadrant D | 2,188,054 | 106,448 |
| Mode SS | |||
|---|---|---|---|
| Quadrant | BADHDUFLAG | Total packets | Discarded packets |
| A | 0 | 32 | 6 |
| B | 0 | 29 | 3 |
| C | 0 | 31 | 5 |
| D | 0 | 27 | 1 |
| Mode M0 | |||
|---|---|---|---|
| Quadrant | BADHDUFLAG | Total packets | Discarded packets |
| A | 0 | 4415 | 270 |
| B | 0 | 3477 | 209 |
| C | 0 | 10850 | 556 |
| D | 0 | 7778 | 353 |
| Mode M9 | |||
|---|---|---|---|
| Quadrant | BADHDUFLAG | Total packets | Discarded packets |
| A | 0 | 13 | 4 |
| B | 0 | 11 | 2 |
| C | 0 | 10 | 1 |
| D | 0 | 9 | 0 |
| Quadrant | Total seconds | Saturated seconds | Saturation percentage |
|---|---|---|---|
| A | 1339 | 127 | 9.484690% |
| B | 1338 | 17 | 1.270553% |
| C | 1337 | 1110 | 83.021690% |
| D | 1330 | 335 | 25.187970% |
Noise dominated data is calculated using 1-second bins in cleaned event files. If a bin has >2000 counts, and if more than 50% of those come from <1% of pixels, then it is considered to be noise-dominated and hence unusable.
| Quadrant | # 1 sec bins | Bins with >0 counts | Bins with >2000 counts | High rate bins dominated by noise | Noise dominated (total time) | Noise dominated (detector-on time) | Marked lightcurve |
|---|---|---|---|---|---|---|---|
| A | 1344 | 1342 | 96 | 96 | 7.14% | 7.15% | 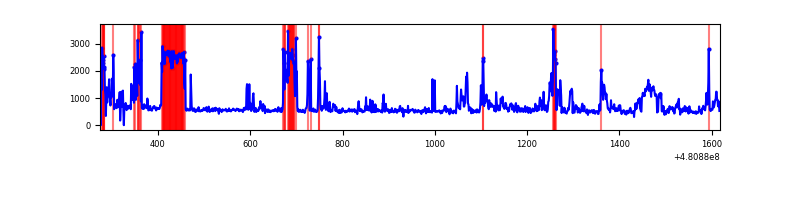 |
| B | 1343 | 1343 | 5 | 5 | 0.37% | 0.37% | 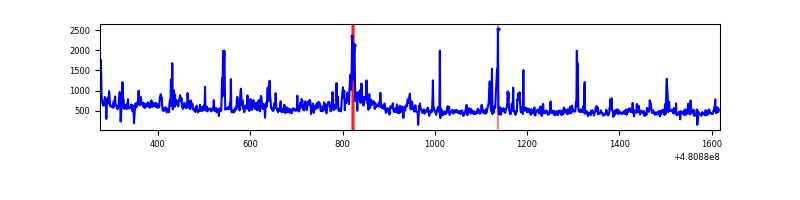 |
| C | 1342 | 1338 | 1054 | 1054 | 78.54% | 78.77% | 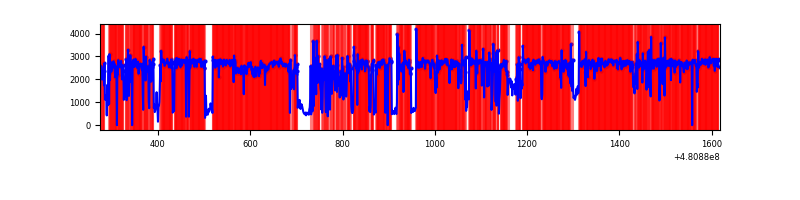 |
| D | 1343 | 1339 | 307 | 307 | 22.86% | 22.93% | 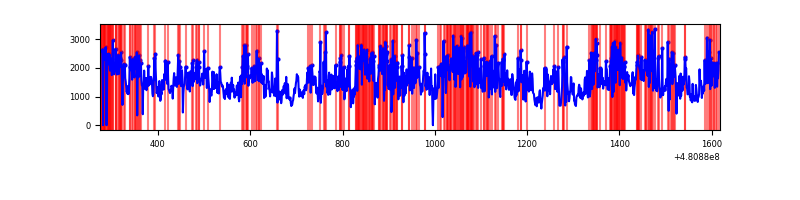 |
Top three noisy pixels from each quadrant. If the there are fewer than three noisy pixels in the level2.evt file, extra rows are filled as -1
| Pixel properties | Quadrant properties | ||||||
|---|---|---|---|---|---|---|---|
| Quadrant | DetID | PixID | Counts | Sigma | Mean | Median | Sigma |
| A | 4 | 175 | 272399 | 6896.24 | 154 | 149 | 39.5 |
| A | 12 | 3 | 88331 | 2233.7 | 154 | 149 | 39.5 |
| A | 4 | 3 | 44287 | 1118.04 | 154 | 149 | 39.5 |
| B | 4 | 81 | 131515 | 3652.67 | 160 | 154 | 36.0 |
| B | 0 | 216 | 16796 | 462.75 | 160 | 154 | 36.0 |
| B | 8 | 128 | 4278 | 114.67 | 160 | 154 | 36.0 |
| C | 7 | 220 | 2200827 | 108068.81 | 69 | 68 | 20.4 |
| C | 4 | 12 | 380207 | 18666.82 | 69 | 68 | 20.4 |
| C | 15 | 179 | 167880 | 8240.45 | 69 | 68 | 20.4 |
| D | 8 | 176 | 703515 | 16967.56 | 147 | 141 | 41.5 |
| D | 11 | 176 | 640020 | 15435.86 | 147 | 141 | 41.5 |
| D | 6 | 42 | 110989 | 2674.0 | 147 | 141 | 41.5 |
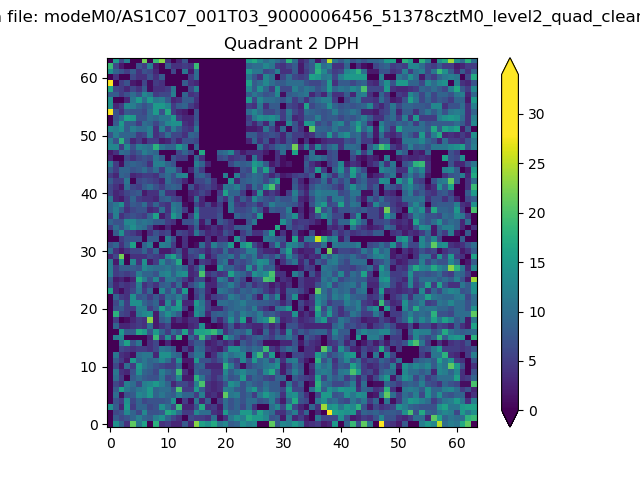
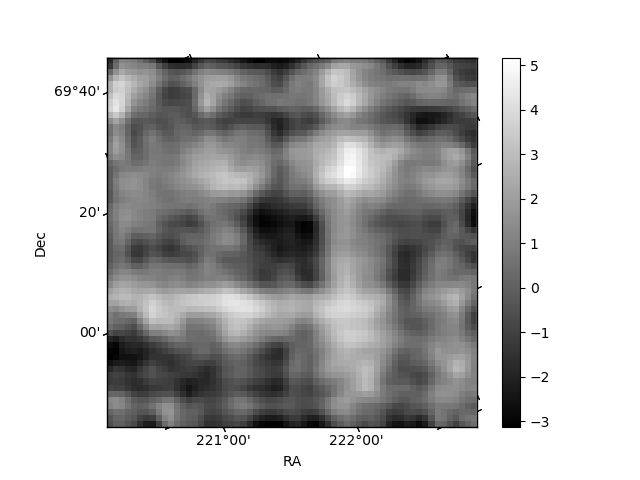
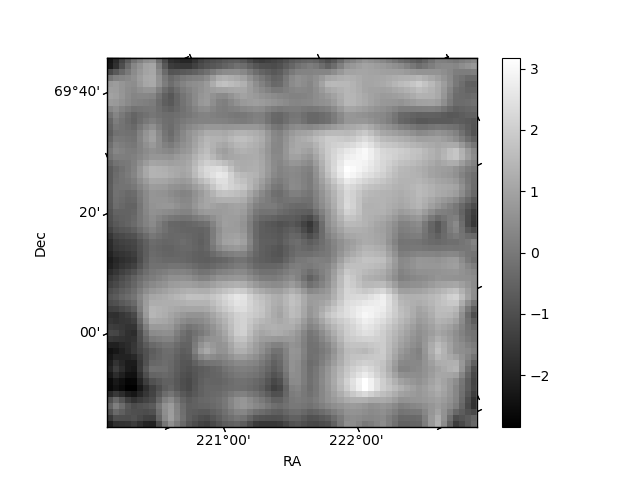
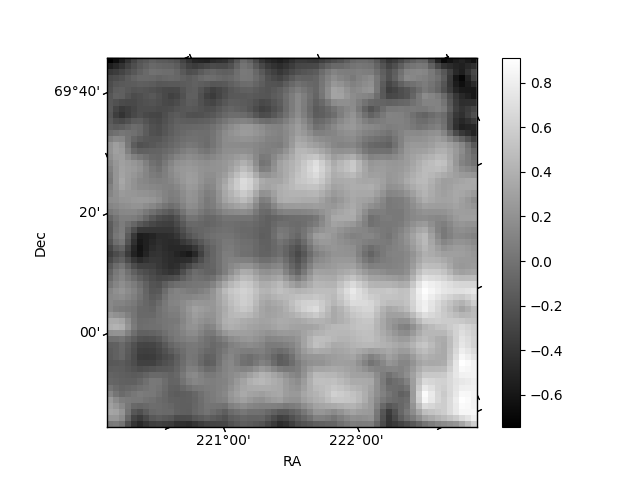
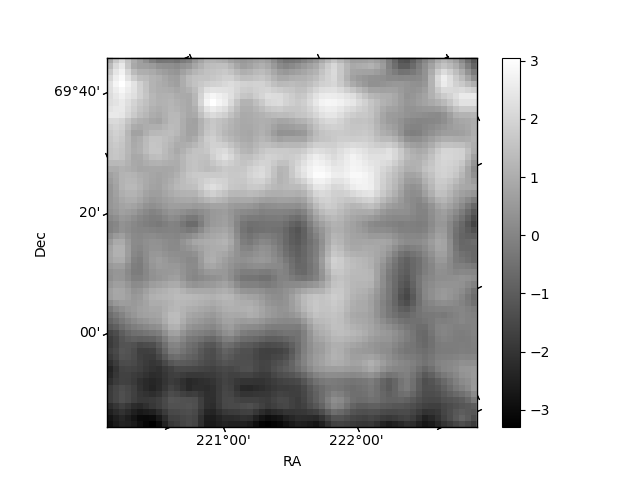
Histogram calculated using DETX and DETY for each event in the final _common_clean file
| Quadrant A | 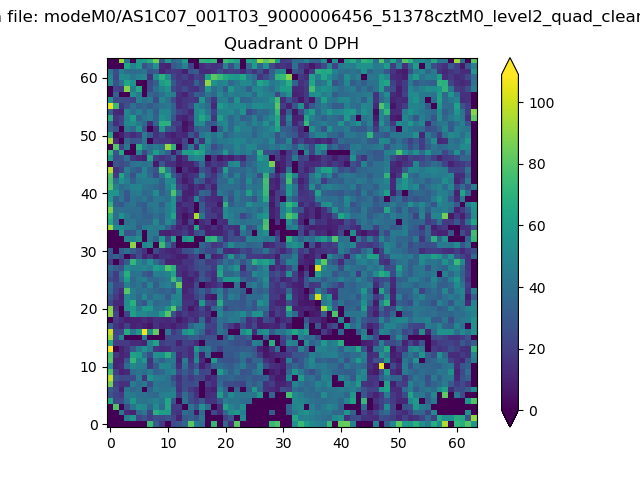 |
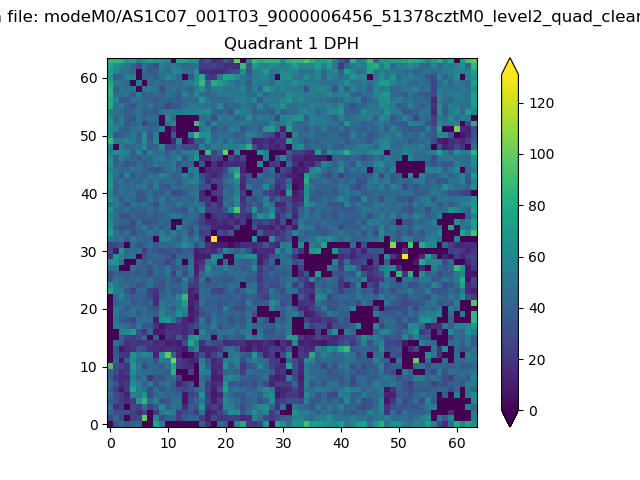 |
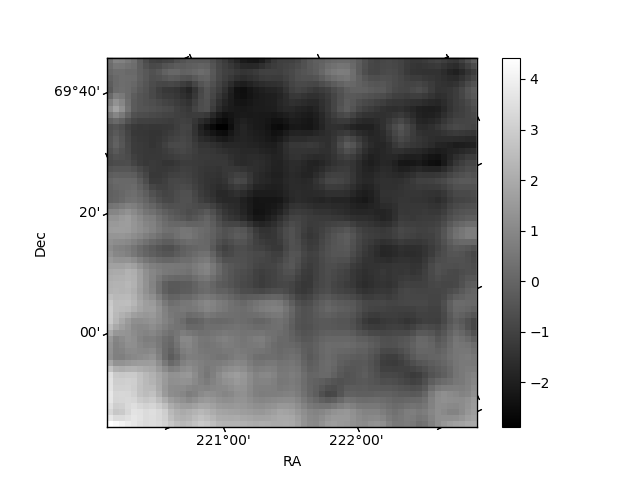
Quadrant B |
|---|---|---|---|
| Quadrant D | 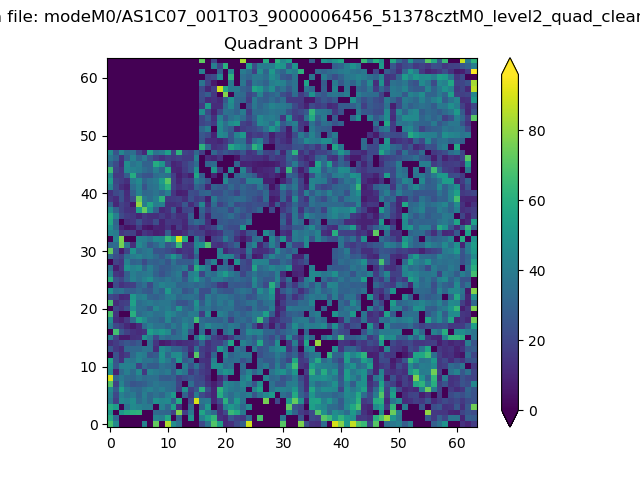 |
 |
Quadrant C |
| Plot type | Count rate plots | Images |
|---|---|---|
| Comparison with Poisson distribution Blue bars denote a histogram of data divided into 1 sec bins. Red curve is a Poisson curve with rate = median count rate of data. |
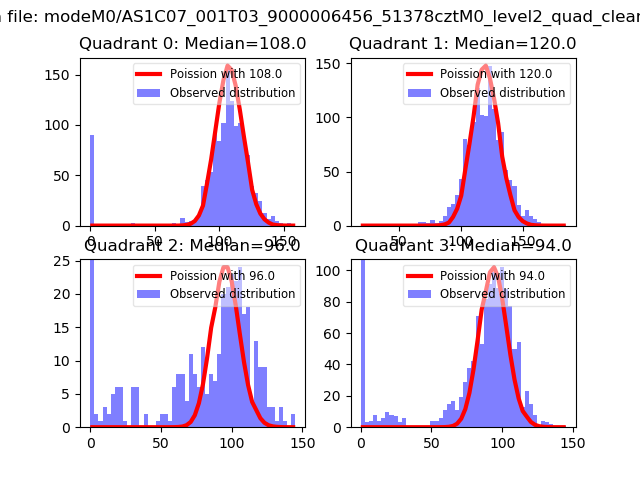 |
 |
| Quadrant-wise count rates Data is divided into 100 sec bins |
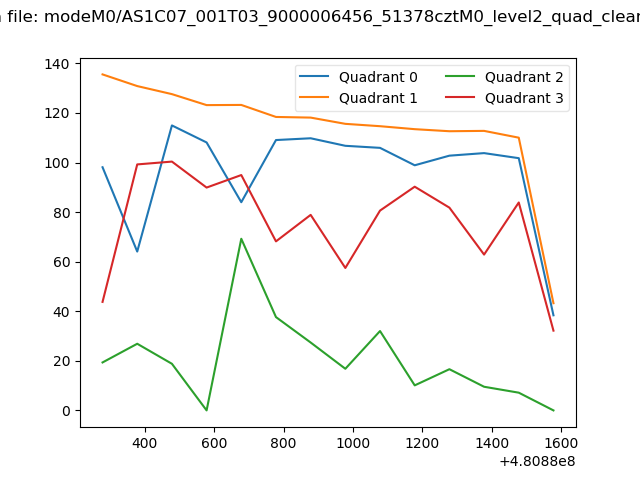 |
|
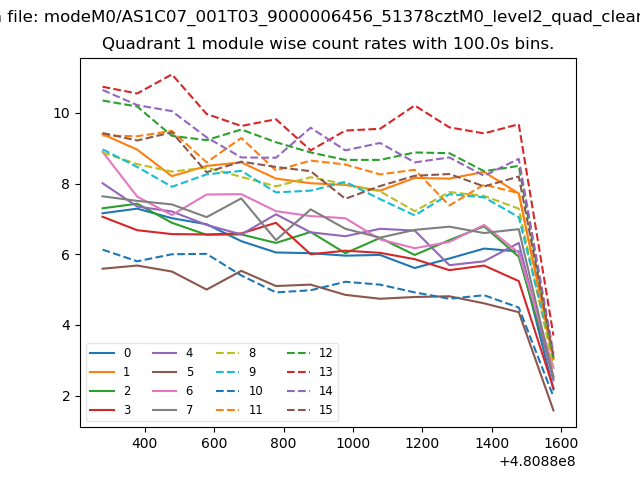
| Module-wise count rates for Quadrant A Data is divided into 100 sec bins |
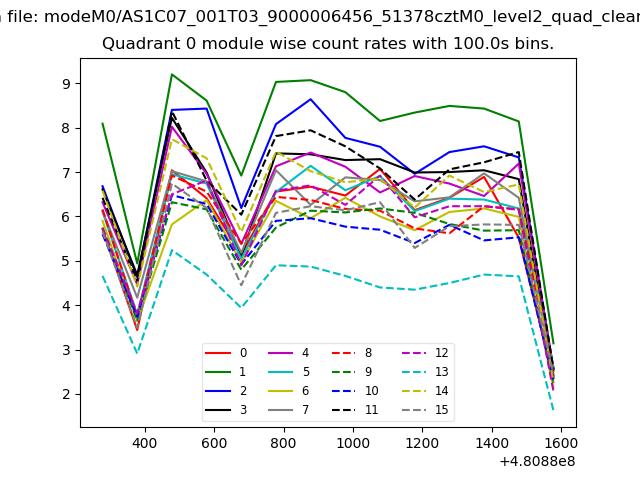 |
 |
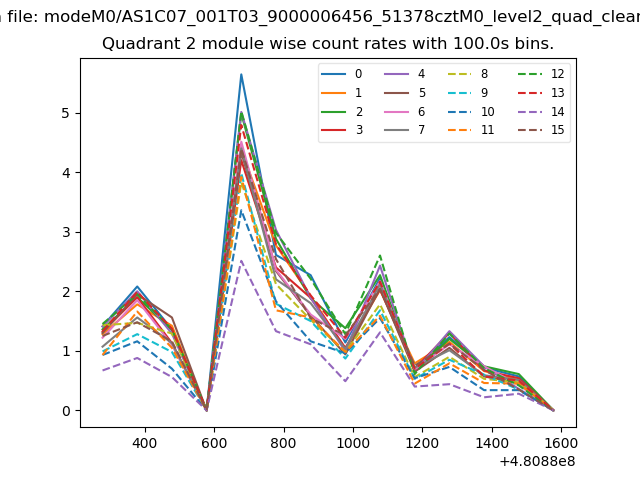
| Module-wise count rates for Quadrant B Data is divided into 100 sec bins |
 |
 |
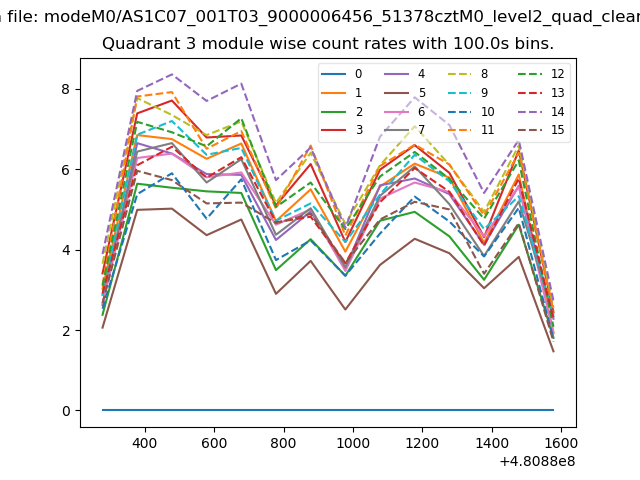
| Module-wise count rates for Quadrant C Data is divided into 100 sec bins |
 |
 |
| Module-wise count rates for Quadrant D Data is divided into 100 sec bins |
 |
 |
| Parameter | Plot |
|---|---|
| CZT HV Monitor | 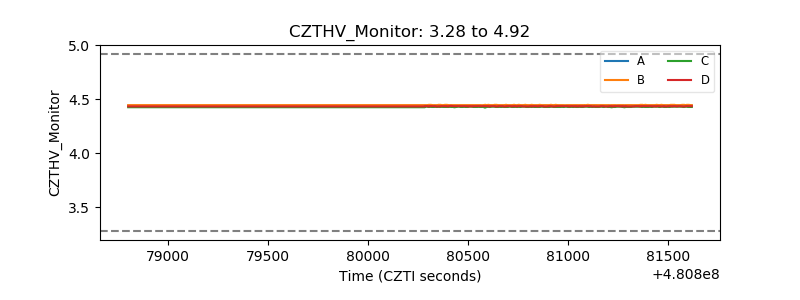 |
| D_VDD | 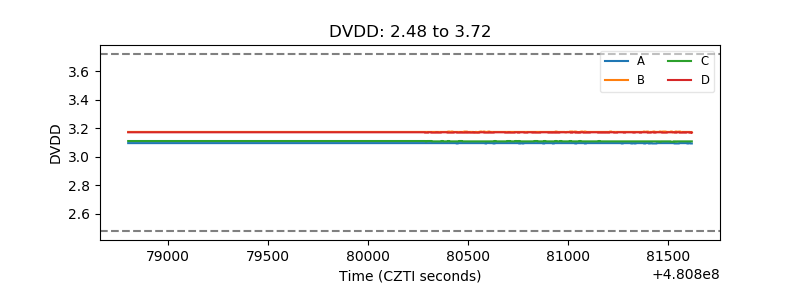 |
| Temperature 1 | 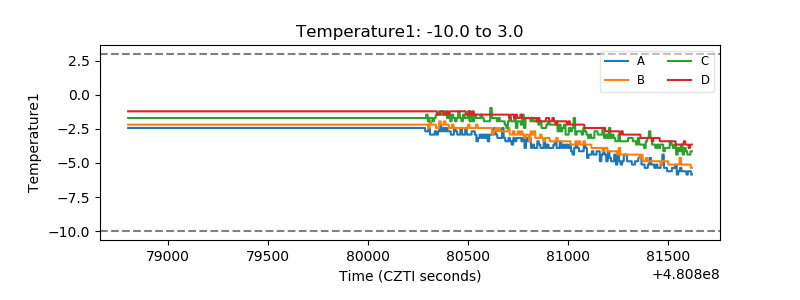 |
| Veto HV Monitor | 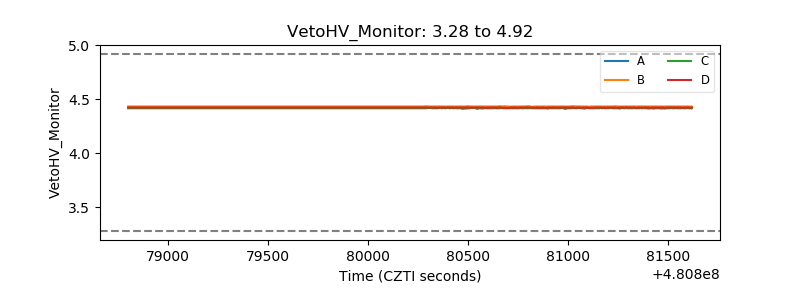 |
| Veto LLD | 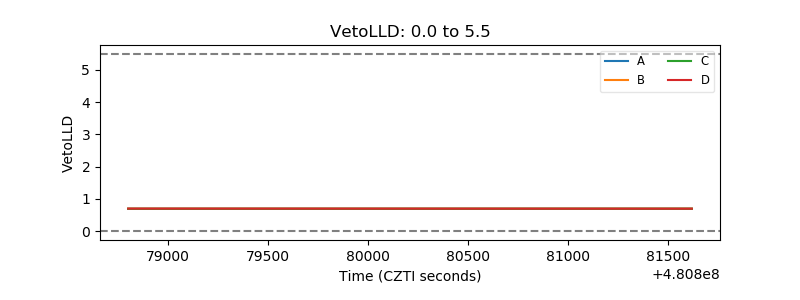 |
| Alpha Counter | 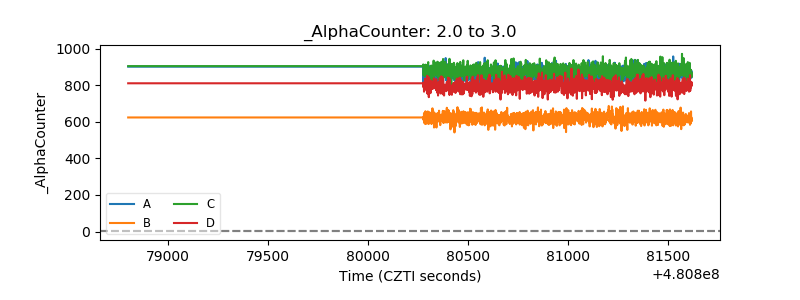 |
| _CPM_Rate | 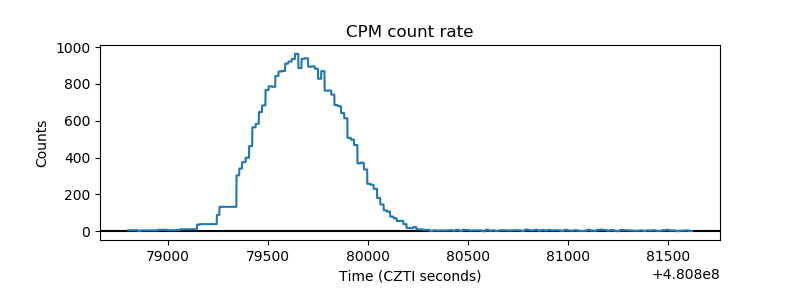 |
| CZT Counter | 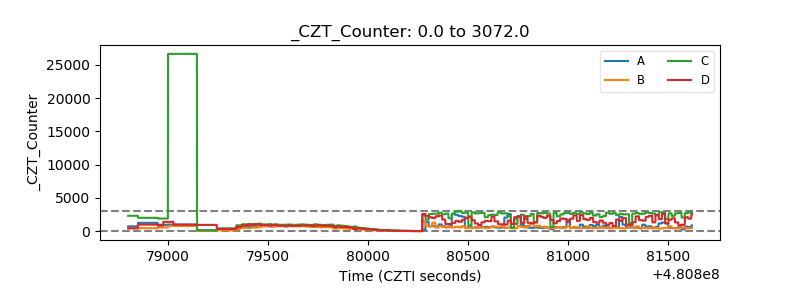 |
| +2.5 Volts monitor | 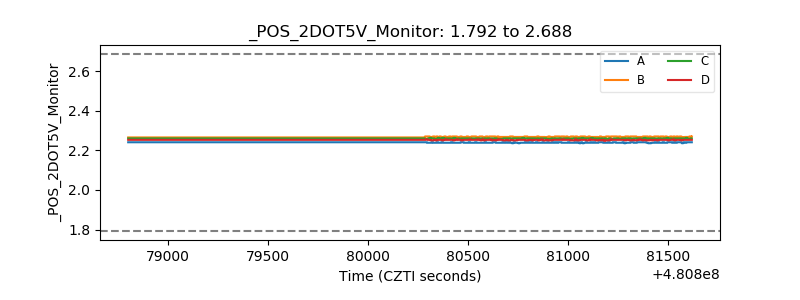 |
| +5 Volts monitor | 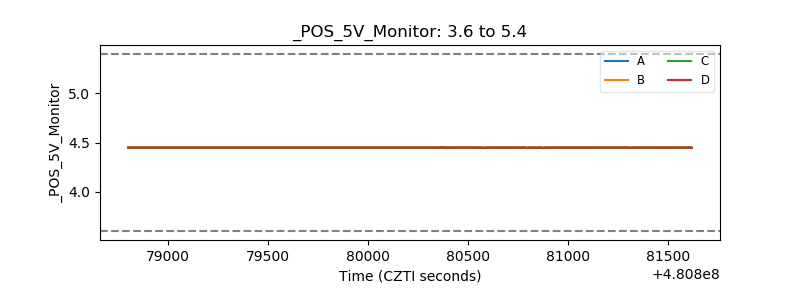 |
| _ROLL_ROT | 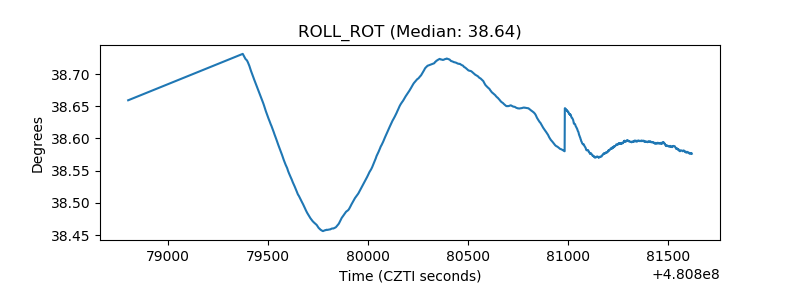 |
| _Roll_DEC | 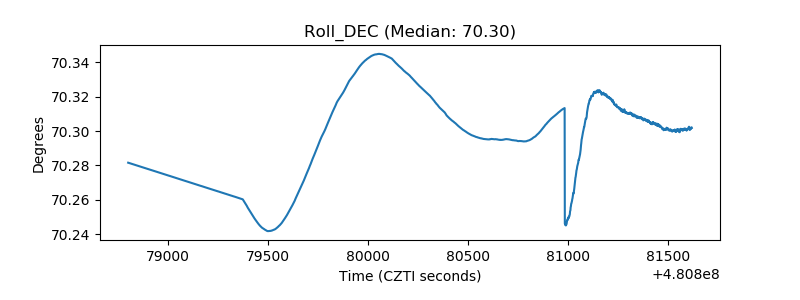 |
| _Roll_RA | 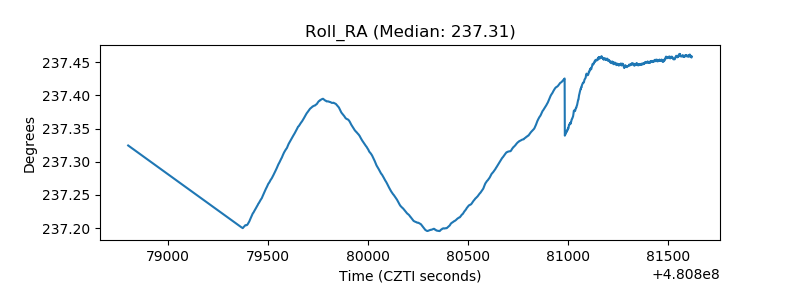 |
| Veto Counter | 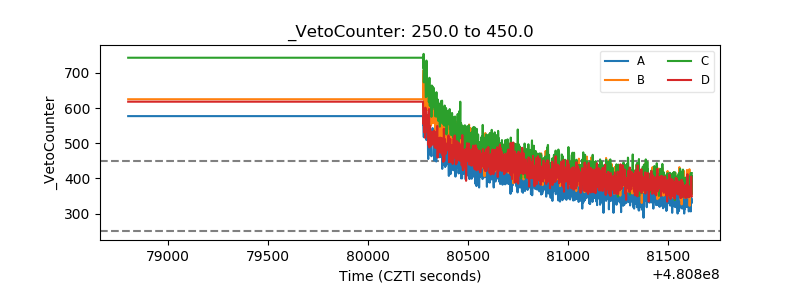 |