| Param | Original file | Final file |
|---|---|---|
| Filename | modeM0/AS1C07_001T03_9000006456_51379cztM0_level2.fits | modeM0/AS1C07_001T03_9000006456_51379cztM0_level2_quad_clean.evt |
| Size (bytes) | 350,268,480 | 29,252,160 |
| Size | 334.0 MB | 27.9 MB |
| Events in quadrant A | 3,275,515 | 192,486 |
| Events in quadrant B | 1,585,891 | 256,046 |
| Events in quadrant C | 4,860,709 | 64,000 |
| Events in quadrant D | 3,055,582 | 200,058 |
| Mode SS | |||
|---|---|---|---|
| Quadrant | BADHDUFLAG | Total packets | Discarded packets |
| A | 0 | 59 | 7 |
| B | 0 | 58 | 7 |
| C | 0 | 60 | 9 |
| D | 0 | 59 | 7 |
| Mode M0 | |||
|---|---|---|---|
| Quadrant | BADHDUFLAG | Total packets | Discarded packets |
| A | 0 | 13123 | 1694 |
| B | 0 | 7579 | 1124 |
| C | 0 | 19544 | 3455 |
| D | 0 | 13098 | 2354 |
| Mode M9 | |||
|---|---|---|---|
| Quadrant | BADHDUFLAG | Total packets | Discarded packets |
| A | 0 | 13 | 1 |
| B | 0 | 13 | 1 |
| C | 0 | 13 | 1 |
| D | 0 | 13 | 1 |
| Quadrant | Total seconds | Saturated seconds | Saturation percentage |
|---|---|---|---|
| A | 2412 | 516 | 21.393035% |
| B | 2425 | 116 | 4.783505% |
| C | 2393 | 1797 | 75.094024% |
| D | 2395 | 342 | 14.279749% |
Noise dominated data is calculated using 1-second bins in cleaned event files. If a bin has >2000 counts, and if more than 50% of those come from <1% of pixels, then it is considered to be noise-dominated and hence unusable.
| Quadrant | # 1 sec bins | Bins with >0 counts | Bins with >2000 counts | High rate bins dominated by noise | Noise dominated (total time) | Noise dominated (detector-on time) | Marked lightcurve |
|---|---|---|---|---|---|---|---|
| A | 4496 | 2427 | 384 | 384 | 8.54% | 15.82% | 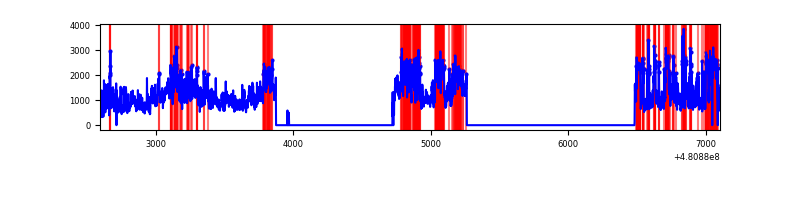 |
| B | 4510 | 2442 | 39 | 39 | 0.86% | 1.60% | 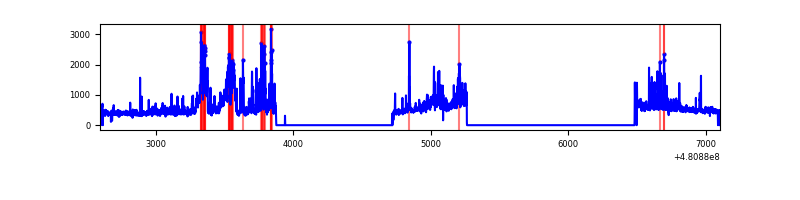 |
| C | 4507 | 2398 | 1742 | 1742 | 38.65% | 72.64% | 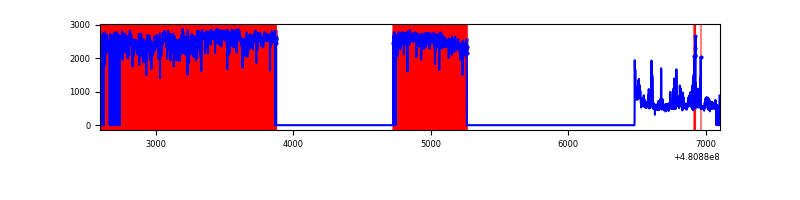 |
| D | 4492 | 2418 | 400 | 400 | 8.90% | 16.54% | 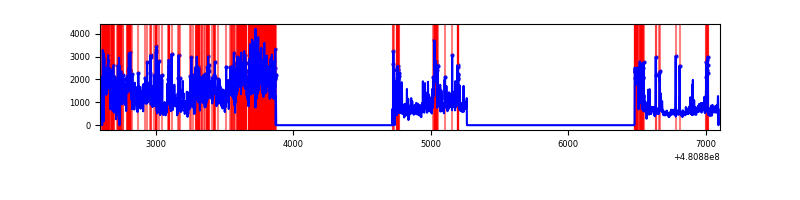 |
Top three noisy pixels from each quadrant. If the there are fewer than three noisy pixels in the level2.evt file, extra rows are filled as -1
| Pixel properties | Quadrant properties | ||||||
|---|---|---|---|---|---|---|---|
| Quadrant | DetID | PixID | Counts | Sigma | Mean | Median | Sigma |
| A | 12 | 3 | 996241 | 16610.47 | 236 | 229 | 60.0 |
| A | 15 | 174 | 542827 | 9048.9 | 236 | 229 | 60.0 |
| A | 4 | 175 | 490261 | 8172.25 | 236 | 229 | 60.0 |
| B | 4 | 81 | 138091 | 2411.36 | 262 | 252 | 57.2 |
| B | 0 | 172 | 119905 | 2093.22 | 262 | 252 | 57.2 |
| B | 8 | 128 | 99612 | 1738.21 | 262 | 252 | 57.2 |
| C | 15 | 179 | 2427318 | 74407.91 | 114 | 112 | 32.6 |
| C | 4 | 12 | 974868 | 29881.9 | 114 | 112 | 32.6 |
| C | 7 | 220 | 818566 | 25090.34 | 114 | 112 | 32.6 |
| D | 8 | 176 | 766238 | 11054.72 | 243 | 234 | 69.3 |
| D | 11 | 176 | 733797 | 10586.54 | 243 | 234 | 69.3 |
| D | 7 | 60 | 259695 | 3744.46 | 243 | 234 | 69.3 |
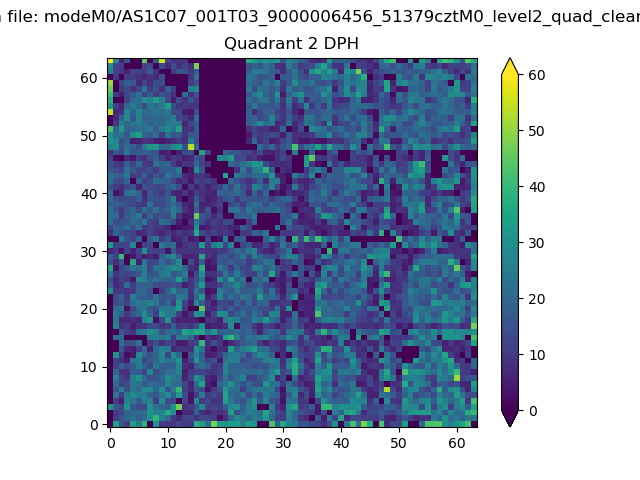
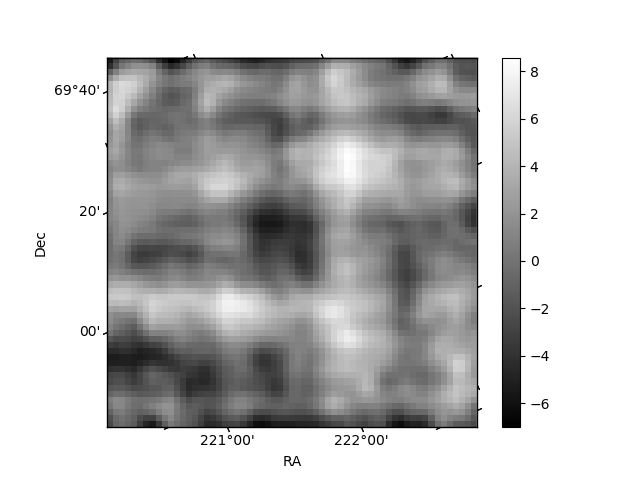
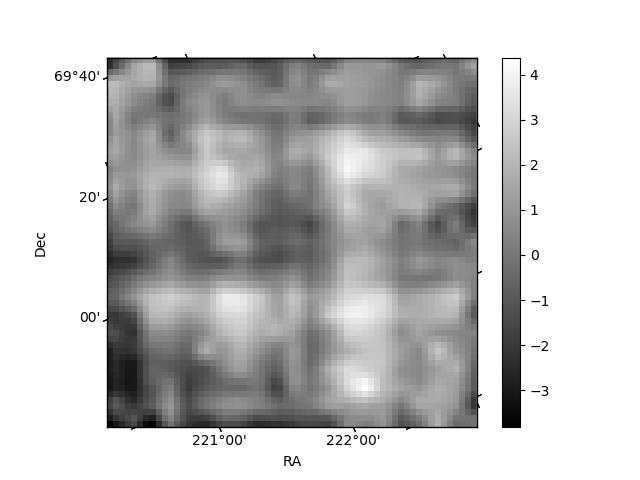
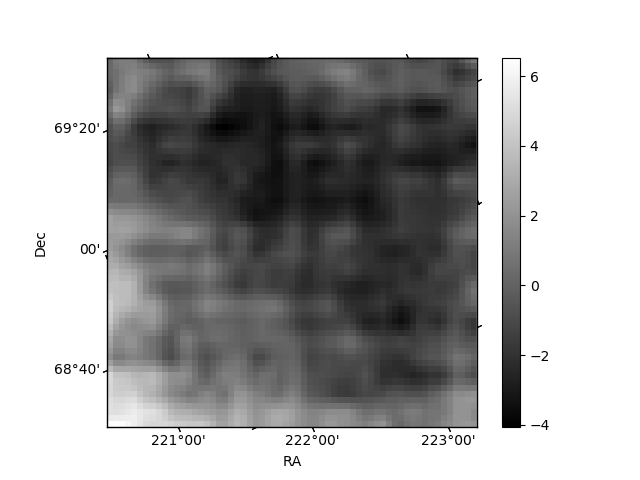
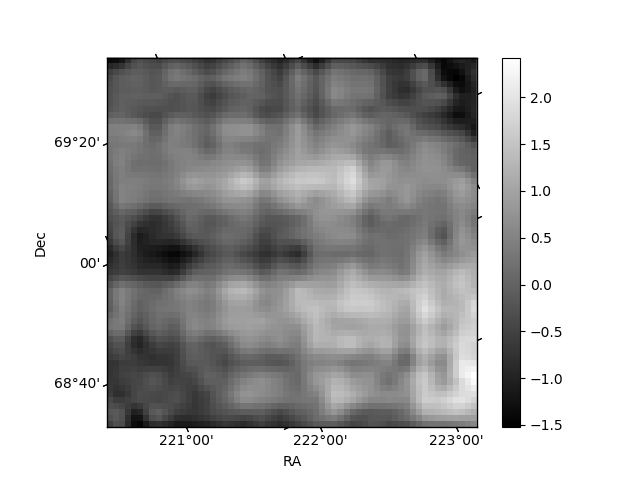
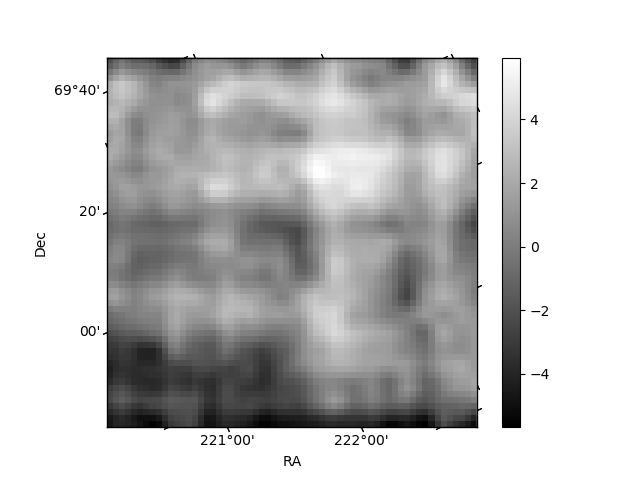
Histogram calculated using DETX and DETY for each event in the final _common_clean file
| Quadrant A | 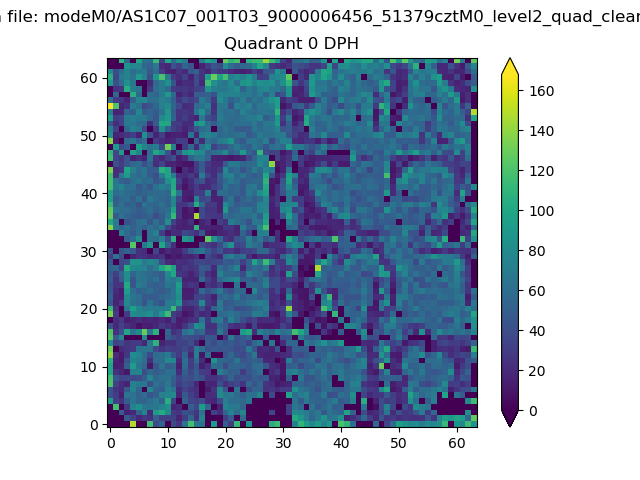 |
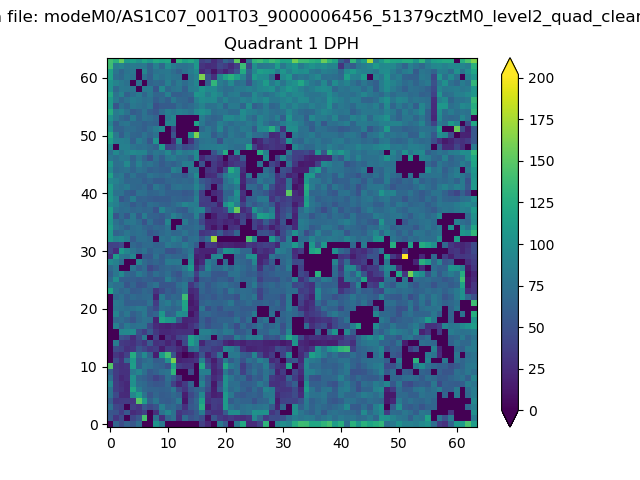 |
Quadrant B |
|---|---|---|---|
| Quadrant D | 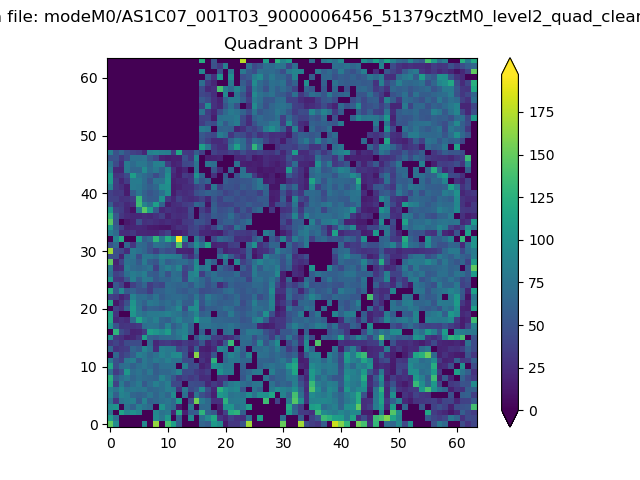 |
 |
Quadrant C |
| Plot type | Count rate plots | Images |
|---|---|---|
| Comparison with Poisson distribution Blue bars denote a histogram of data divided into 1 sec bins. Red curve is a Poisson curve with rate = median count rate of data. |
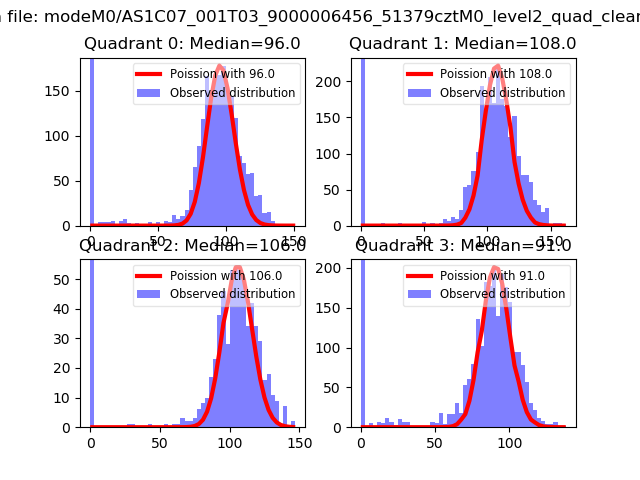 |
 |
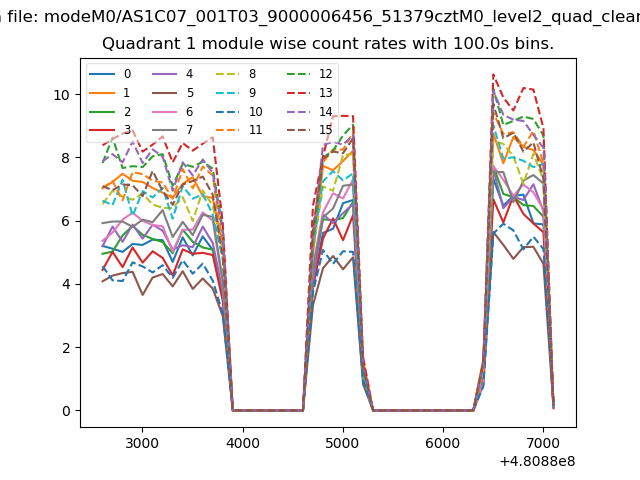
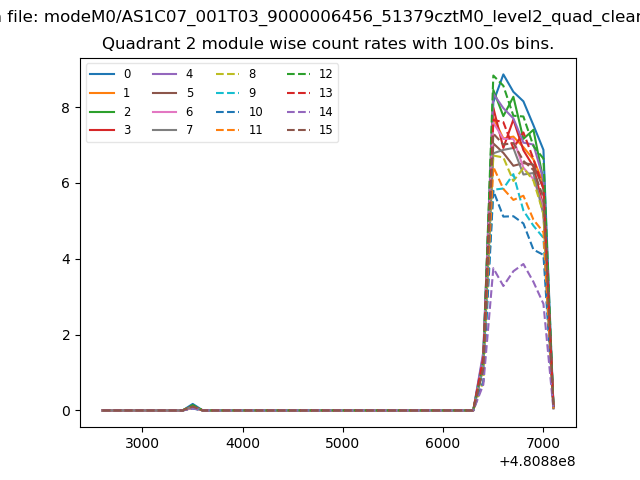
| Quadrant-wise count rates Data is divided into 100 sec bins |
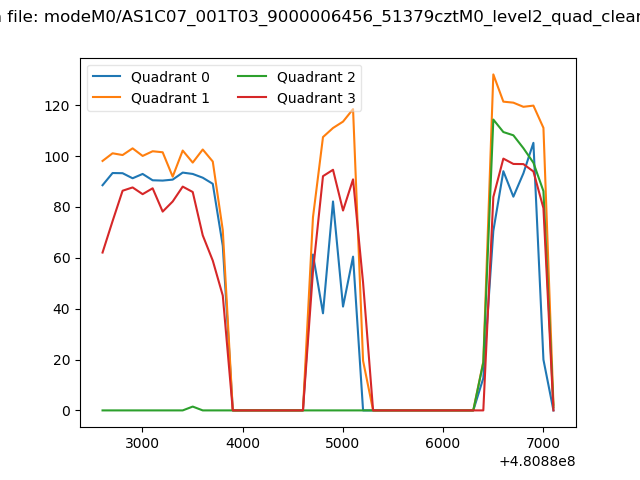 |
|
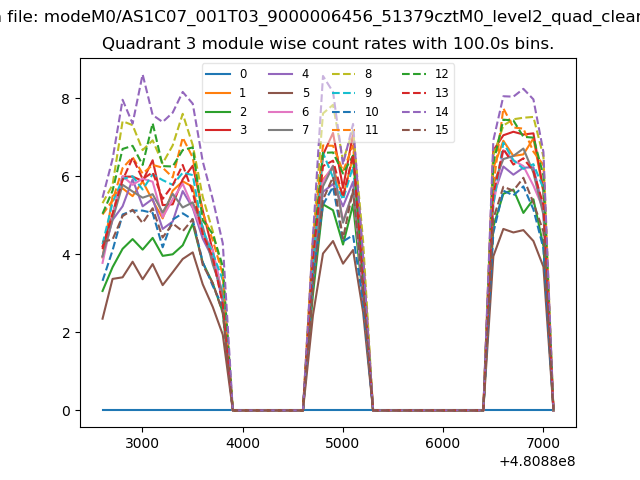
| Module-wise count rates for Quadrant A Data is divided into 100 sec bins |
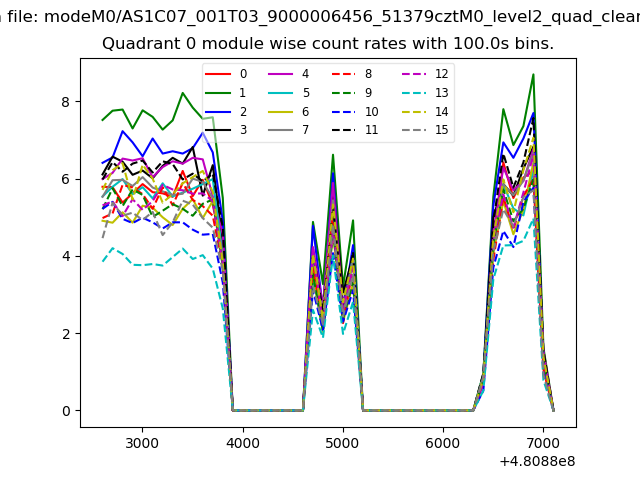 |
 |
| Module-wise count rates for Quadrant B Data is divided into 100 sec bins |
 |
 |
| Module-wise count rates for Quadrant C Data is divided into 100 sec bins |
 |
 |
| Module-wise count rates for Quadrant D Data is divided into 100 sec bins |
 |
 |
| Parameter | Plot |
|---|---|
| CZT HV Monitor | 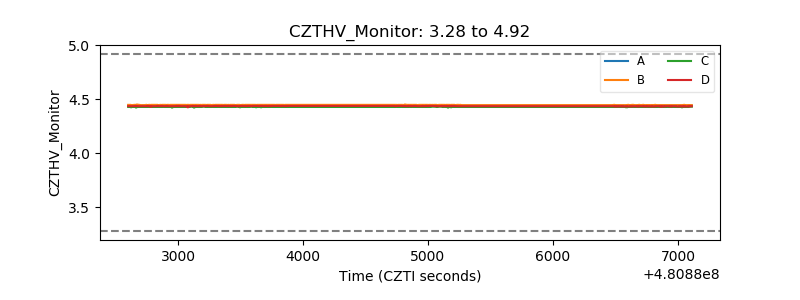 |
| D_VDD | 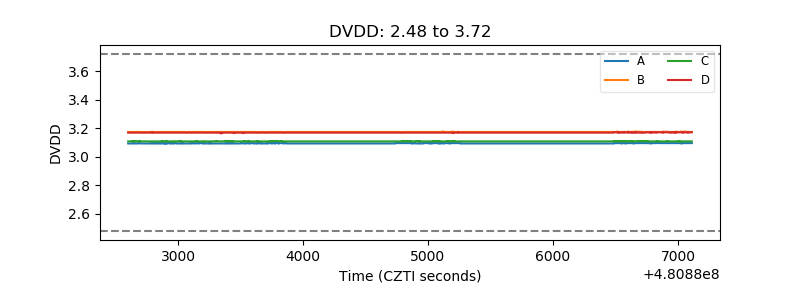 |
| Temperature 1 | 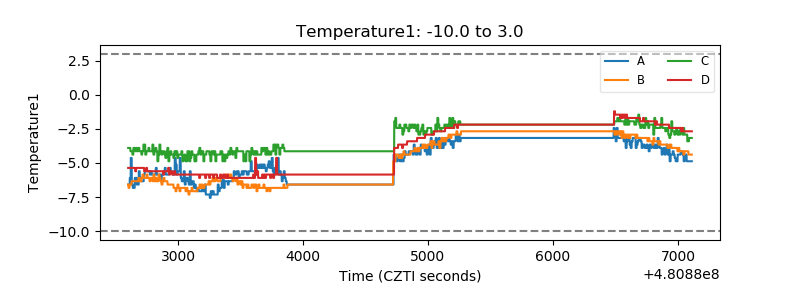 |
| Veto HV Monitor | 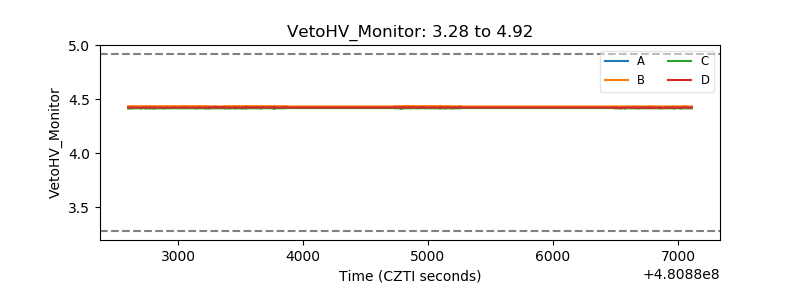 |
| Veto LLD | 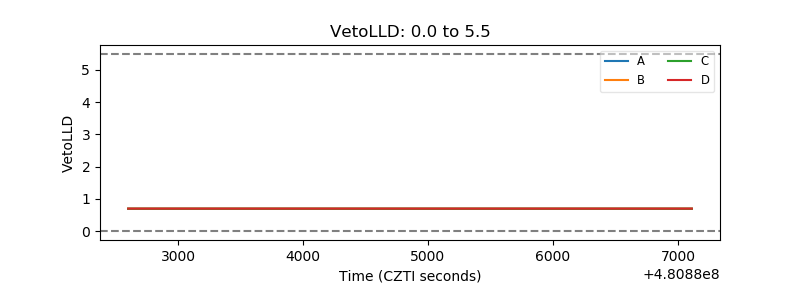 |
| Alpha Counter | 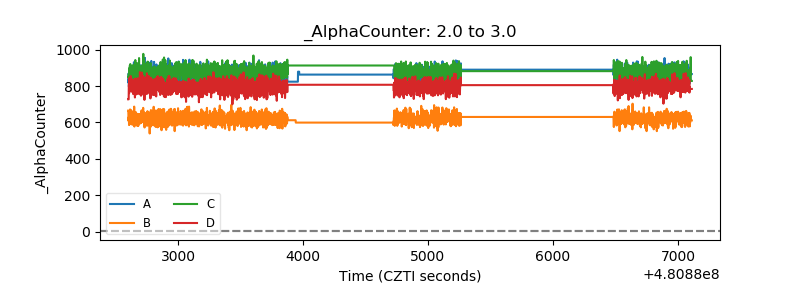 |
| _CPM_Rate | 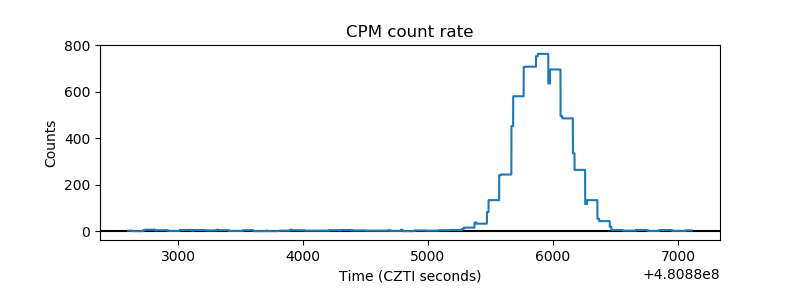 |
| CZT Counter | 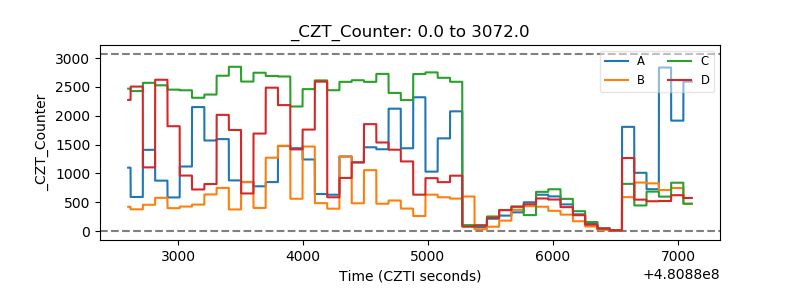 |
| +2.5 Volts monitor | 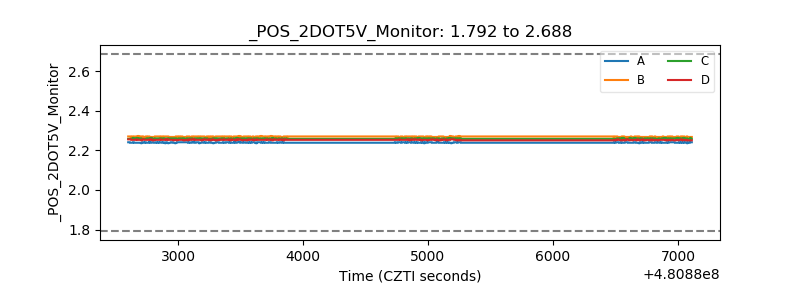 |
| +5 Volts monitor | 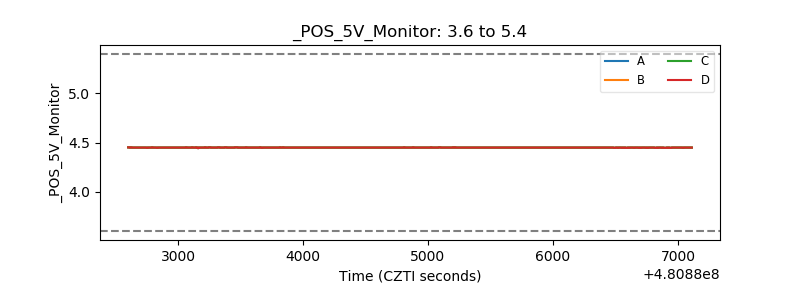 |
| _ROLL_ROT | 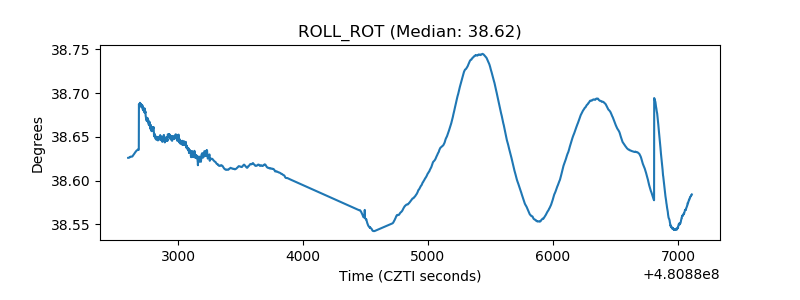 |
| _Roll_DEC | 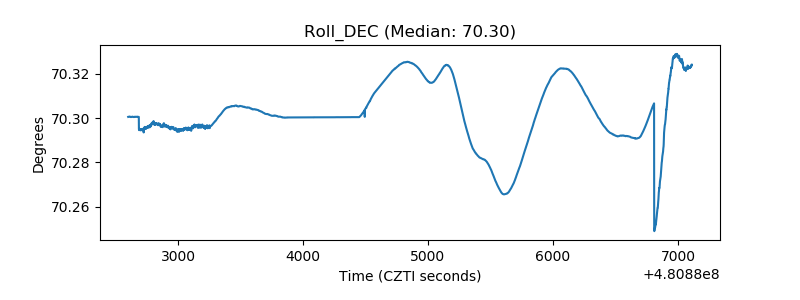 |
| _Roll_RA | 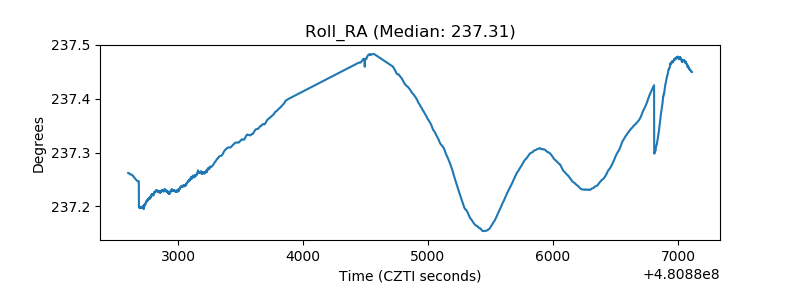 |
| Veto Counter | 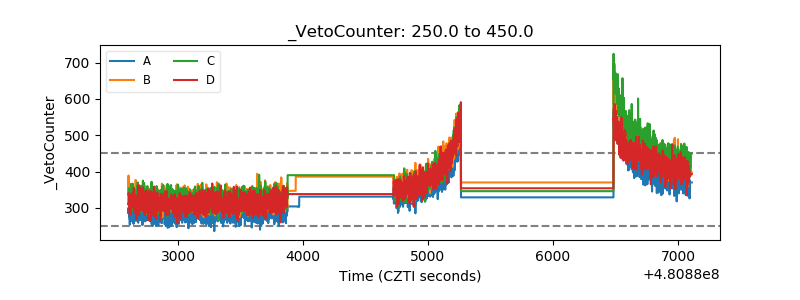 |