| Param | Original file | Final file |
|---|---|---|
| Filename | modeM0/AS1C07_001T03_9000006456_51380cztM0_level2.fits | modeM0/AS1C07_001T03_9000006456_51380cztM0_level2_quad_clean.evt |
| Size (bytes) | 257,299,200 | 30,775,680 |
| Size | 245.4 MB | 29.3 MB |
| Events in quadrant A | 2,482,582 | 199,150 |
| Events in quadrant B | 1,332,040 | 225,952 |
| Events in quadrant C | 3,776,098 | 143,442 |
| Events in quadrant D | 1,743,434 | 188,552 |
| Mode SS | |||
|---|---|---|---|
| Quadrant | BADHDUFLAG | Total packets | Discarded packets |
| A | 0 | 69 | 17 |
| B | 0 | 65 | 13 |
| C | 0 | 70 | 18 |
| D | 0 | 68 | 16 |
| Mode M0 | |||
|---|---|---|---|
| Quadrant | BADHDUFLAG | Total packets | Discarded packets |
| A | 0 | 11981 | 2859 |
| B | 0 | 7496 | 1866 |
| C | 0 | 16489 | 3631 |
| D | 0 | 8353 | 1437 |
| Mode M9 | |||
|---|---|---|---|
| Quadrant | BADHDUFLAG | Total packets | Discarded packets |
| A | 0 | 14 | 3 |
| B | 0 | 19 | 8 |
| C | 0 | 16 | 5 |
| D | 0 | 16 | 5 |
| Quadrant | Total seconds | Saturated seconds | Saturation percentage |
|---|---|---|---|
| A | 2426 | 193 | 7.955482% |
| B | 2437 | 79 | 3.241691% |
| C | 2408 | 972 | 40.365449% |
| D | 2439 | 119 | 4.879049% |
Noise dominated data is calculated using 1-second bins in cleaned event files. If a bin has >2000 counts, and if more than 50% of those come from <1% of pixels, then it is considered to be noise-dominated and hence unusable.
| Quadrant | # 1 sec bins | Bins with >0 counts | Bins with >2000 counts | High rate bins dominated by noise | Noise dominated (total time) | Noise dominated (detector-on time) | Marked lightcurve |
|---|---|---|---|---|---|---|---|
| A | 5546 | 2443 | 135 | 135 | 2.43% | 5.53% | 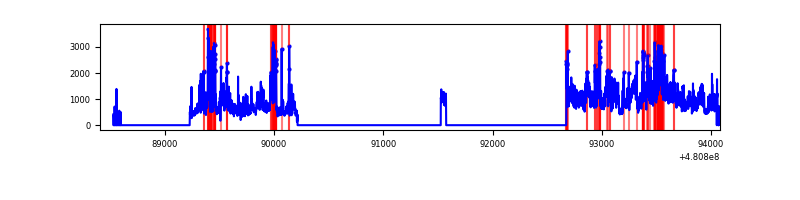 |
| B | 5651 | 2461 | 14 | 14 | 0.25% | 0.57% | 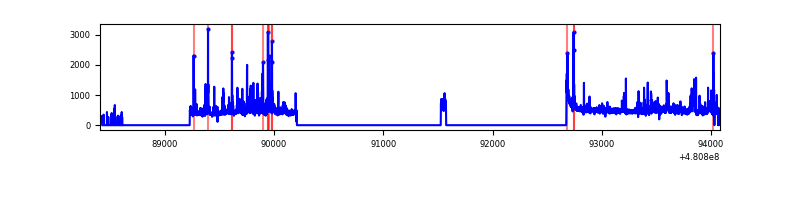 |
| C | 5549 | 2416 | 978 | 978 | 17.62% | 40.48% | 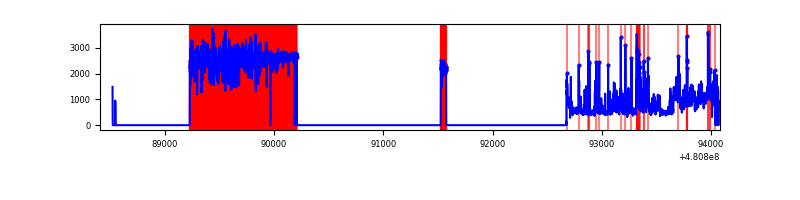 |
| D | 5675 | 2464 | 66 | 66 | 1.16% | 2.68% | 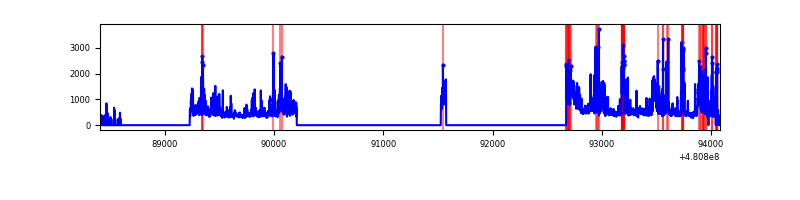 |
Top three noisy pixels from each quadrant. If the there are fewer than three noisy pixels in the level2.evt file, extra rows are filled as -1
| Pixel properties | Quadrant properties | ||||||
|---|---|---|---|---|---|---|---|
| Quadrant | DetID | PixID | Counts | Sigma | Mean | Median | Sigma |
| A | 12 | 3 | 734312 | 11845.66 | 245 | 239 | 62.0 |
| A | 15 | 174 | 464020 | 7483.99 | 245 | 239 | 62.0 |
| A | 4 | 3 | 93556 | 1505.85 | 245 | 239 | 62.0 |
| B | 4 | 81 | 110396 | 1972.39 | 255 | 247 | 55.8 |
| B | 0 | 216 | 33157 | 589.3 | 255 | 247 | 55.8 |
| B | 4 | 206 | 31867 | 566.21 | 255 | 247 | 55.8 |
| C | 15 | 179 | 2400399 | 39797.15 | 212 | 210 | 60.3 |
| C | 9 | 38 | 198057 | 3280.47 | 212 | 210 | 60.3 |
| C | 12 | 250 | 110713 | 1832.23 | 212 | 210 | 60.3 |
| D | 11 | 176 | 551791 | 7940.91 | 244 | 234 | 69.5 |
| D | 10 | 172 | 62074 | 890.33 | 244 | 234 | 69.5 |
| D | 15 | 94 | 38576 | 552.02 | 244 | 234 | 69.5 |
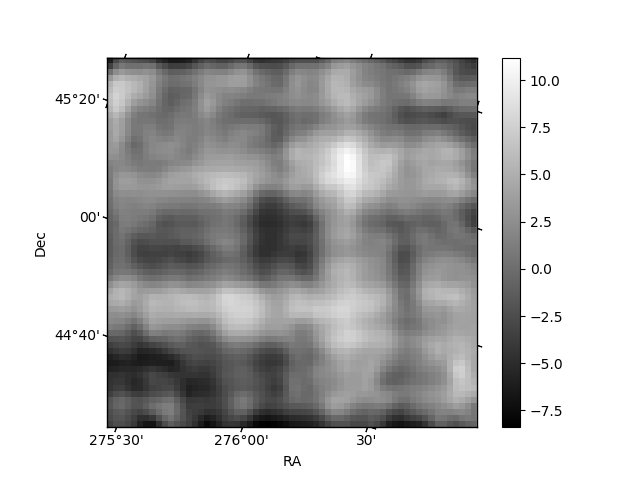
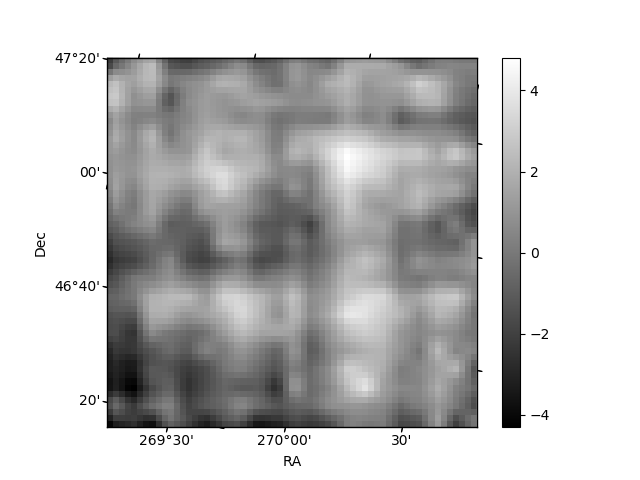
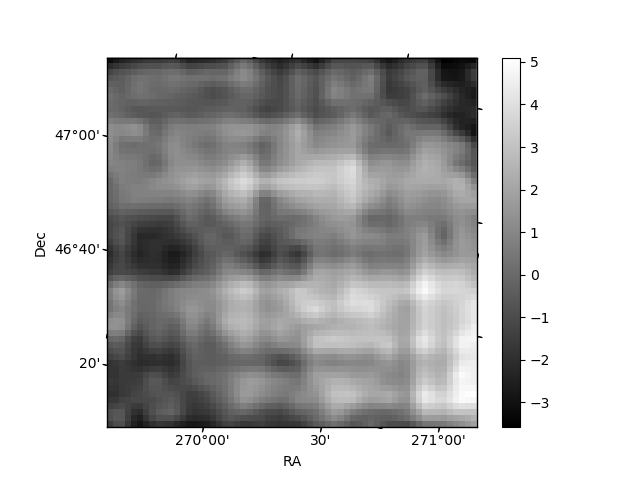
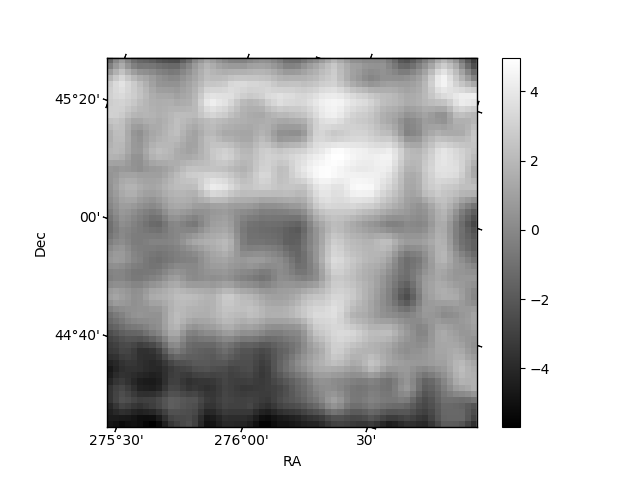
Histogram calculated using DETX and DETY for each event in the final _common_clean file
| Quadrant A | 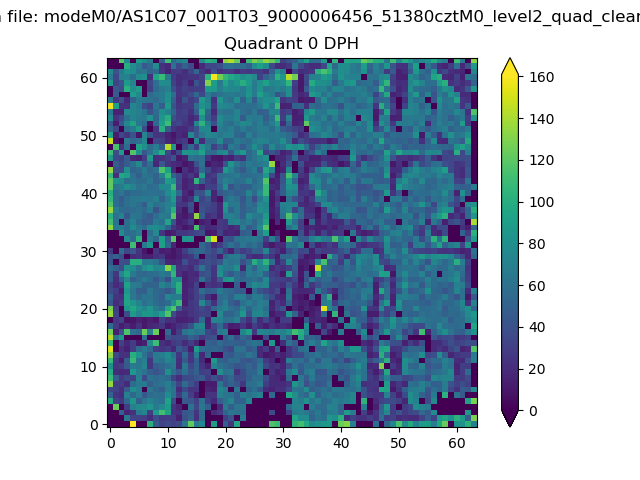 |
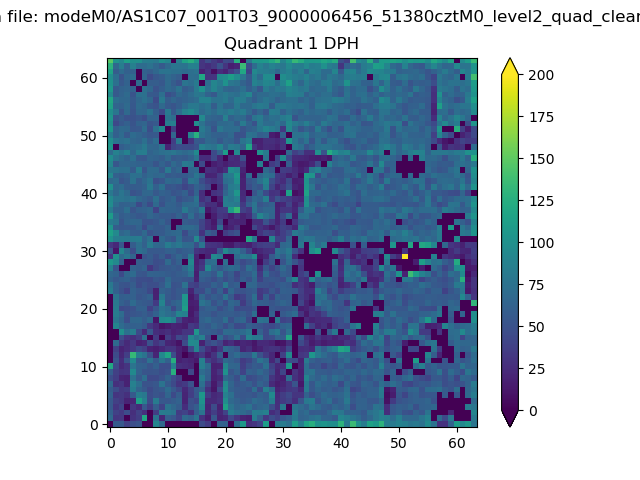 |
Quadrant B |
|---|---|---|---|
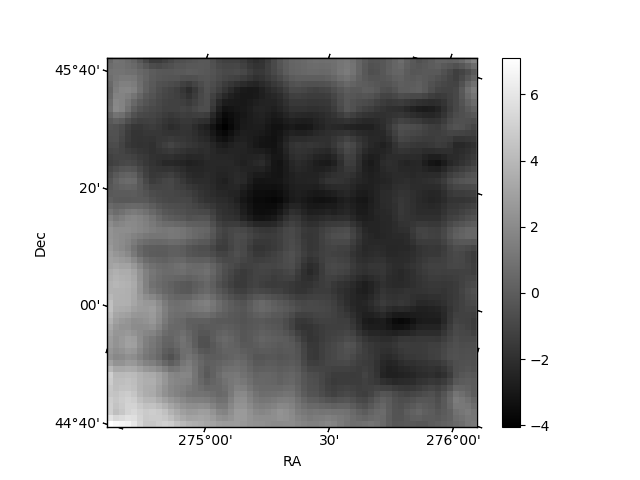
| Quadrant D | 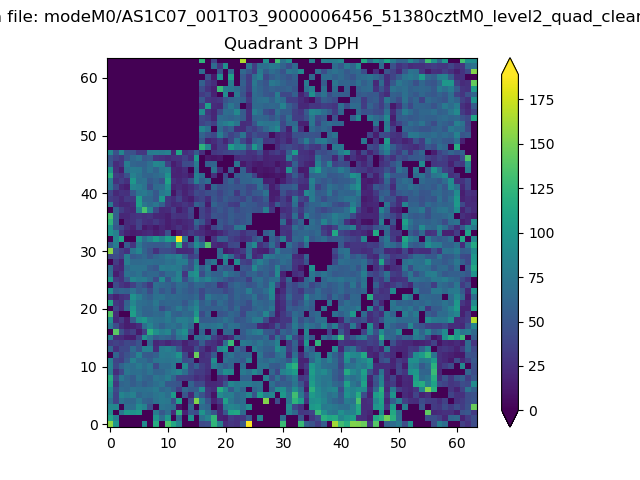 |
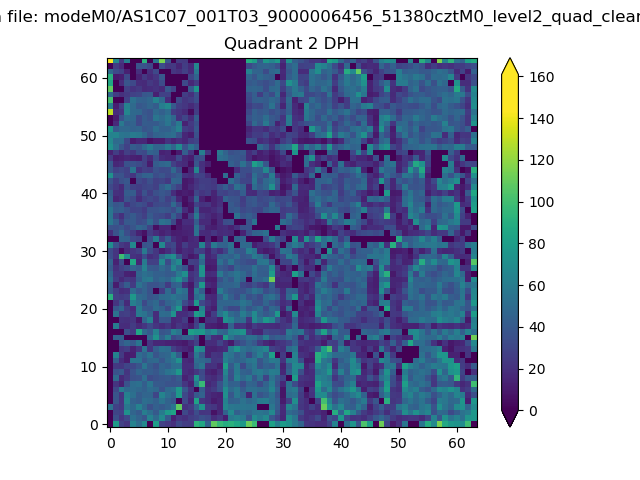 |
Quadrant C |
| Plot type | Count rate plots | Images |
|---|---|---|
| Comparison with Poisson distribution Blue bars denote a histogram of data divided into 1 sec bins. Red curve is a Poisson curve with rate = median count rate of data. |
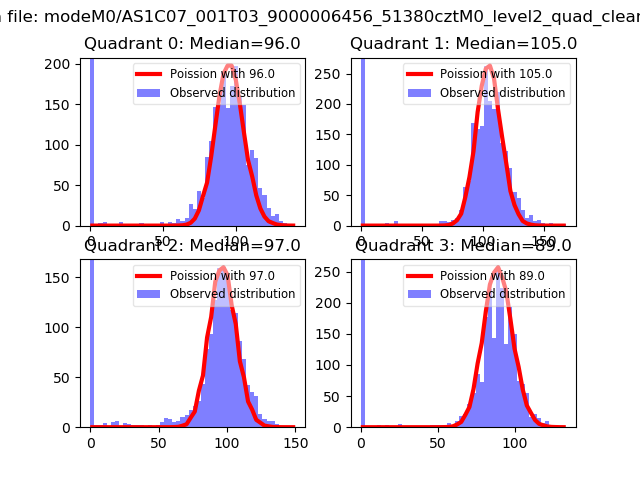 |
 |
| Quadrant-wise count rates Data is divided into 100 sec bins |
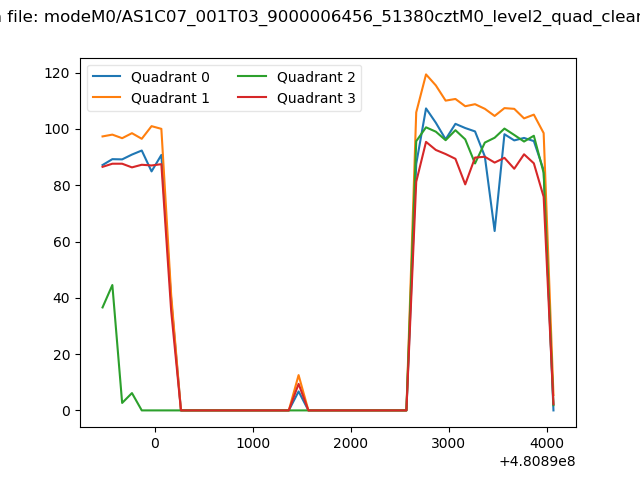 |
|
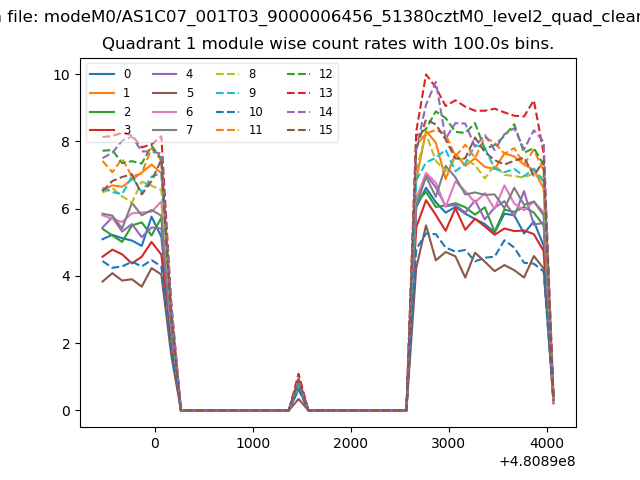
| Module-wise count rates for Quadrant A Data is divided into 100 sec bins |
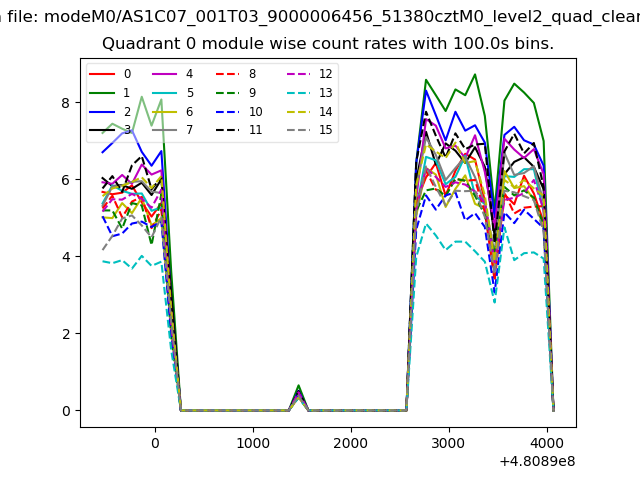 |
 |
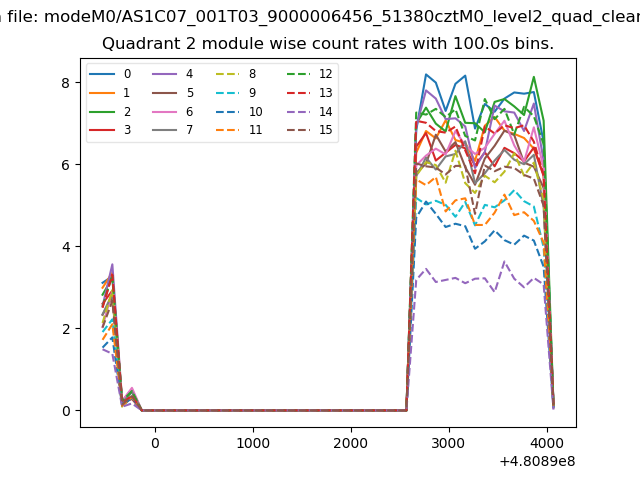
| Module-wise count rates for Quadrant B Data is divided into 100 sec bins |
 |
 |
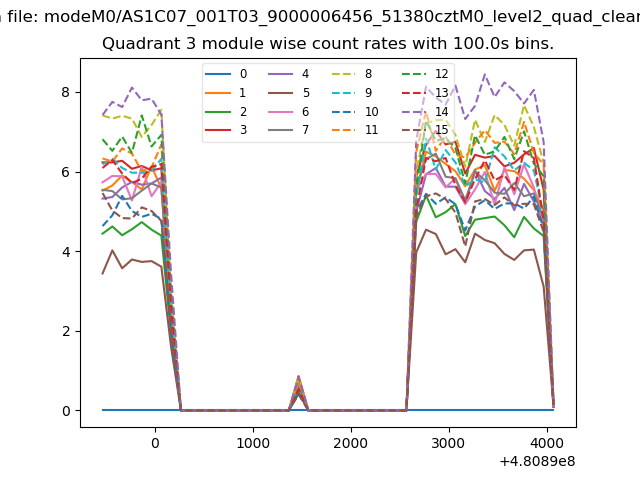
| Module-wise count rates for Quadrant C Data is divided into 100 sec bins |
 |
 |
| Module-wise count rates for Quadrant D Data is divided into 100 sec bins |
 |
 |
| Parameter | Plot |
|---|---|
| CZT HV Monitor | 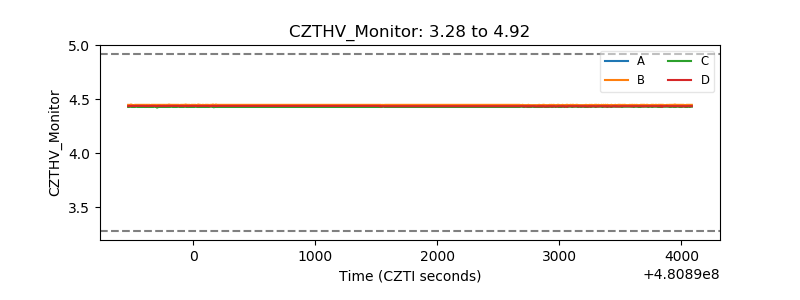 |
| D_VDD | 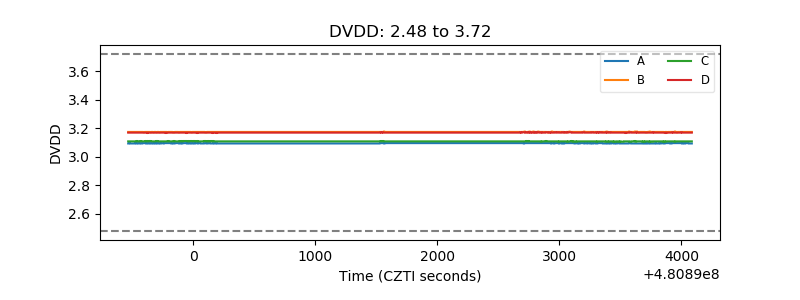 |
| Temperature 1 | 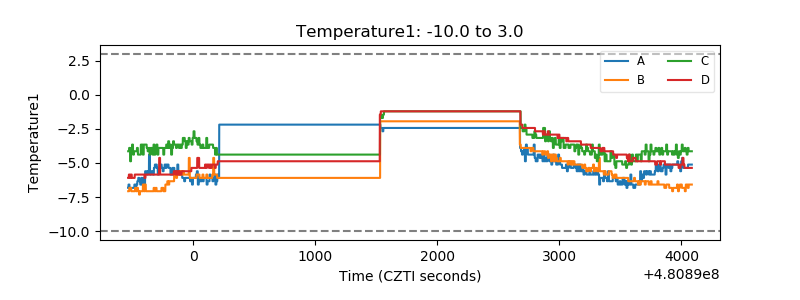 |
| Veto HV Monitor | 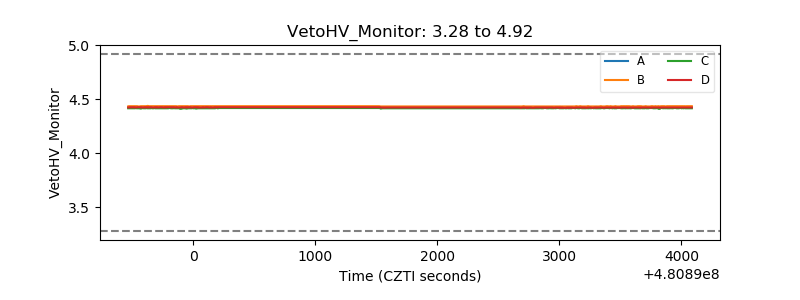 |
| Veto LLD | 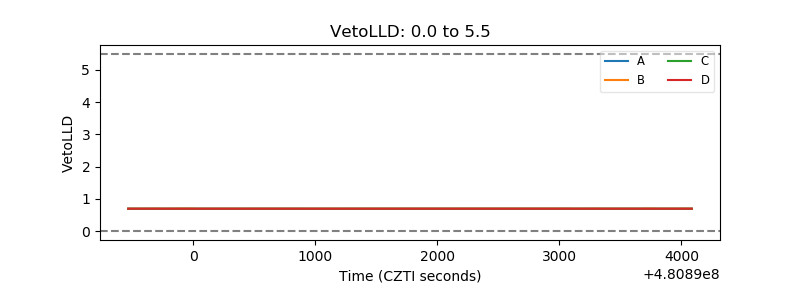 |
| Alpha Counter | 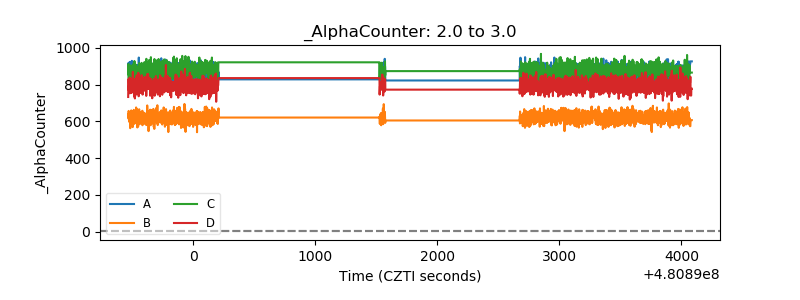 |
| _CPM_Rate | 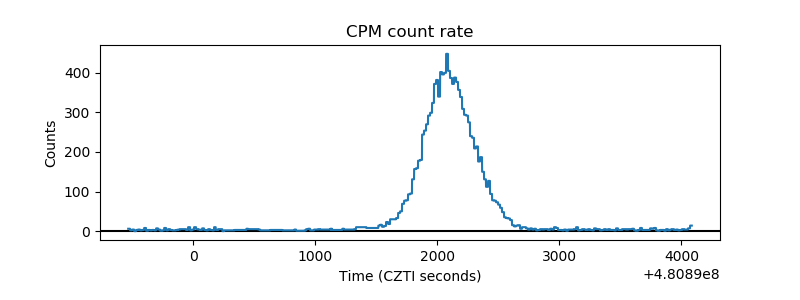 |
| CZT Counter | 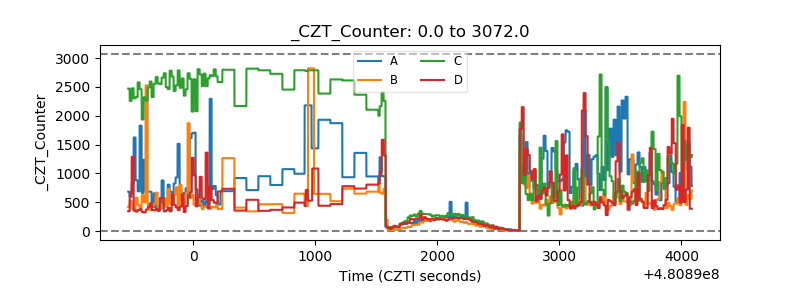 |
| +2.5 Volts monitor | 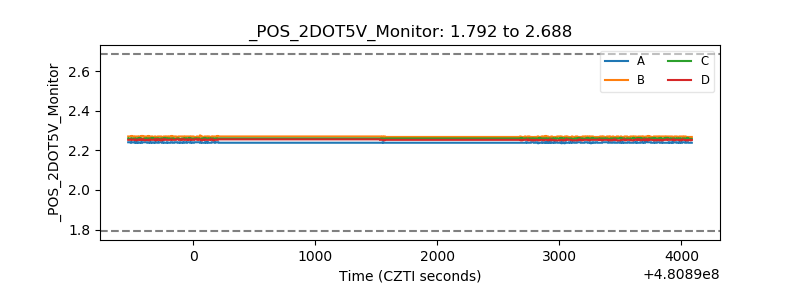 |
| +5 Volts monitor | 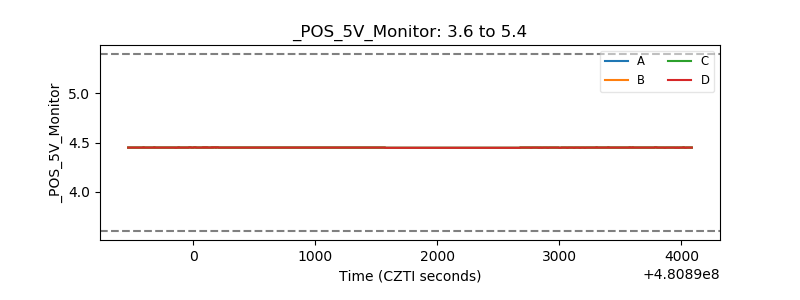 |
| _ROLL_ROT | 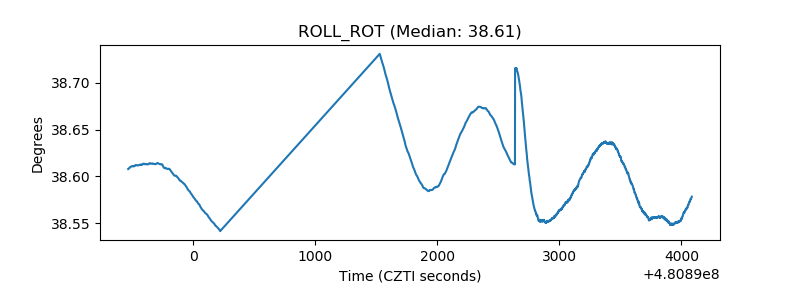 |
| _Roll_DEC | 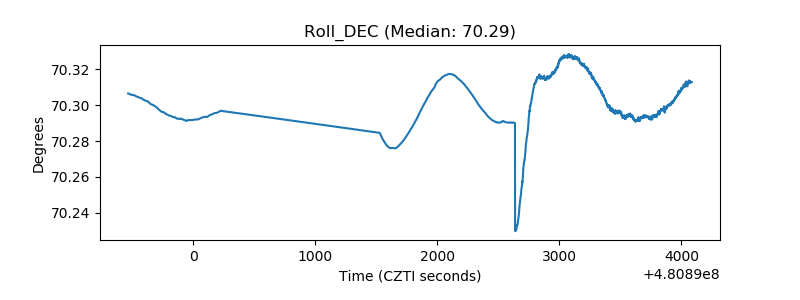 |
| _Roll_RA | 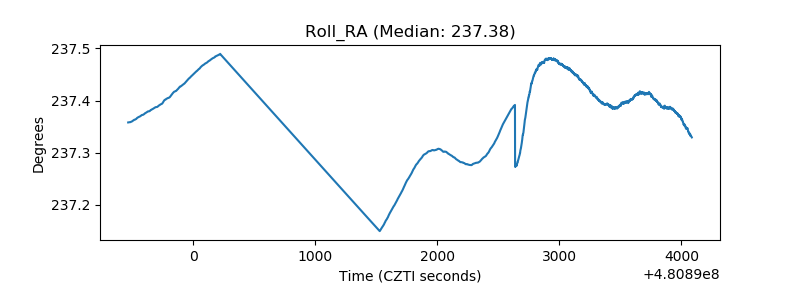 |
| Veto Counter | 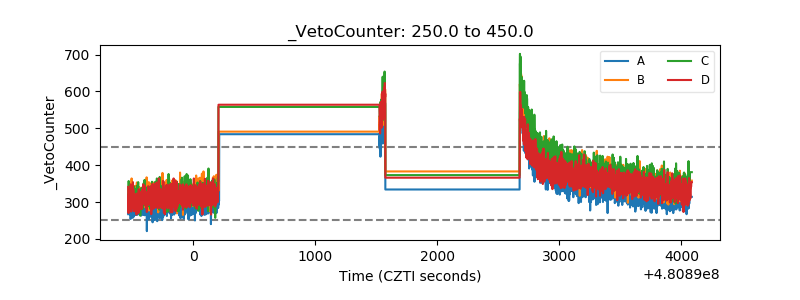 |