| Param | Original file | Final file |
|---|---|---|
| Filename | modeM0/AS1C07_001T03_9000006456_51381cztM0_level2.fits | modeM0/AS1C07_001T03_9000006456_51381cztM0_level2_quad_clean.evt |
| Size (bytes) | 298,814,400 | 24,416,640 |
| Size | 285.0 MB | 23.3 MB |
| Events in quadrant A | 2,974,269 | 132,374 |
| Events in quadrant B | 1,879,260 | 166,886 |
| Events in quadrant C | 4,049,942 | 117,745 |
| Events in quadrant D | 1,958,410 | 139,497 |
| Mode SS | |||
|---|---|---|---|
| Quadrant | BADHDUFLAG | Total packets | Discarded packets |
| A | 0 | 59 | 5 |
| B | 0 | 59 | 5 |
| C | 0 | 63 | 9 |
| D | 0 | 58 | 6 |
| Mode M0 | |||
|---|---|---|---|
| Quadrant | BADHDUFLAG | Total packets | Discarded packets |
| A | 0 | 11488 | 830 |
| B | 0 | 7777 | 463 |
| C | 0 | 14887 | 1170 |
| D | 0 | 8142 | 528 |
| Mode M9 | |||
|---|---|---|---|
| Quadrant | BADHDUFLAG | Total packets | Discarded packets |
| A | 0 | 14 | 5 |
| B | 0 | 10 | 1 |
| C | 0 | 17 | 8 |
| D | 0 | 10 | 1 |
| Quadrant | Total seconds | Saturated seconds | Saturation percentage |
|---|---|---|---|
| A | 2548 | 328 | 12.872841% |
| B | 2554 | 105 | 4.111198% |
| C | 2542 | 1100 | 43.273013% |
| D | 2547 | 83 | 3.258736% |
Noise dominated data is calculated using 1-second bins in cleaned event files. If a bin has >2000 counts, and if more than 50% of those come from <1% of pixels, then it is considered to be noise-dominated and hence unusable.
| Quadrant | # 1 sec bins | Bins with >0 counts | Bins with >2000 counts | High rate bins dominated by noise | Noise dominated (total time) | Noise dominated (detector-on time) | Marked lightcurve |
|---|---|---|---|---|---|---|---|
| A | 4521 | 2561 | 246 | 246 | 5.44% | 9.61% | 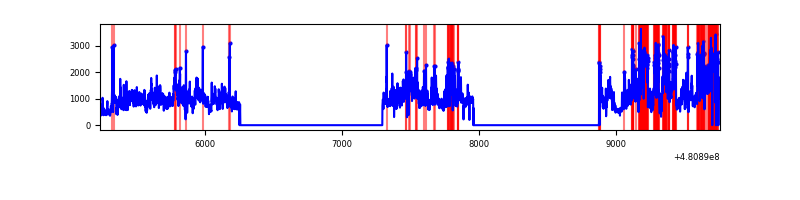 |
| B | 4524 | 2572 | 49 | 49 | 1.08% | 1.91% | 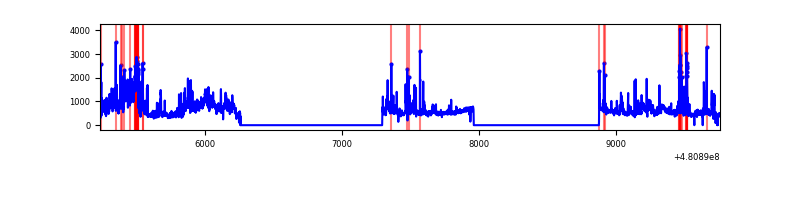 |
| C | 4525 | 2552 | 986 | 986 | 21.79% | 38.64% | 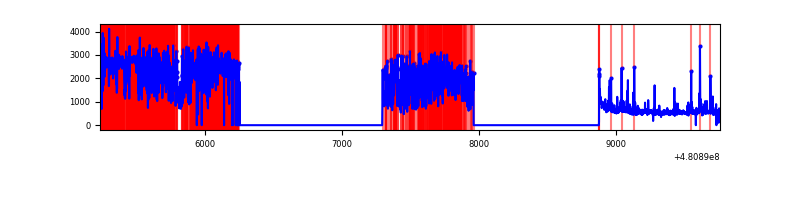 |
| D | 4526 | 2564 | 91 | 91 | 2.01% | 3.55% | 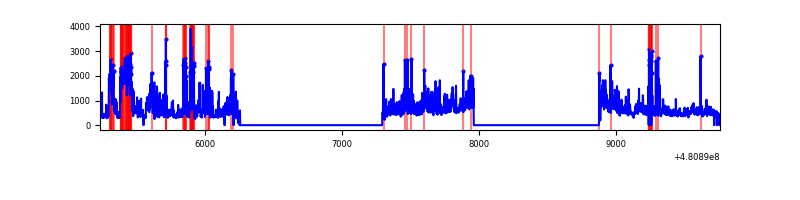 |
Top three noisy pixels from each quadrant. If the there are fewer than three noisy pixels in the level2.evt file, extra rows are filled as -1
| Pixel properties | Quadrant properties | ||||||
|---|---|---|---|---|---|---|---|
| Quadrant | DetID | PixID | Counts | Sigma | Mean | Median | Sigma |
| A | 12 | 3 | 975284 | 14974.43 | 262 | 255 | 65.1 |
| A | 15 | 174 | 492256 | 7556.12 | 262 | 255 | 65.1 |
| A | 12 | 250 | 115930 | 1776.53 | 262 | 255 | 65.1 |
| B | 10 | 254 | 282799 | 4696.98 | 276 | 267 | 60.2 |
| B | 5 | 185 | 82396 | 1365.36 | 276 | 267 | 60.2 |
| B | 4 | 206 | 81133 | 1344.36 | 276 | 267 | 60.2 |
| C | 15 | 179 | 1963540 | 30462.0 | 227 | 224 | 64.5 |
| C | 4 | 12 | 486499 | 7544.84 | 227 | 224 | 64.5 |
| C | 10 | 171 | 312824 | 4850.17 | 227 | 224 | 64.5 |
| D | 11 | 176 | 588889 | 7789.5 | 267 | 256 | 75.6 |
| D | 2 | 216 | 102205 | 1349.11 | 267 | 256 | 75.6 |
| D | 3 | 12 | 71301 | 940.15 | 267 | 256 | 75.6 |
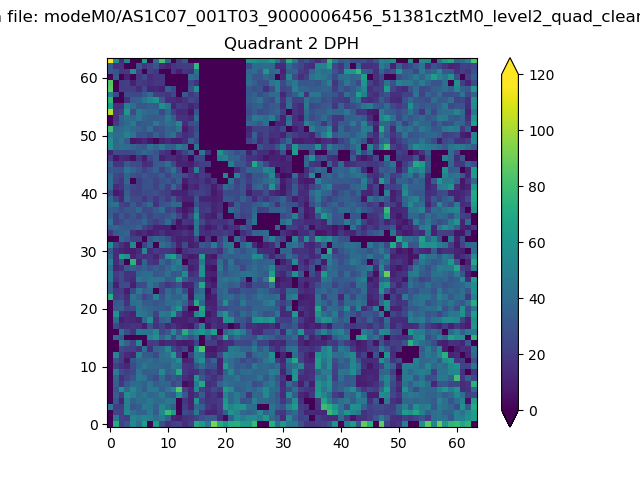
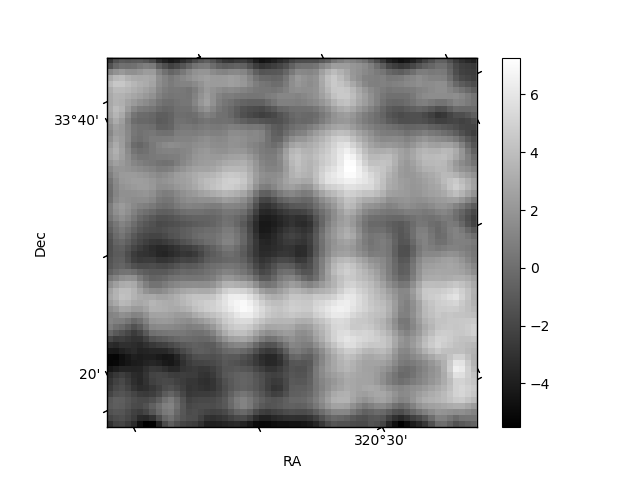
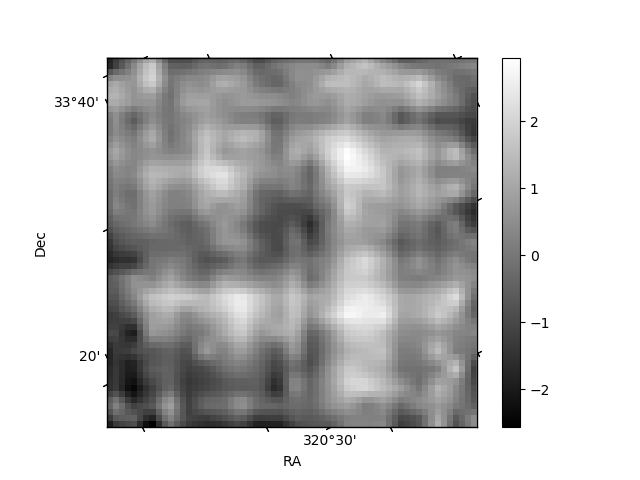
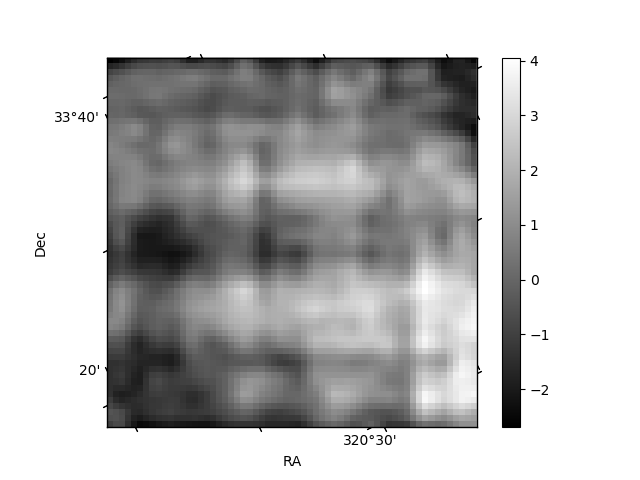
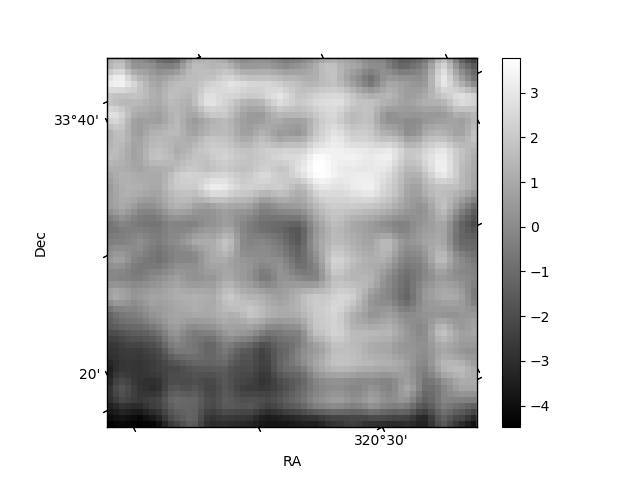
Histogram calculated using DETX and DETY for each event in the final _common_clean file
| Quadrant A | 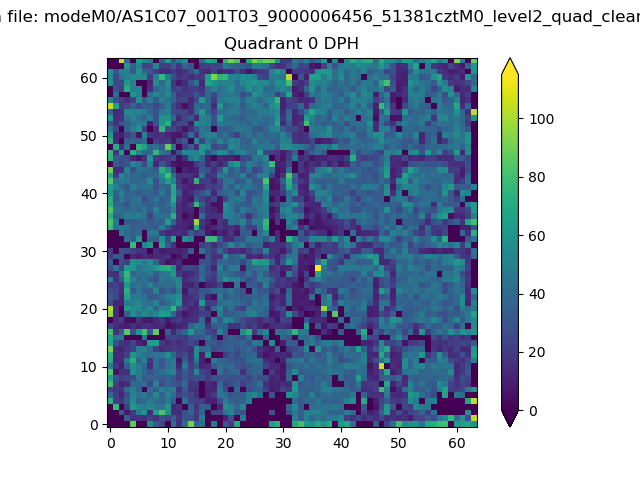 |
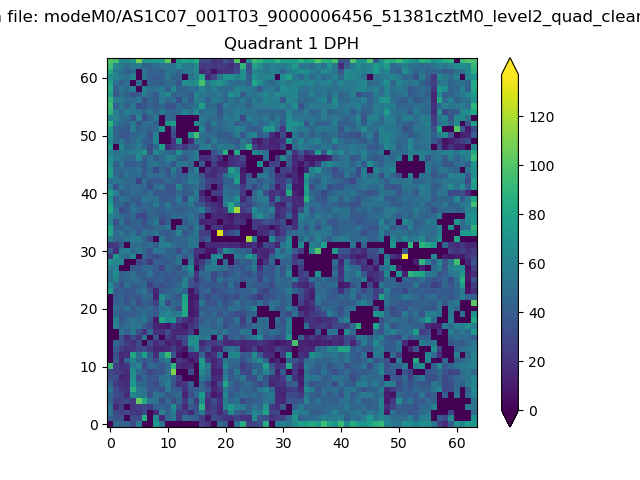 |
Quadrant B |
|---|---|---|---|
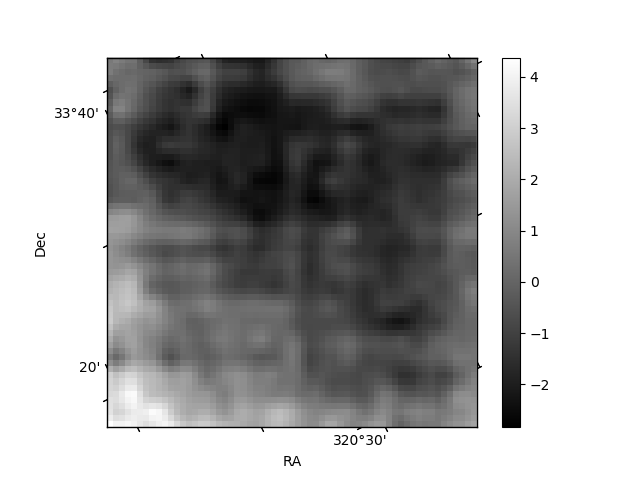
| Quadrant D | 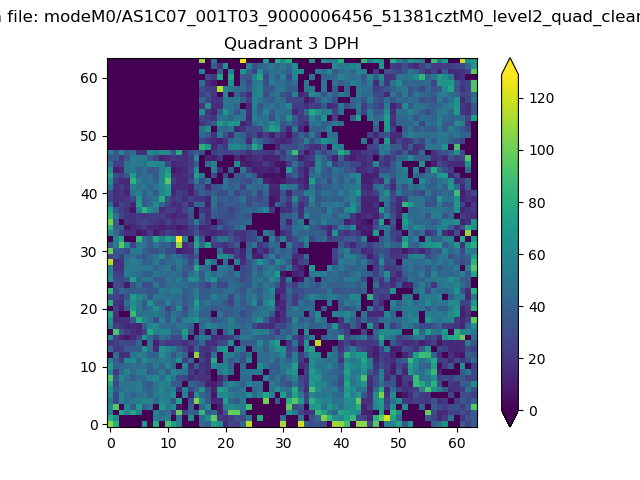 |
 |
Quadrant C |
| Plot type | Count rate plots | Images |
|---|---|---|
| Comparison with Poisson distribution Blue bars denote a histogram of data divided into 1 sec bins. Red curve is a Poisson curve with rate = median count rate of data. |
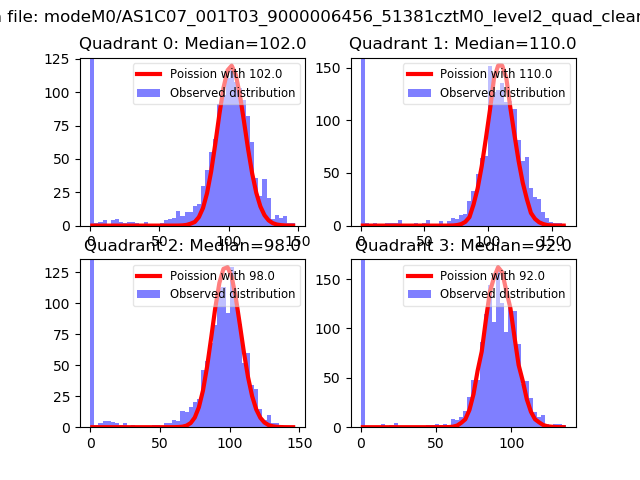 |
 |
| Quadrant-wise count rates Data is divided into 100 sec bins |
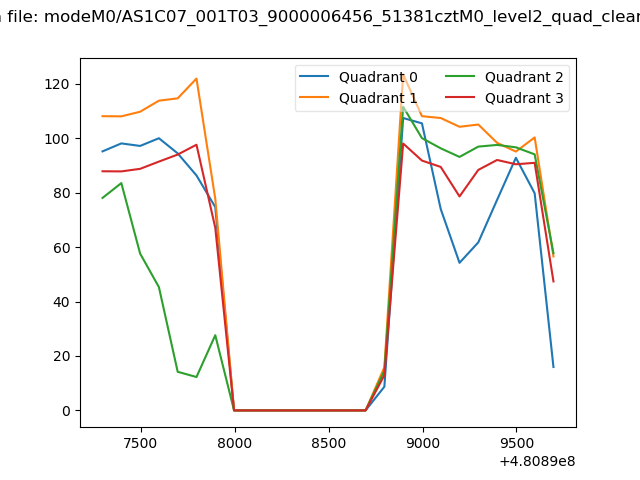 |
|
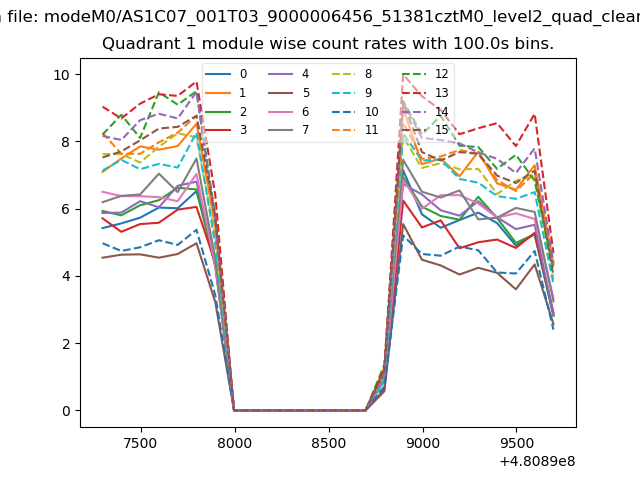
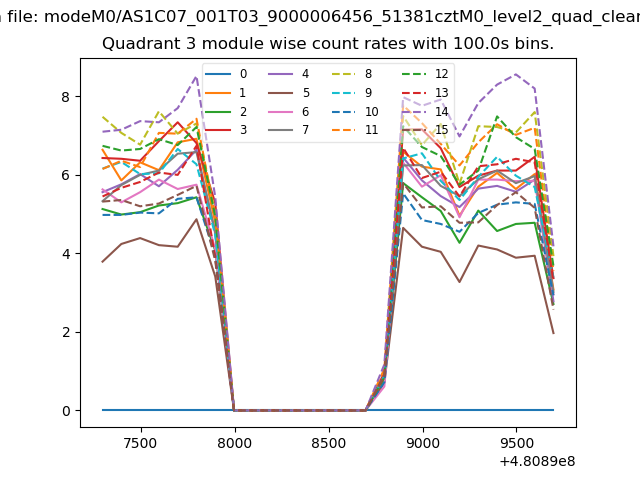
| Module-wise count rates for Quadrant A Data is divided into 100 sec bins |
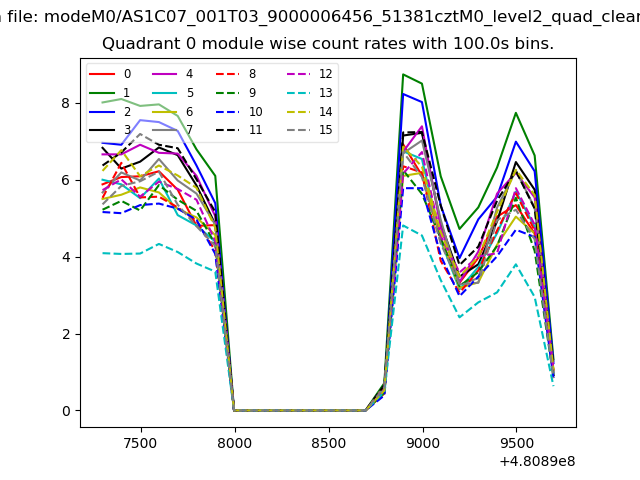 |
 |
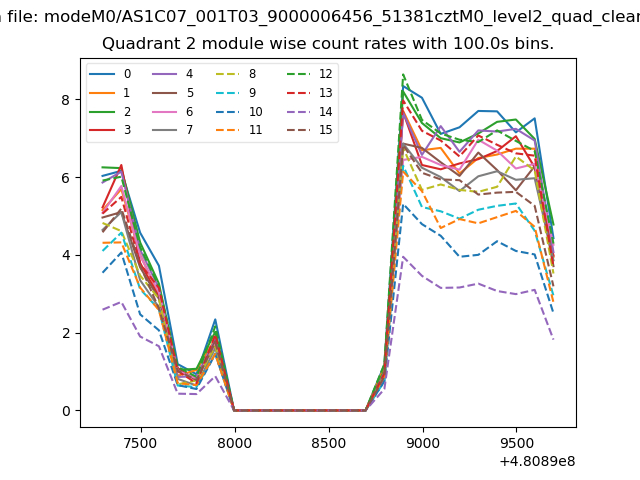
| Module-wise count rates for Quadrant B Data is divided into 100 sec bins |
 |
 |
| Module-wise count rates for Quadrant C Data is divided into 100 sec bins |
 |
 |
| Module-wise count rates for Quadrant D Data is divided into 100 sec bins |
 |
 |
| Parameter | Plot |
|---|---|
| CZT HV Monitor | 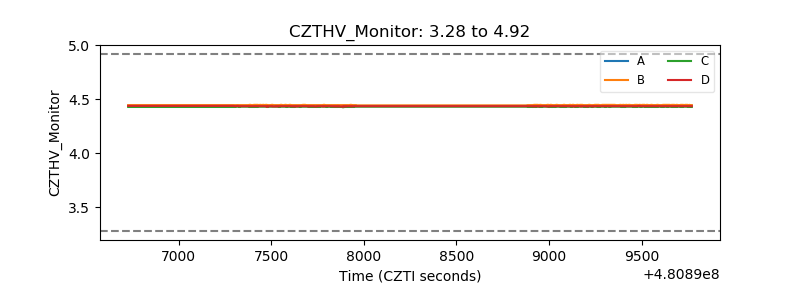 |
| D_VDD | 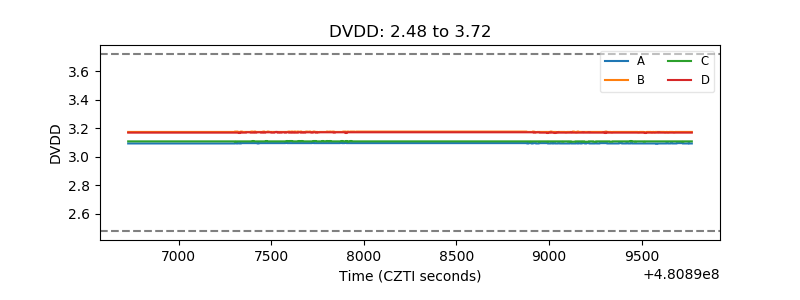 |
| Temperature 1 | 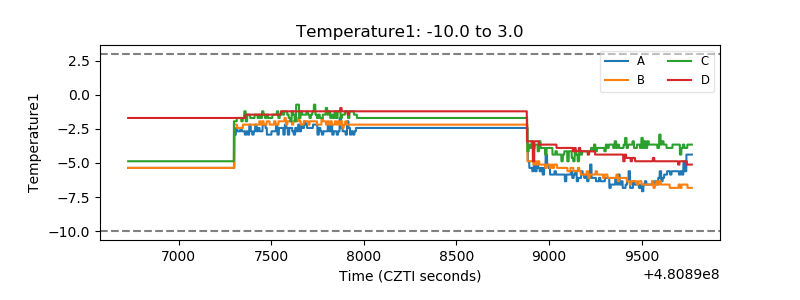 |
| Veto HV Monitor | 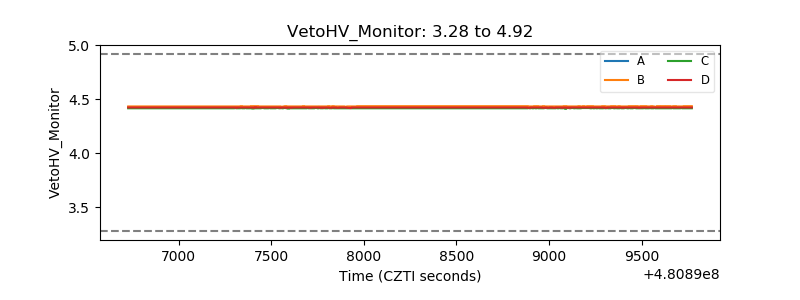 |
| Veto LLD | 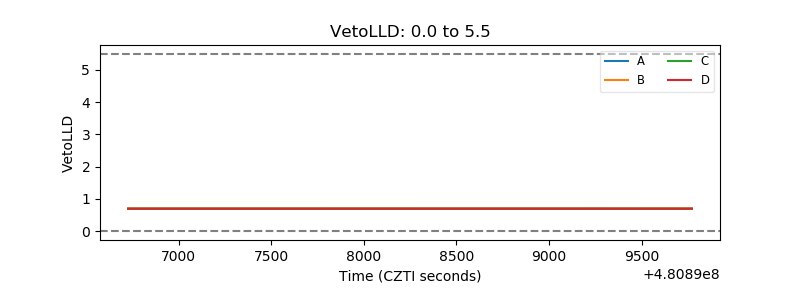 |
| Alpha Counter | 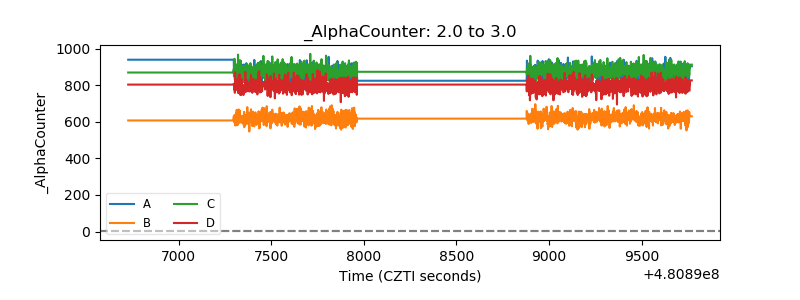 |
| _CPM_Rate | 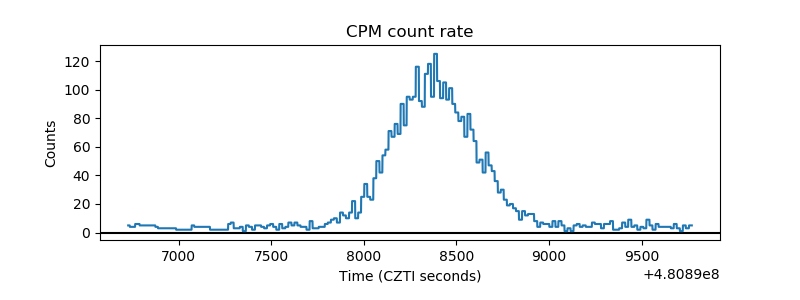 |
| CZT Counter | 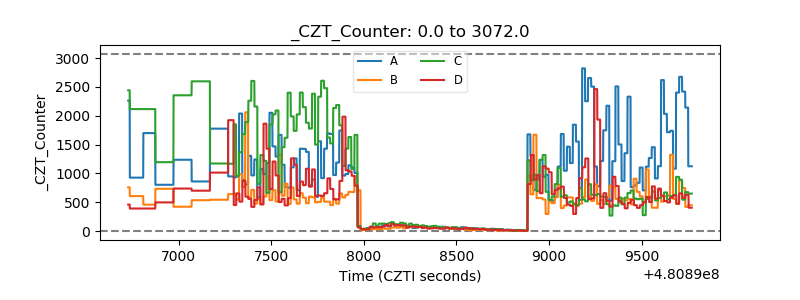 |
| +2.5 Volts monitor | 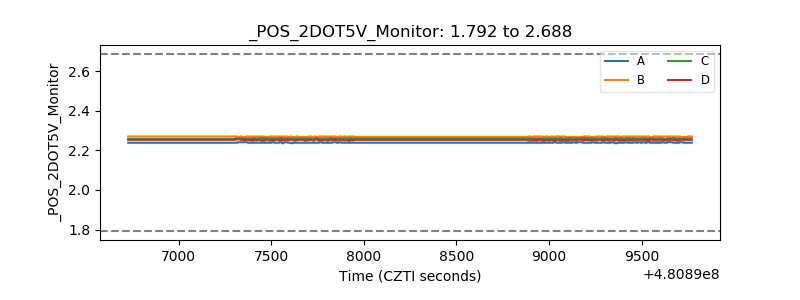 |
| +5 Volts monitor | 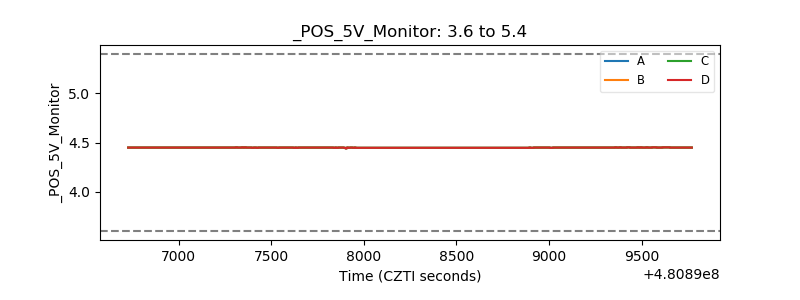 |
| _ROLL_ROT | 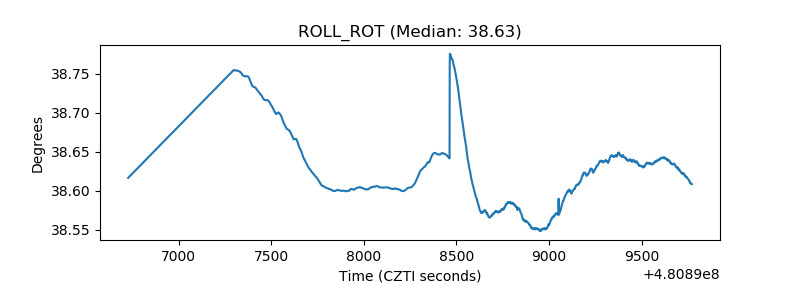 |
| _Roll_DEC | 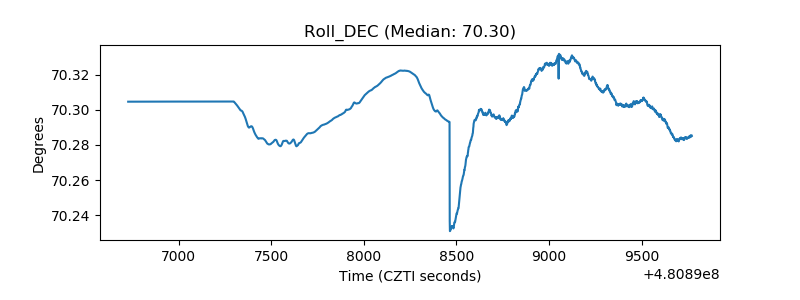 |
| _Roll_RA | 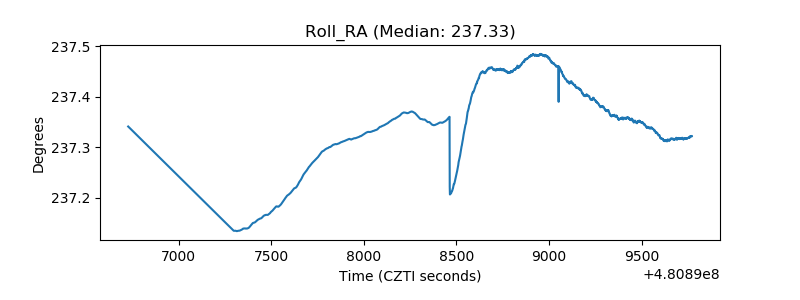 |
| Veto Counter | 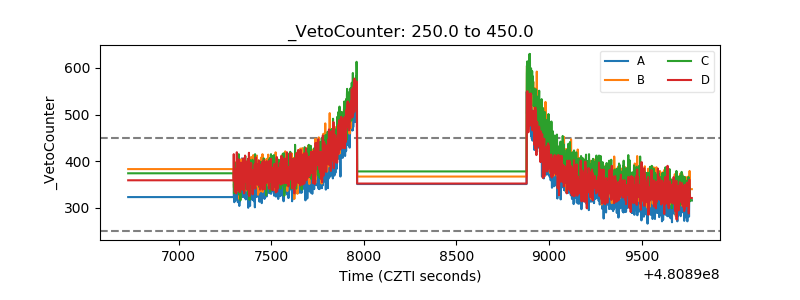 |