| Param | Original file | Final file |
|---|---|---|
| Filename | modeM0/AS1C07_001T03_9000006456_51382cztM0_level2.fits | modeM0/AS1C07_001T03_9000006456_51382cztM0_level2_quad_clean.evt |
| Size (bytes) | 618,724,800 | 71,821,440 |
| Size | 590.1 MB | 68.5 MB |
| Events in quadrant A | 8,118,101 | 378,434 |
| Events in quadrant B | 3,199,108 | 568,602 |
| Events in quadrant C | 7,373,619 | 357,195 |
| Events in quadrant D | 3,777,714 | 478,416 |
| Mode SS | |||
|---|---|---|---|
| Quadrant | BADHDUFLAG | Total packets | Discarded packets |
| A | 0 | 133 | 13 |
| B | 0 | 132 | 16 |
| C | 0 | 134 | 18 |
| D | 0 | 131 | 15 |
| Mode M0 | |||
|---|---|---|---|
| Quadrant | BADHDUFLAG | Total packets | Discarded packets |
| A | 0 | 30563 | 2462 |
| B | 0 | 15027 | 1575 |
| C | 0 | 29863 | 4162 |
| D | 0 | 17354 | 2118 |
| Mode M9 | |||
|---|---|---|---|
| Quadrant | BADHDUFLAG | Total packets | Discarded packets |
| A | 0 | 16 | 2 |
| B | 0 | 17 | 3 |
| C | 0 | 19 | 5 |
| D | 0 | 15 | 1 |
| Quadrant | Total seconds | Saturated seconds | Saturation percentage |
|---|---|---|---|
| A | 5597 | 1695 | 30.284081% |
| B | 5618 | 162 | 2.883588% |
| C | 5568 | 1983 | 35.614224% |
| D | 5610 | 162 | 2.887701% |
Noise dominated data is calculated using 1-second bins in cleaned event files. If a bin has >2000 counts, and if more than 50% of those come from <1% of pixels, then it is considered to be noise-dominated and hence unusable.
| Quadrant | # 1 sec bins | Bins with >0 counts | Bins with >2000 counts | High rate bins dominated by noise | Noise dominated (total time) | Noise dominated (detector-on time) | Marked lightcurve |
|---|---|---|---|---|---|---|---|
| A | 8713 | 5639 | 1461 | 1461 | 16.77% | 25.91% | 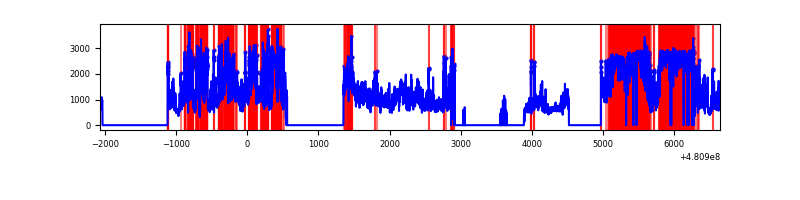 |
| B | 8713 | 5665 | 61 | 61 | 0.70% | 1.08% | 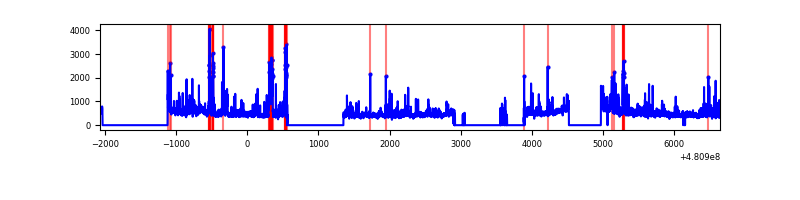 |
| C | 8712 | 5585 | 1799 | 1799 | 20.65% | 32.21% | 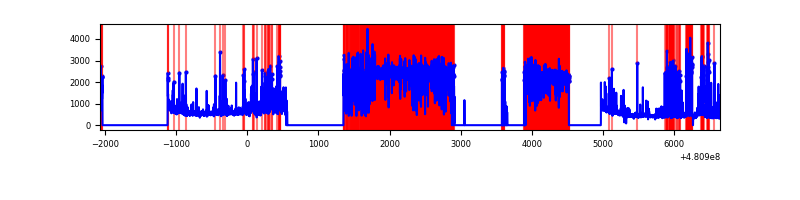 |
| D | 8713 | 5654 | 110 | 110 | 1.26% | 1.95% | 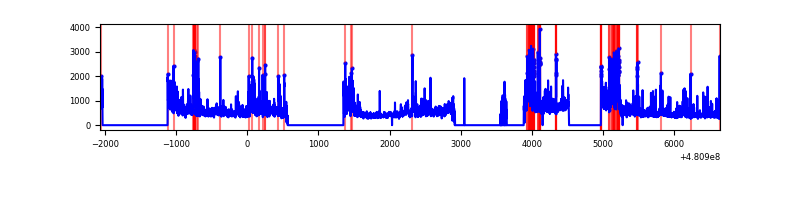 |
Top three noisy pixels from each quadrant. If the there are fewer than three noisy pixels in the level2.evt file, extra rows are filled as -1
| Pixel properties | Quadrant properties | ||||||
|---|---|---|---|---|---|---|---|
| Quadrant | DetID | PixID | Counts | Sigma | Mean | Median | Sigma |
| A | 15 | 174 | 3106795 | 25102.85 | 496 | 484 | 123.7 |
| A | 12 | 3 | 1895015 | 15310.16 | 496 | 484 | 123.7 |
| A | 4 | 175 | 383967 | 3099.02 | 496 | 484 | 123.7 |
| B | 5 | 185 | 224533 | 1754.92 | 597 | 575 | 127.6 |
| B | 4 | 81 | 193663 | 1513.02 | 597 | 575 | 127.6 |
| B | 6 | 51 | 78856 | 613.4 | 597 | 575 | 127.6 |
| C | 15 | 179 | 4297212 | 31431.81 | 487 | 482 | 136.7 |
| C | 7 | 64 | 462532 | 3380.03 | 487 | 482 | 136.7 |
| C | 10 | 171 | 234672 | 1713.17 | 487 | 482 | 136.7 |
| D | 11 | 176 | 929777 | 5744.34 | 575 | 554 | 161.8 |
| D | 2 | 153 | 141887 | 873.7 | 575 | 554 | 161.8 |
| D | 3 | 12 | 112101 | 689.57 | 575 | 554 | 161.8 |
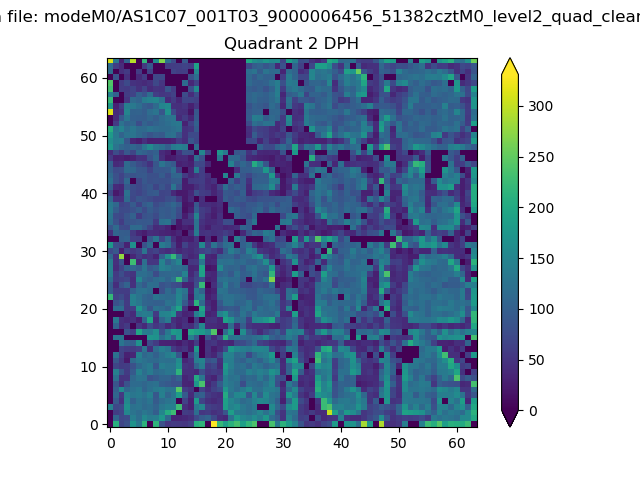
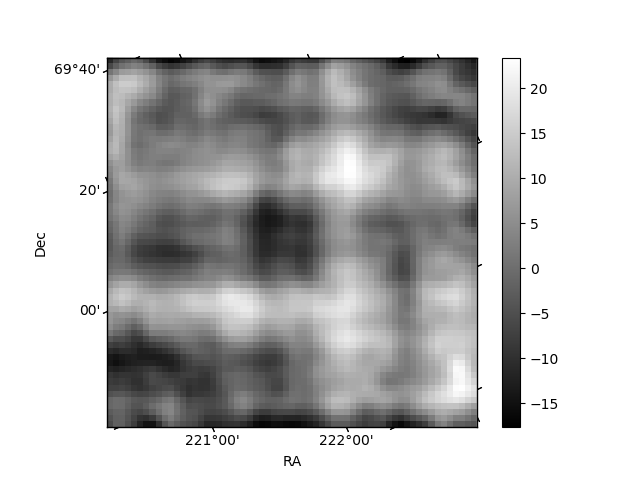
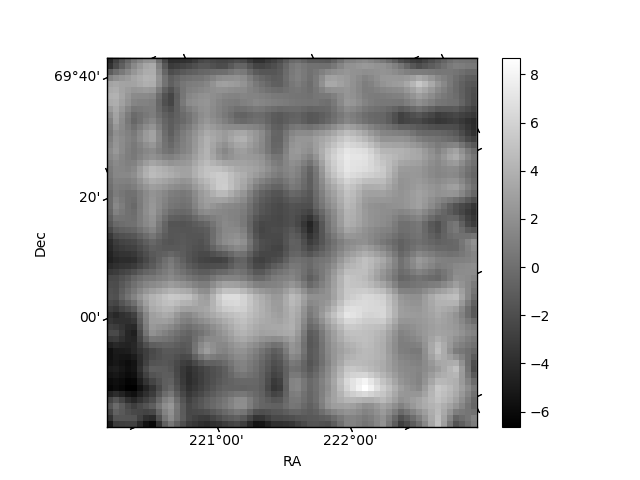
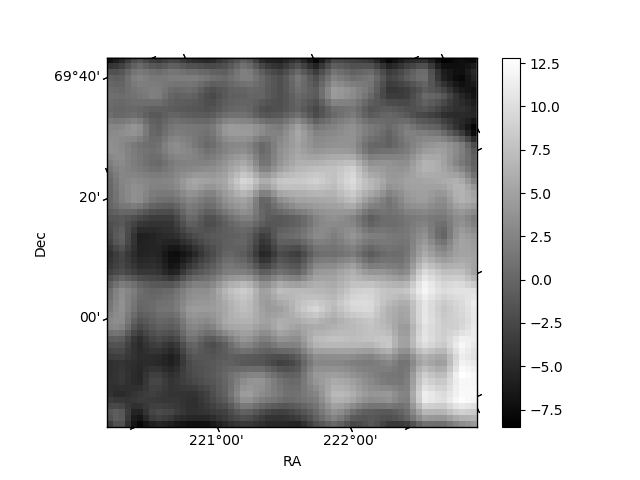
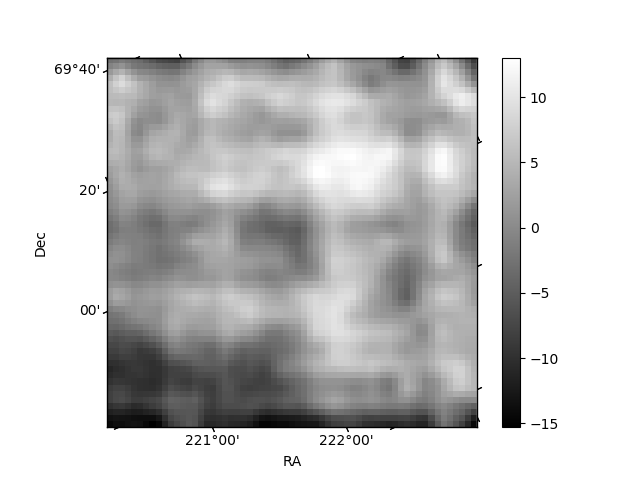
Histogram calculated using DETX and DETY for each event in the final _common_clean file
| Quadrant A | 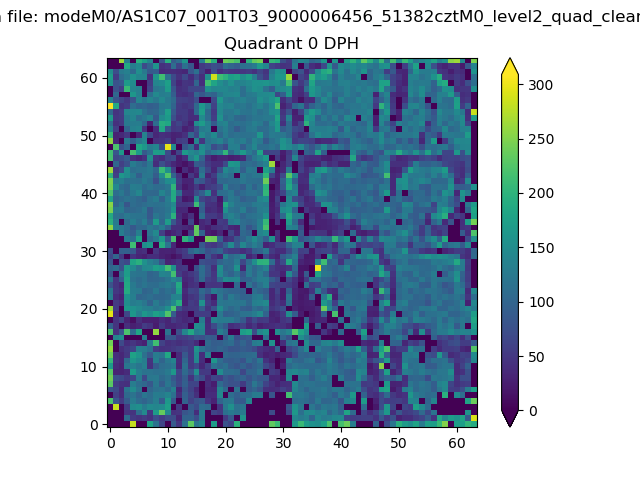 |
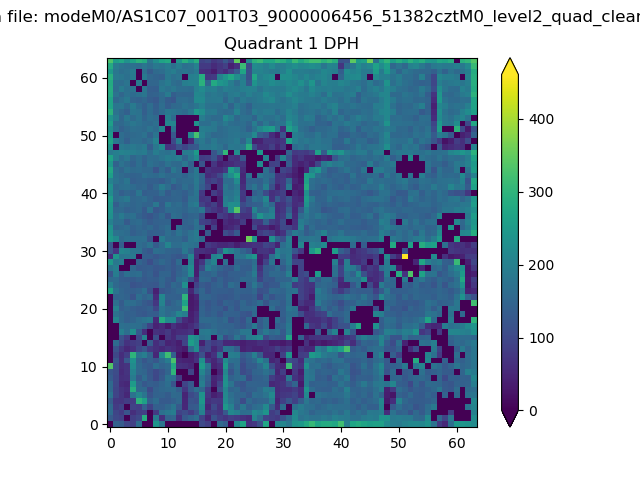 |
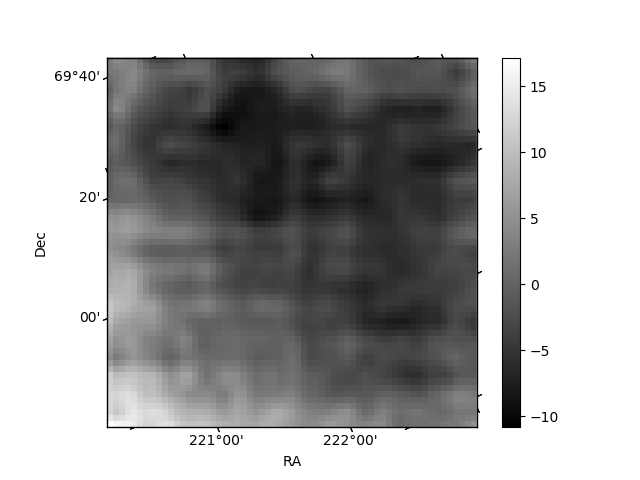
Quadrant B |
|---|---|---|---|
| Quadrant D | 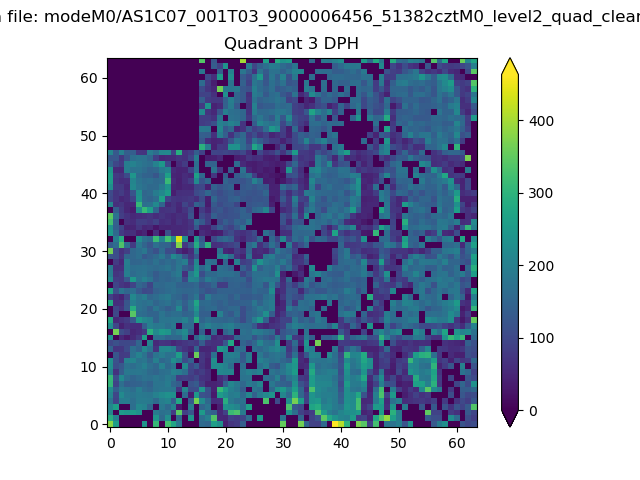 |
 |
Quadrant C |
| Plot type | Count rate plots | Images |
|---|---|---|
| Comparison with Poisson distribution Blue bars denote a histogram of data divided into 1 sec bins. Red curve is a Poisson curve with rate = median count rate of data. |
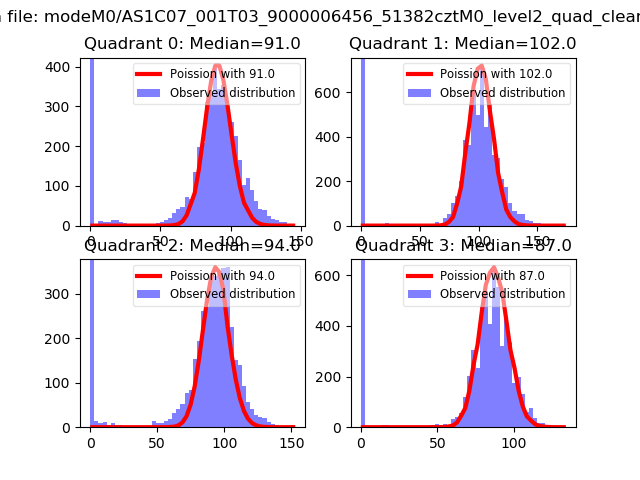 |
 |
| Quadrant-wise count rates Data is divided into 100 sec bins |
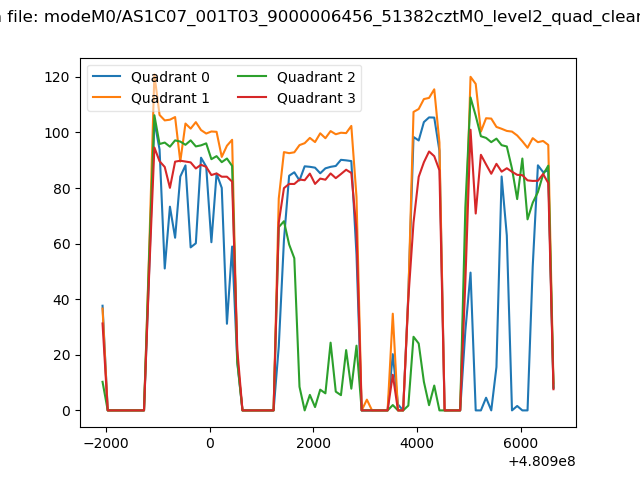 |
|
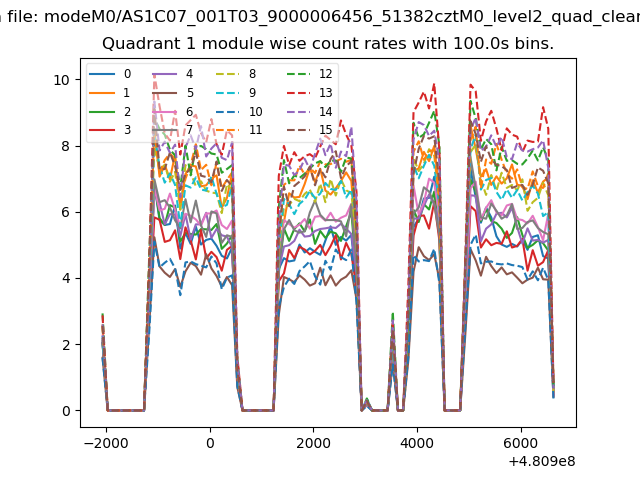
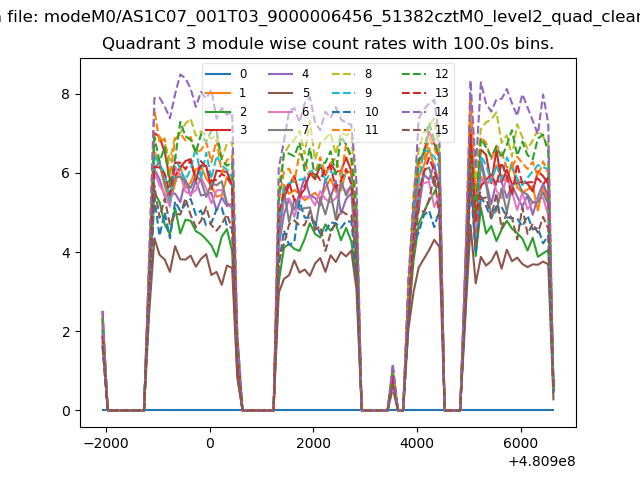
| Module-wise count rates for Quadrant A Data is divided into 100 sec bins |
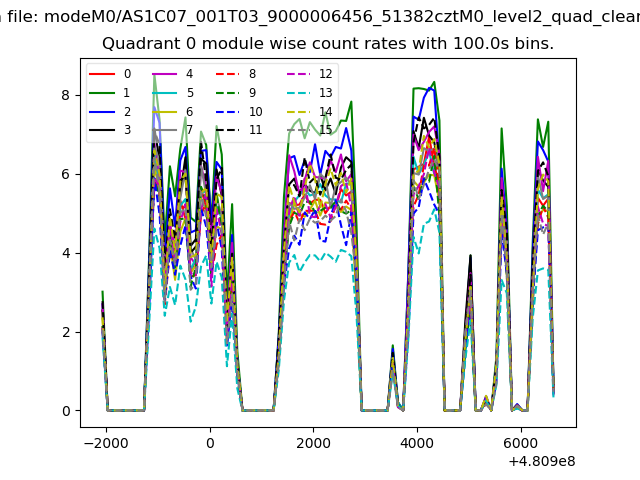 |
 |
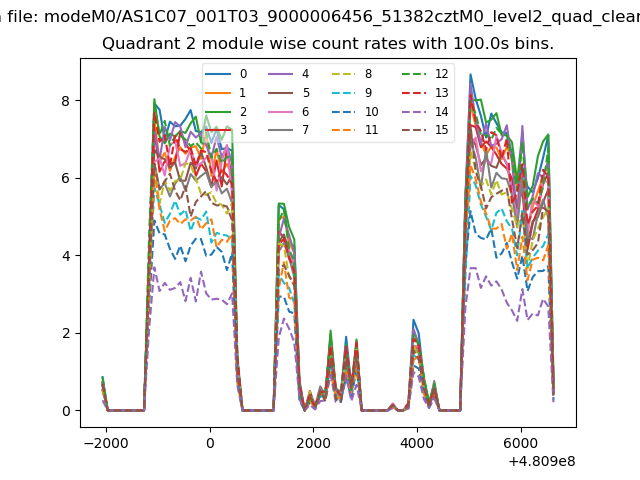
| Module-wise count rates for Quadrant B Data is divided into 100 sec bins |
 |
 |
| Module-wise count rates for Quadrant C Data is divided into 100 sec bins |
 |
 |
| Module-wise count rates for Quadrant D Data is divided into 100 sec bins |
 |
 |
| Parameter | Plot |
|---|---|
| CZT HV Monitor | 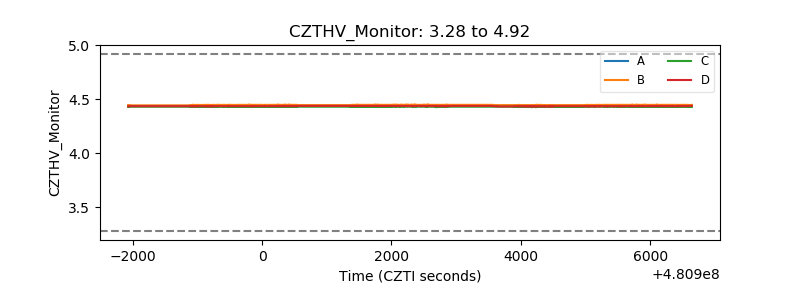 |
| D_VDD | 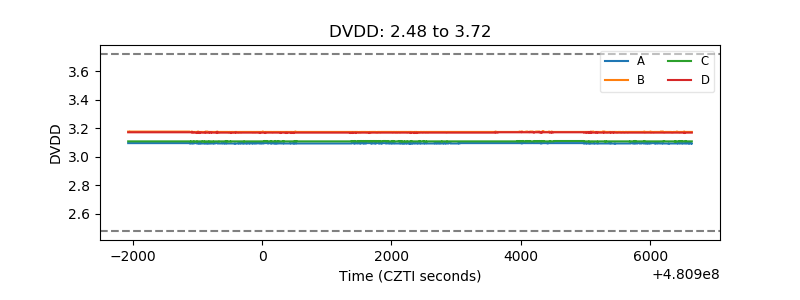 |
| Temperature 1 | 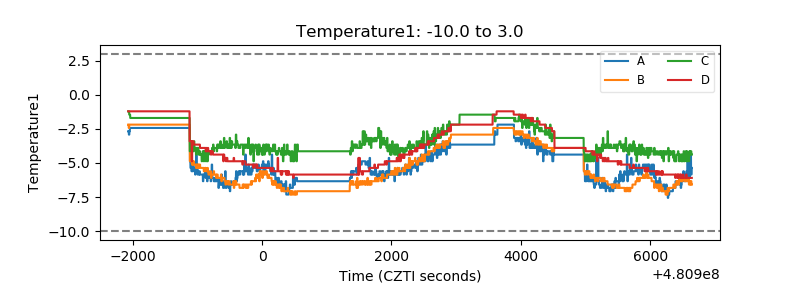 |
| Veto HV Monitor | 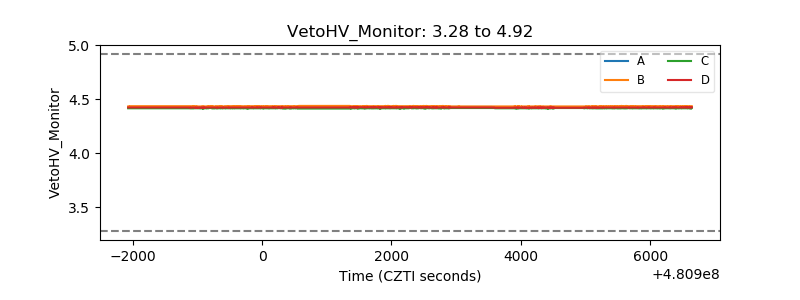 |
| Veto LLD | 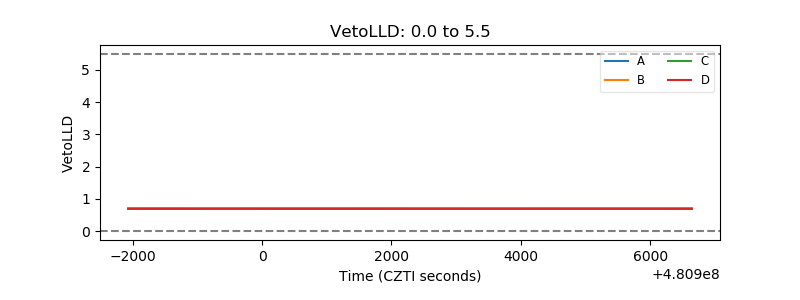 |
| Alpha Counter | 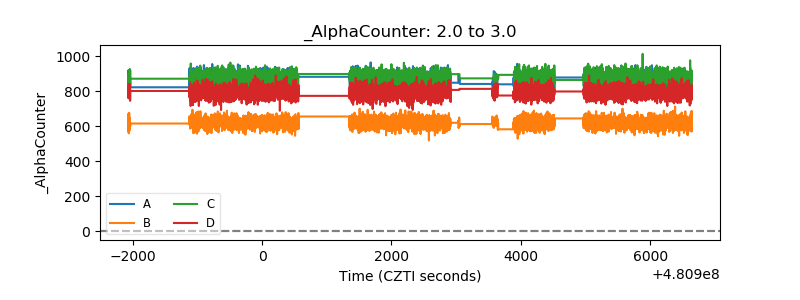 |
| _CPM_Rate | 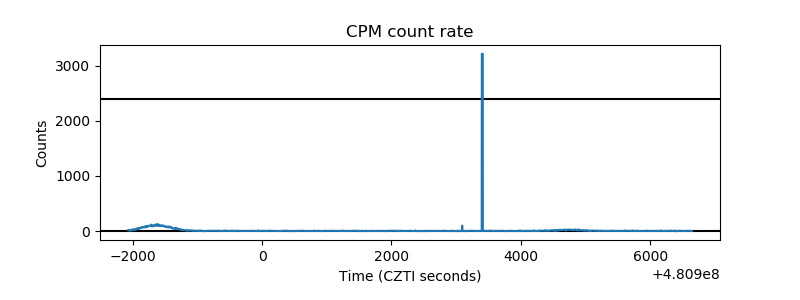 |
| CZT Counter | 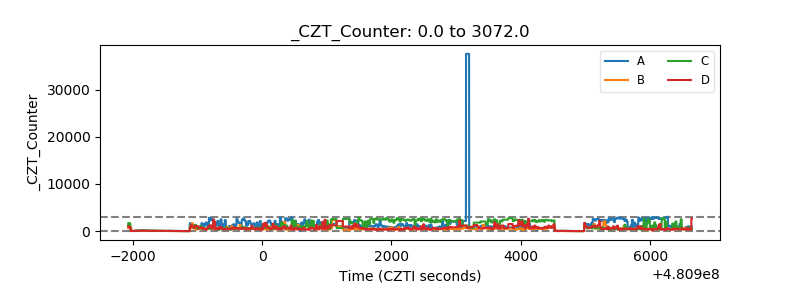 |
| +2.5 Volts monitor | 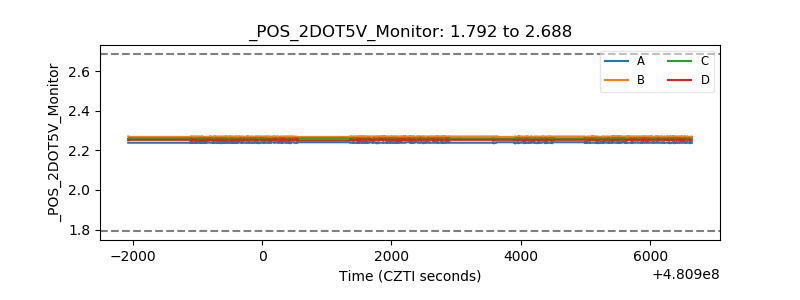 |
| +5 Volts monitor | 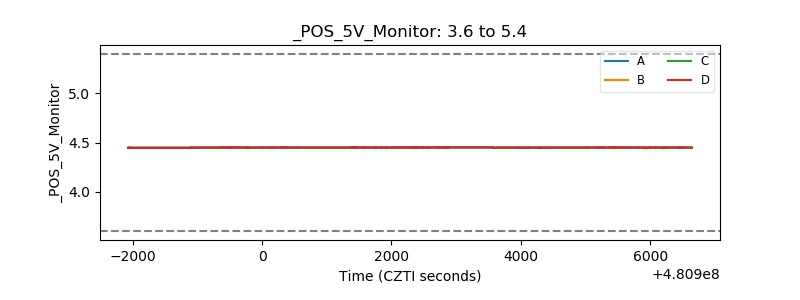 |
| _ROLL_ROT | 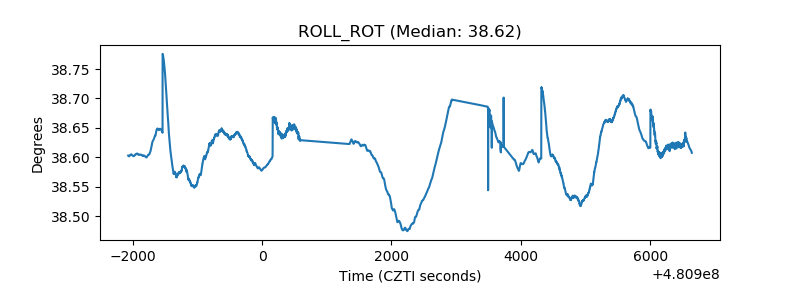 |
| _Roll_DEC | 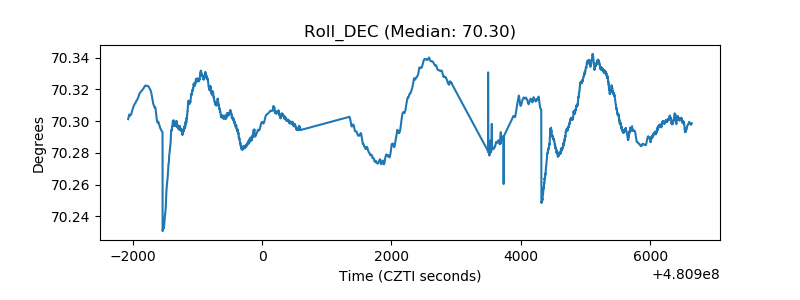 |
| _Roll_RA | 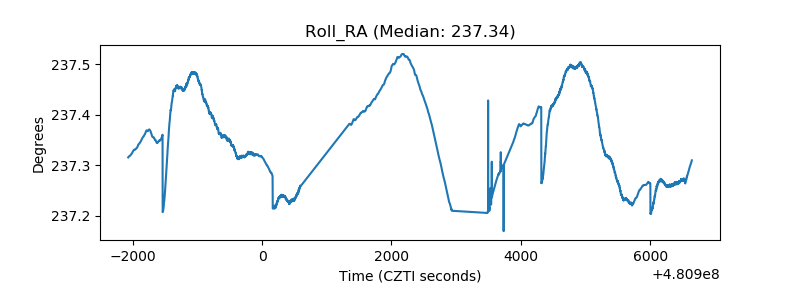 |
| Veto Counter | 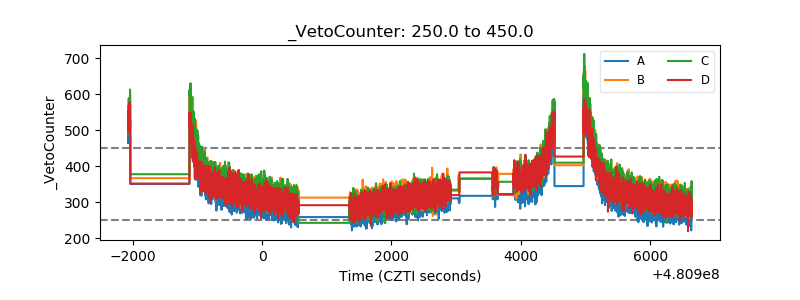 |