| Param | Original file | Final file |
|---|---|---|
| Filename | modeM0/AS1C07_001T03_9000006456_51384cztM0_level2.fits | modeM0/AS1C07_001T03_9000006456_51384cztM0_level2_quad_clean.evt |
| Size (bytes) | 635,247,360 | 50,048,640 |
| Size | 605.8 MB | 47.7 MB |
| Events in quadrant A | 6,154,529 | 337,223 |
| Events in quadrant B | 2,670,481 | 465,557 |
| Events in quadrant C | 10,703,020 | 773 |
| Events in quadrant D | 3,620,037 | 380,155 |
| Mode SS | |||
|---|---|---|---|
| Quadrant | BADHDUFLAG | Total packets | Discarded packets |
| A | 0 | 102 | 6 |
| B | 0 | 102 | 4 |
| C | 0 | 103 | 7 |
| D | 0 | 101 | 7 |
| Mode M0 | |||
|---|---|---|---|
| Quadrant | BADHDUFLAG | Total packets | Discarded packets |
| A | 0 | 23573 | 1963 |
| B | 0 | 11703 | 601 |
| C | 0 | 37168 | 2215 |
| D | 0 | 15171 | 964 |
| Mode M9 | |||
|---|---|---|---|
| Quadrant | BADHDUFLAG | Total packets | Discarded packets |
| A | 1 | 140175136745512 | 140174847639598 |
| B | 1 | -1 | -1 |
| C | 1 | -1 | -1 |
| D | 1 | -1 | -1 |
| Quadrant | Total seconds | Saturated seconds | Saturation percentage |
|---|---|---|---|
| A | 4692 | 1117 | 23.806479% |
| B | 4744 | 40 | 0.843170% |
| C | 4697 | 4691 | 99.872259% |
| D | 4726 | 243 | 5.141769% |
Noise dominated data is calculated using 1-second bins in cleaned event files. If a bin has >2000 counts, and if more than 50% of those come from <1% of pixels, then it is considered to be noise-dominated and hence unusable.
| Quadrant | # 1 sec bins | Bins with >0 counts | Bins with >2000 counts | High rate bins dominated by noise | Noise dominated (total time) | Noise dominated (detector-on time) | Marked lightcurve |
|---|---|---|---|---|---|---|---|
| A | 7582 | 4719 | 1096 | 1096 | 14.46% | 23.23% | 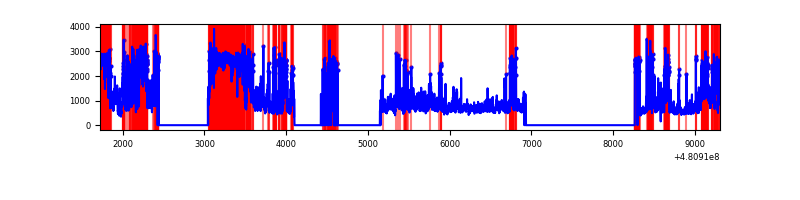 |
| B | 7581 | 4805 | 32 | 32 | 0.42% | 0.67% | 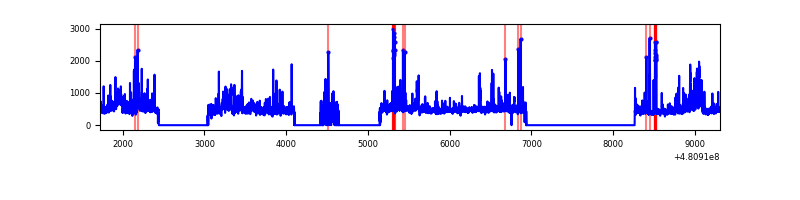 |
| C | 7580 | 4696 | 4168 | 4168 | 54.99% | 88.76% | 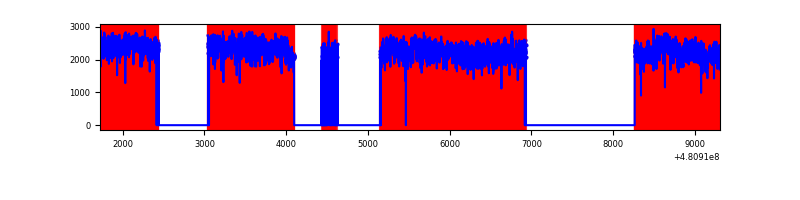 |
| D | 7581 | 4778 | 227 | 227 | 2.99% | 4.75% | 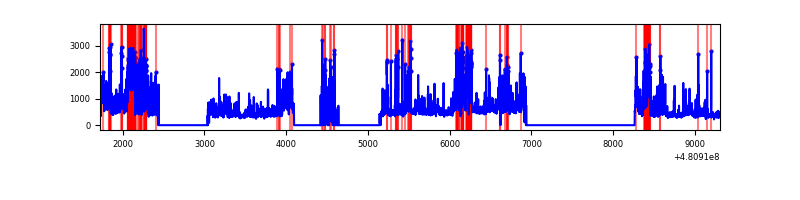 |
Top three noisy pixels from each quadrant. If the there are fewer than three noisy pixels in the level2.evt file, extra rows are filled as -1
| Pixel properties | Quadrant properties | ||||||
|---|---|---|---|---|---|---|---|
| Quadrant | DetID | PixID | Counts | Sigma | Mean | Median | Sigma |
| A | 15 | 174 | 2158187 | 20764.89 | 412 | 401 | 103.9 |
| A | 12 | 3 | 1255773 | 12080.74 | 412 | 401 | 103.9 |
| A | 12 | 250 | 330205 | 3173.78 | 412 | 401 | 103.9 |
| B | 5 | 172 | 177209 | 1735.94 | 474 | 458 | 101.8 |
| B | 4 | 81 | 169695 | 1662.14 | 474 | 458 | 101.8 |
| B | 5 | 185 | 133948 | 1311.06 | 474 | 458 | 101.8 |
| C | 15 | 179 | 7243562 | 223002.13 | 112 | 111 | 32.5 |
| C | 4 | 12 | 2567868 | 79052.83 | 112 | 111 | 32.5 |
| C | 1 | 60 | 116780 | 3591.86 | 112 | 111 | 32.5 |
| D | 11 | 176 | 1031725 | 8148.57 | 449 | 434 | 126.6 |
| D | 7 | 60 | 354035 | 2793.92 | 449 | 434 | 126.6 |
| D | 2 | 216 | 86173 | 677.45 | 449 | 434 | 126.6 |
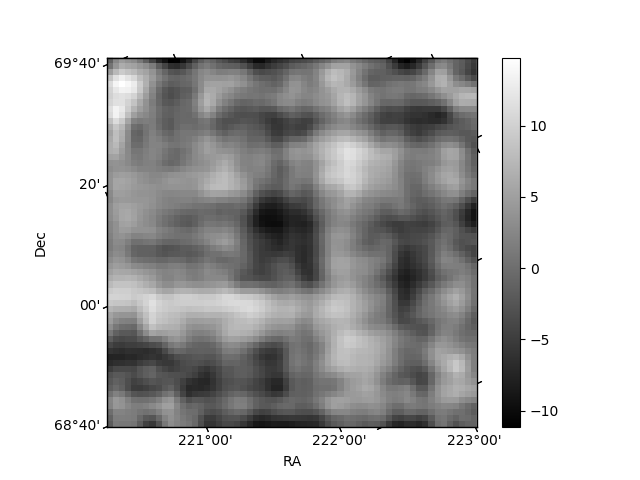
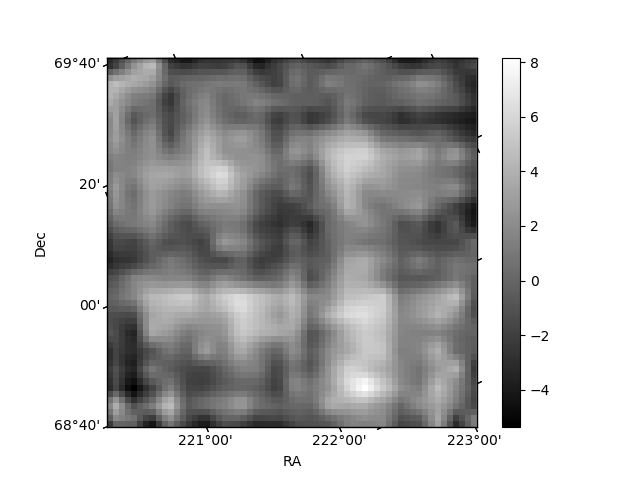
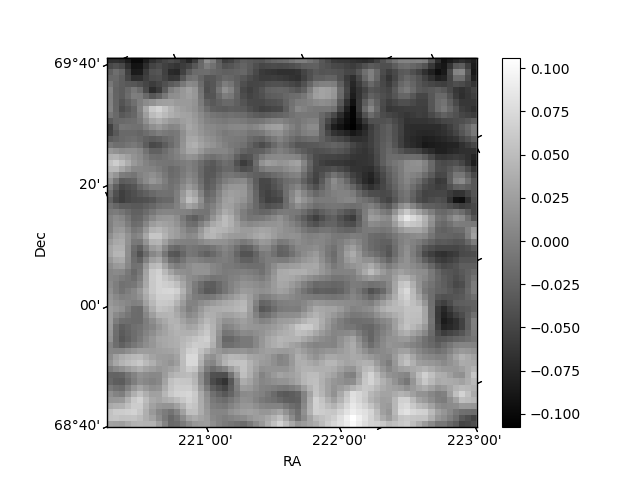
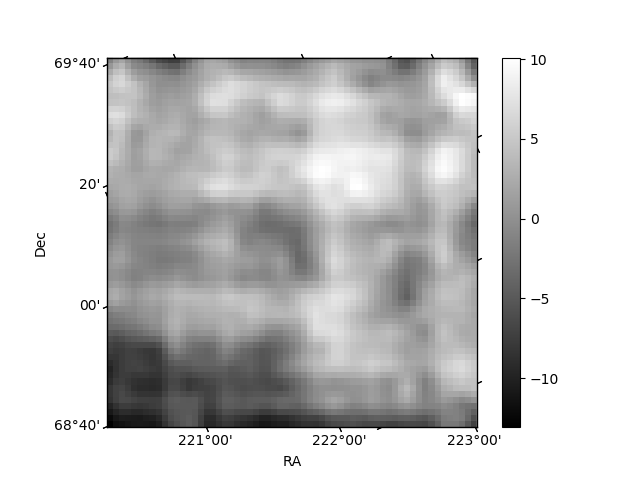
Histogram calculated using DETX and DETY for each event in the final _common_clean file
| Quadrant A | 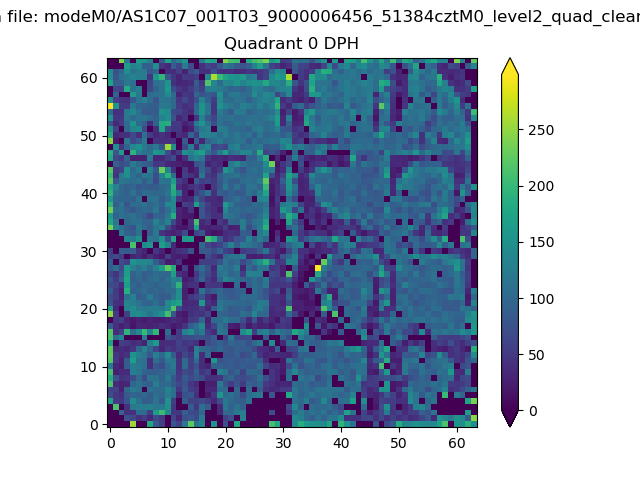 |
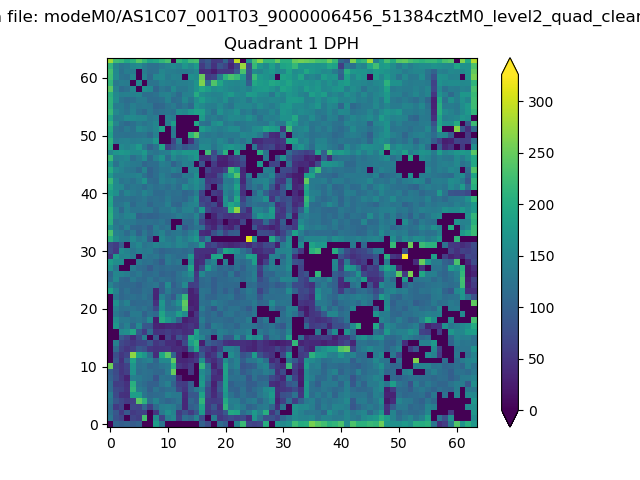 |
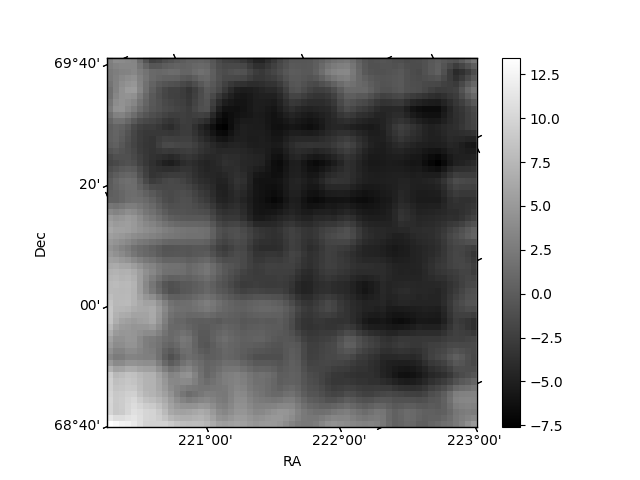
Quadrant B |
|---|---|---|---|
| Quadrant D | 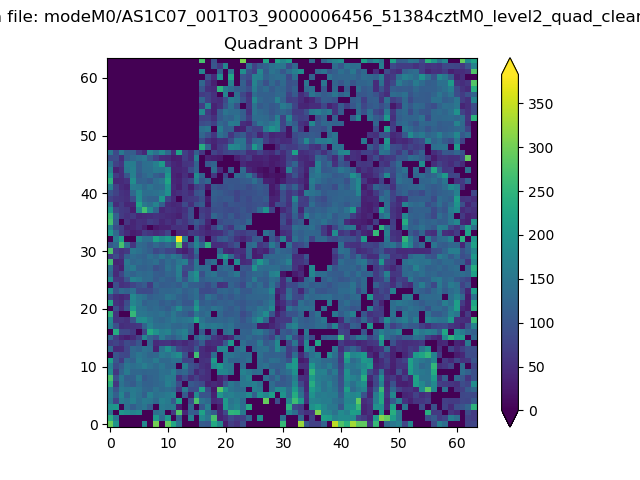 |
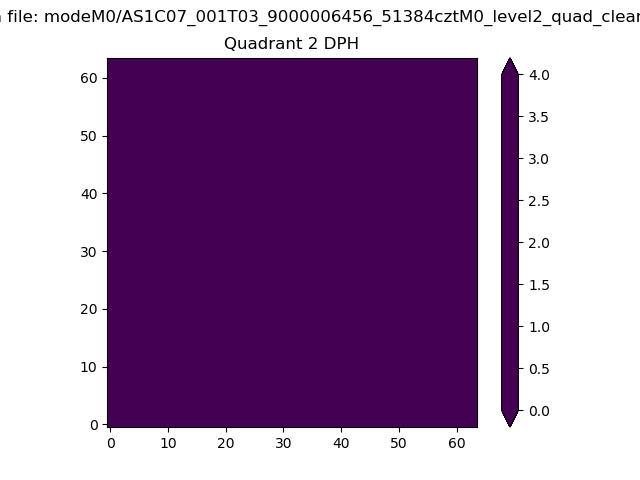 |
Quadrant C |
| Plot type | Count rate plots | Images |
|---|---|---|
| Comparison with Poisson distribution Blue bars denote a histogram of data divided into 1 sec bins. Red curve is a Poisson curve with rate = median count rate of data. |
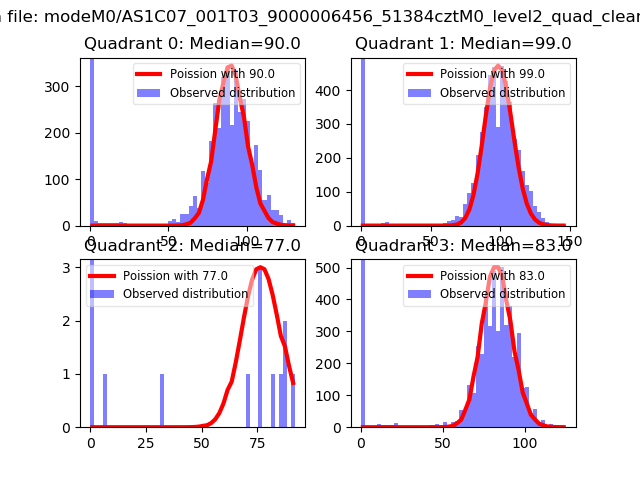 |
 |
| Quadrant-wise count rates Data is divided into 100 sec bins |
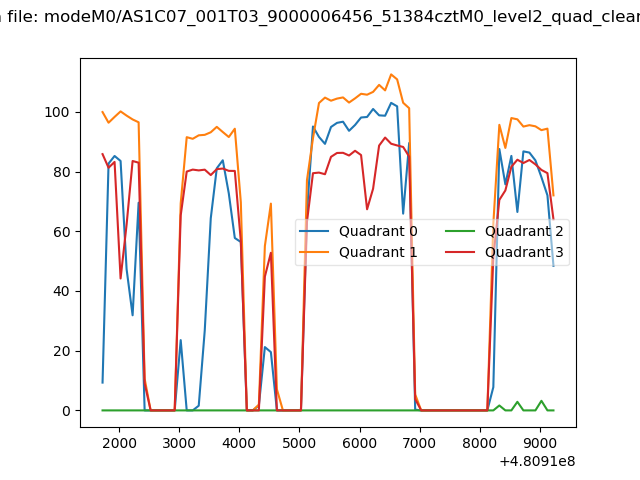 |
|
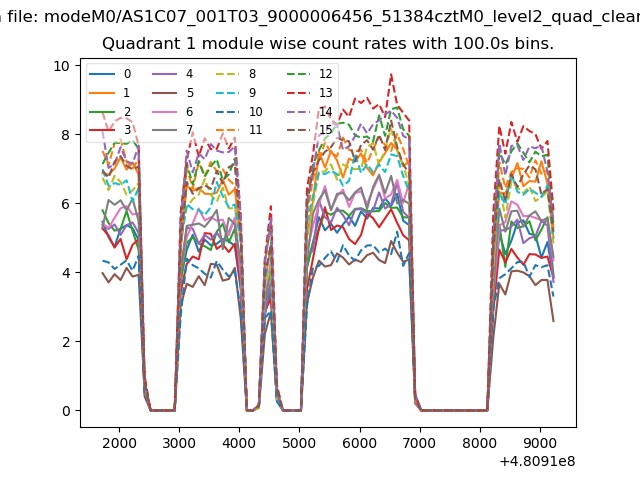
| Module-wise count rates for Quadrant A Data is divided into 100 sec bins |
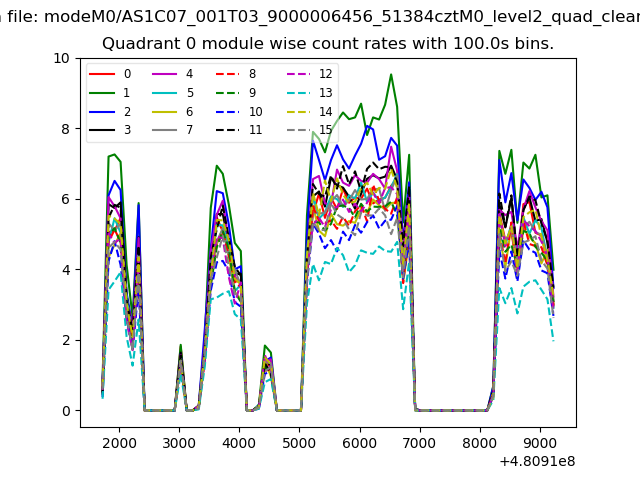 |
 |
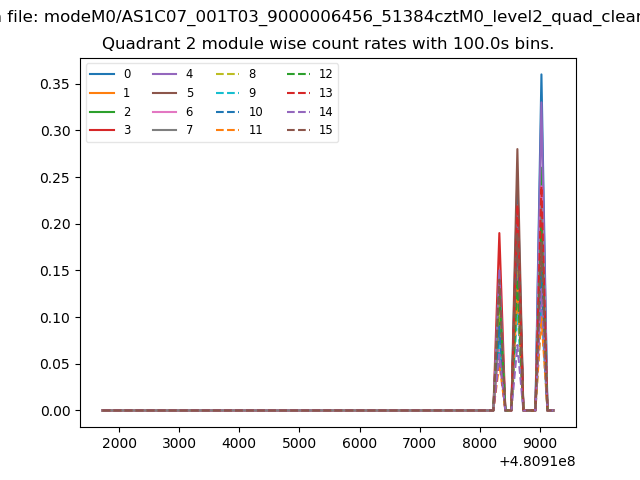
| Module-wise count rates for Quadrant B Data is divided into 100 sec bins |
 |
 |
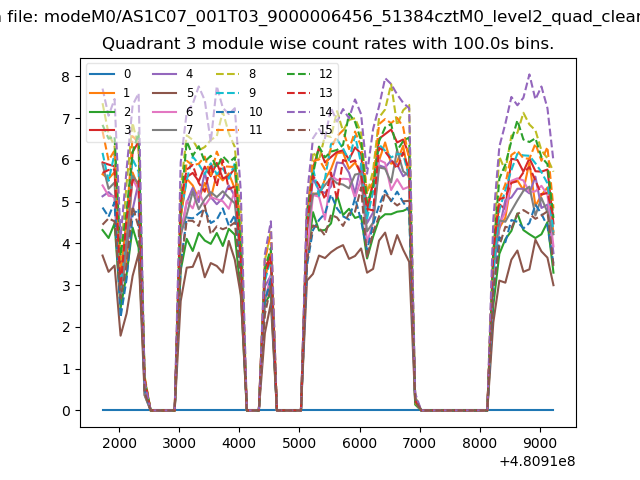
| Module-wise count rates for Quadrant C Data is divided into 100 sec bins |
 |
 |
| Module-wise count rates for Quadrant D Data is divided into 100 sec bins |
 |
 |
| Parameter | Plot |
|---|---|
| CZT HV Monitor | 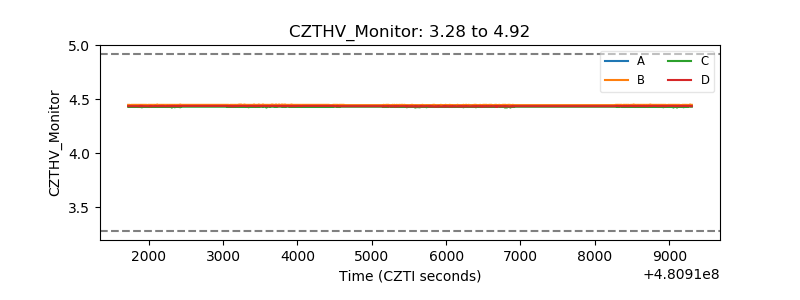 |
| D_VDD | 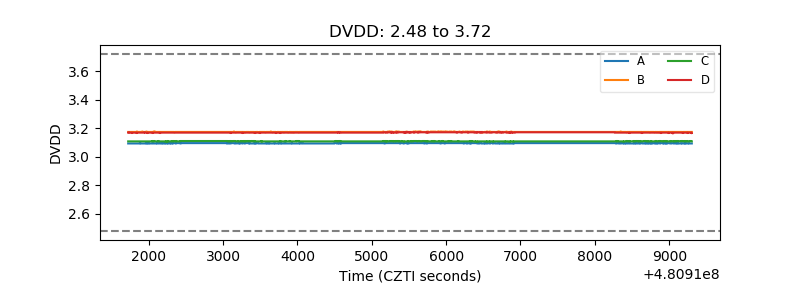 |
| Temperature 1 | 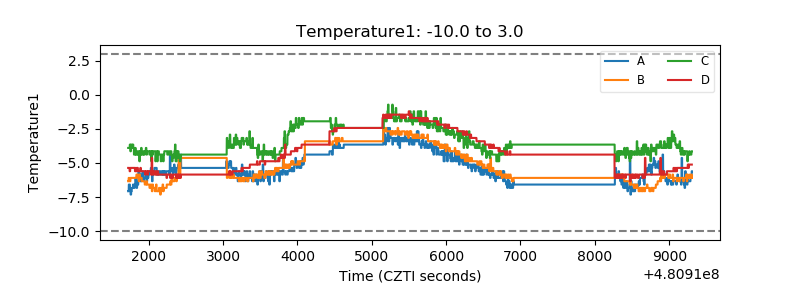 |
| Veto HV Monitor | 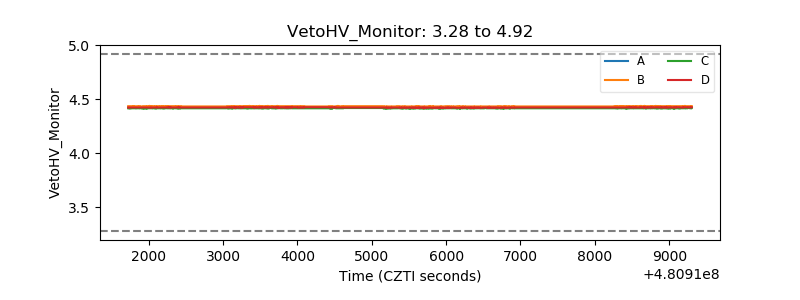 |
| Veto LLD | 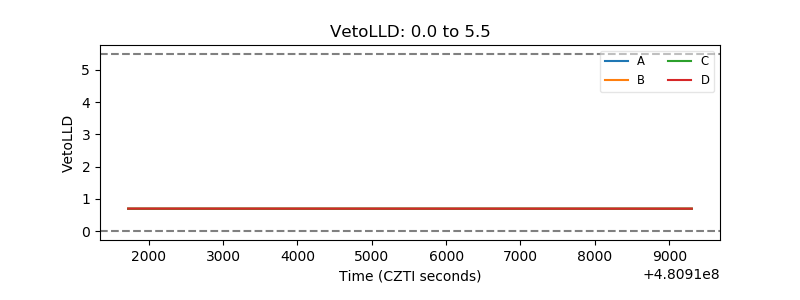 |
| Alpha Counter | 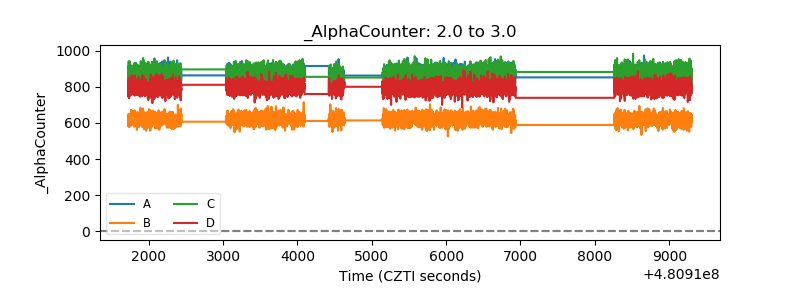 |
| _CPM_Rate | 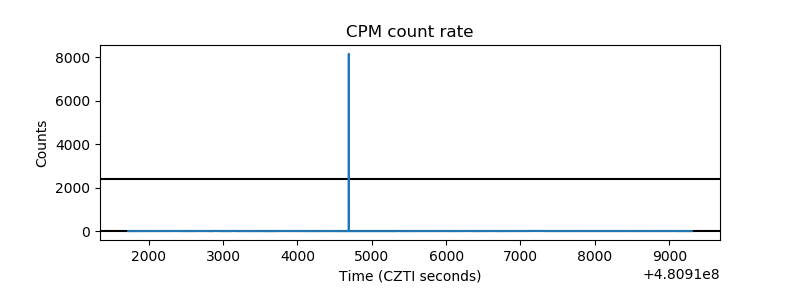 |
| CZT Counter | 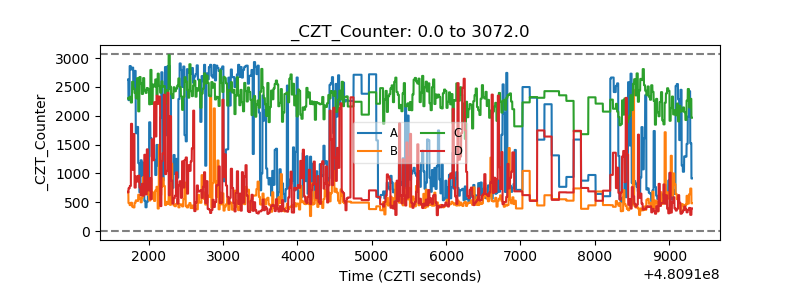 |
| +2.5 Volts monitor | 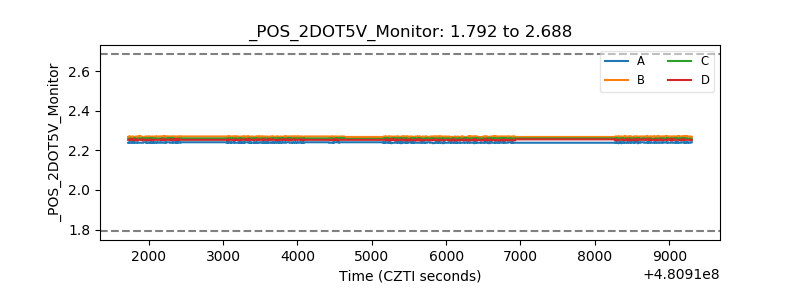 |
| +5 Volts monitor | 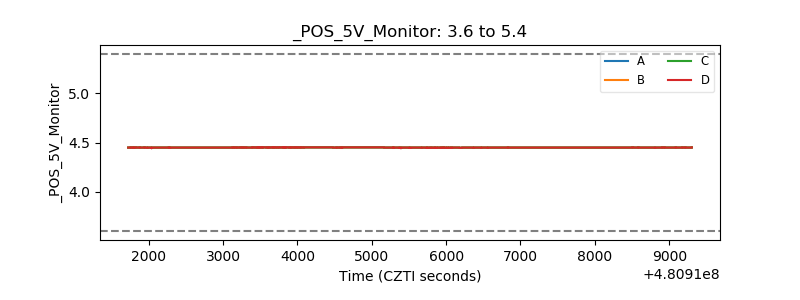 |
| _ROLL_ROT | 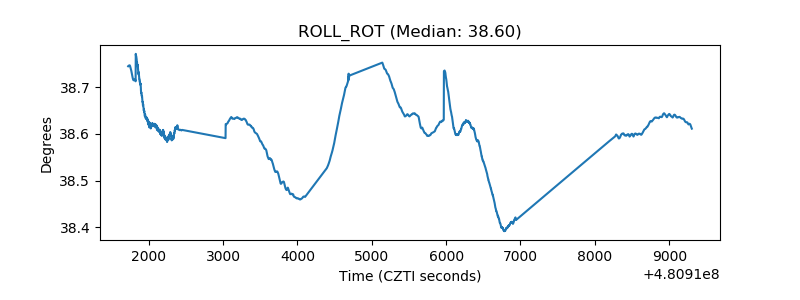 |
| _Roll_DEC | 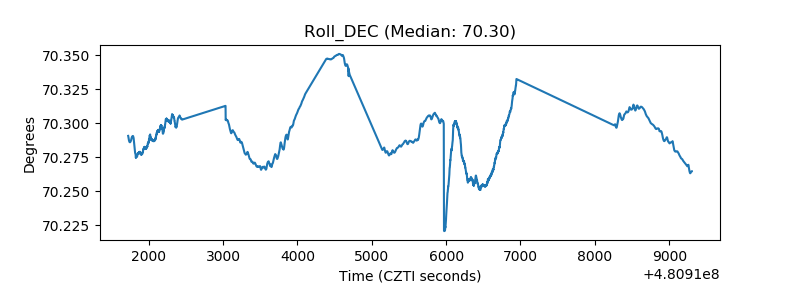 |
| _Roll_RA | 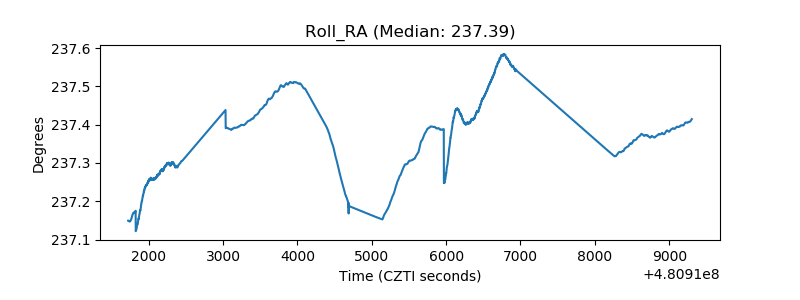 |
| Veto Counter | 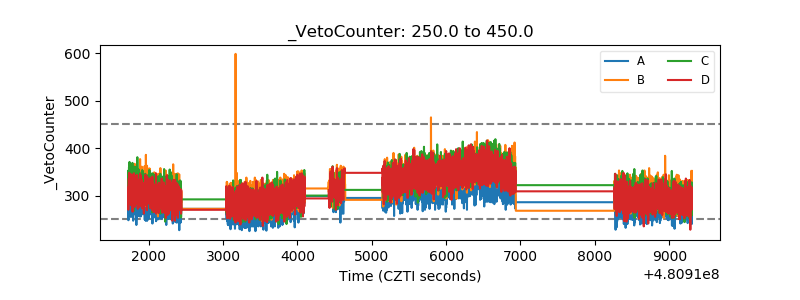 |