| Param | Original file | Final file |
|---|---|---|
| Filename | modeM0/AS1C07_001T03_9000006456_51389cztM0_level2.fits | modeM0/AS1C07_001T03_9000006456_51389cztM0_level2_quad_clean.evt |
| Size (bytes) | 426,519,360 | 46,892,160 |
| Size | 406.8 MB | 44.7 MB |
| Events in quadrant A | 4,280,701 | 321,025 |
| Events in quadrant B | 2,151,804 | 378,263 |
| Events in quadrant C | 7,033,462 | 132,150 |
| Events in quadrant D | 2,029,142 | 322,039 |
| Mode SS | |||
|---|---|---|---|
| Quadrant | BADHDUFLAG | Total packets | Discarded packets |
| A | 0 | 82 | 4 |
| B | 0 | 80 | 2 |
| C | 0 | 84 | 6 |
| D | 0 | 80 | 2 |
| Mode M0 | |||
|---|---|---|---|
| Quadrant | BADHDUFLAG | Total packets | Discarded packets |
| A | 0 | 16256 | 847 |
| B | 0 | 9489 | 514 |
| C | 0 | 24620 | 1110 |
| D | 0 | 9241 | 489 |
| Mode M9 | |||
|---|---|---|---|
| Quadrant | BADHDUFLAG | Total packets | Discarded packets |
| A | 0 | 7 | 0 |
| B | 0 | 9 | 2 |
| C | 0 | 7 | 0 |
| D | 0 | 11 | 4 |
| Quadrant | Total seconds | Saturated seconds | Saturation percentage |
|---|---|---|---|
| A | 3759 | 442 | 11.758446% |
| B | 3770 | 94 | 2.493369% |
| C | 3746 | 2491 | 66.497597% |
| D | 3771 | 73 | 1.935826% |
Noise dominated data is calculated using 1-second bins in cleaned event files. If a bin has >2000 counts, and if more than 50% of those come from <1% of pixels, then it is considered to be noise-dominated and hence unusable.
| Quadrant | # 1 sec bins | Bins with >0 counts | Bins with >2000 counts | High rate bins dominated by noise | Noise dominated (total time) | Noise dominated (detector-on time) | Marked lightcurve |
|---|---|---|---|---|---|---|---|
| A | 5095 | 3782 | 313 | 313 | 6.14% | 8.28% | 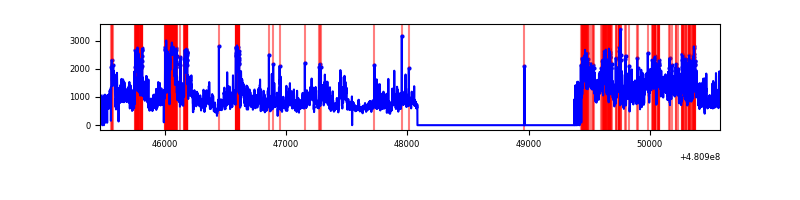 |
| B | 5109 | 3796 | 25 | 25 | 0.49% | 0.66% | 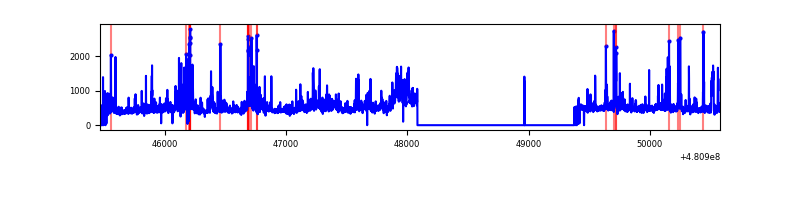 |
| C | 5083 | 3758 | 2087 | 2087 | 41.06% | 55.53% | 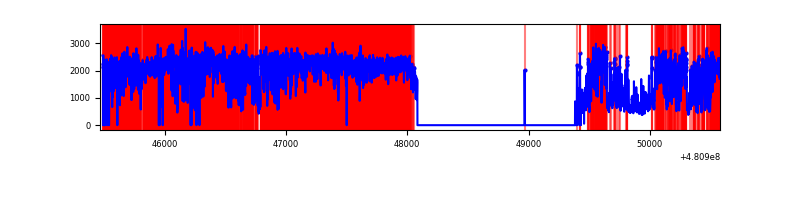 |
| D | 5100 | 3791 | 38 | 38 | 0.75% | 1.00% | 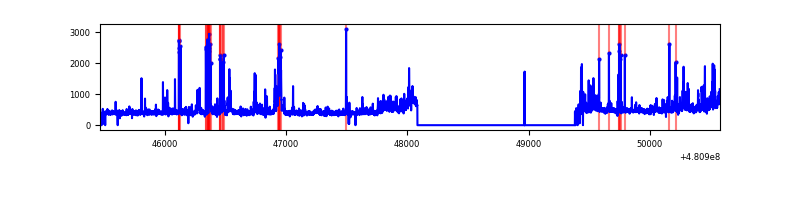 |
Top three noisy pixels from each quadrant. If the there are fewer than three noisy pixels in the level2.evt file, extra rows are filled as -1
| Pixel properties | Quadrant properties | ||||||
|---|---|---|---|---|---|---|---|
| Quadrant | DetID | PixID | Counts | Sigma | Mean | Median | Sigma |
| A | 12 | 3 | 1696623 | 17897.42 | 378 | 368 | 94.8 |
| A | 15 | 174 | 412889 | 4352.57 | 378 | 368 | 94.8 |
| A | 4 | 175 | 255004 | 2686.7 | 378 | 368 | 94.8 |
| B | 4 | 81 | 145877 | 1728.55 | 391 | 378 | 84.2 |
| B | 5 | 185 | 136425 | 1616.26 | 391 | 378 | 84.2 |
| B | 0 | 216 | 35279 | 414.63 | 391 | 378 | 84.2 |
| C | 15 | 179 | 4934938 | 65310.48 | 272 | 270 | 75.6 |
| C | 15 | 248 | 577755 | 7643.03 | 272 | 270 | 75.6 |
| C | 4 | 12 | 307345 | 4064.15 | 272 | 270 | 75.6 |
| D | 11 | 176 | 213406 | 1966.21 | 382 | 368 | 108.3 |
| D | 15 | 171 | 60222 | 552.42 | 382 | 368 | 108.3 |
| D | 2 | 153 | 47825 | 438.0 | 382 | 368 | 108.3 |
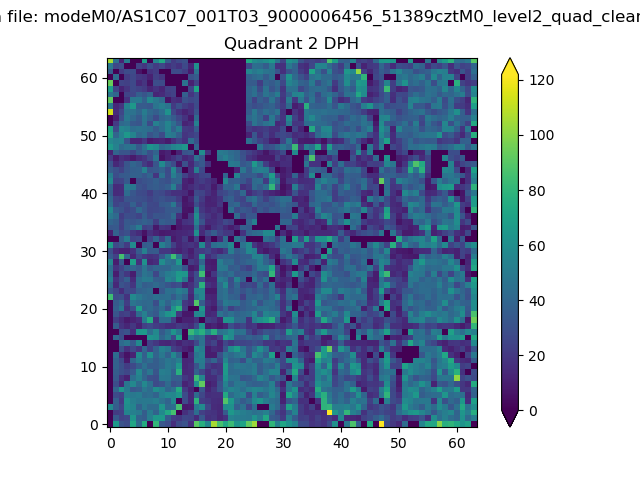
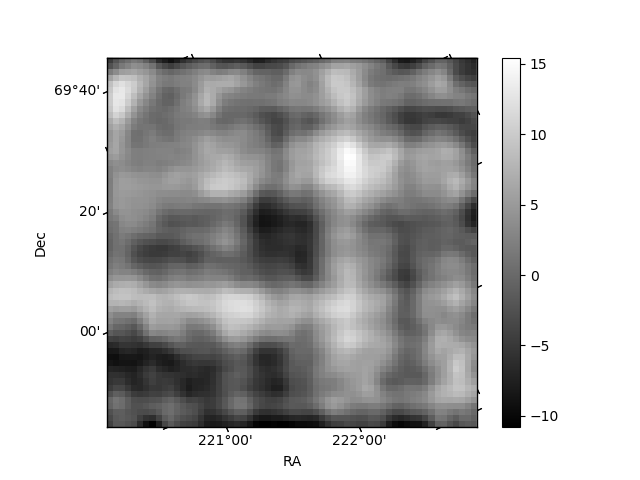
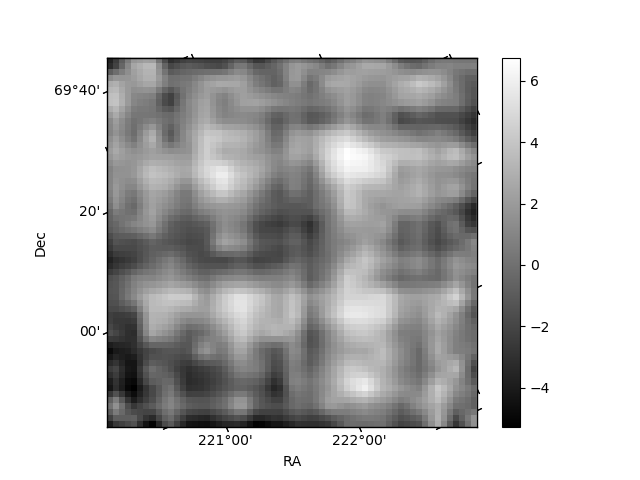
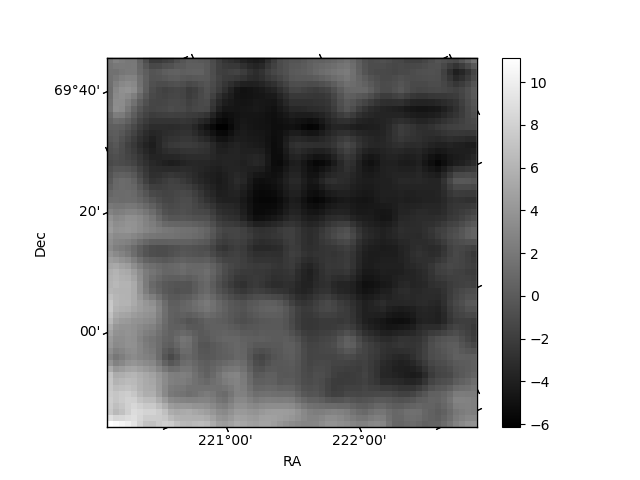
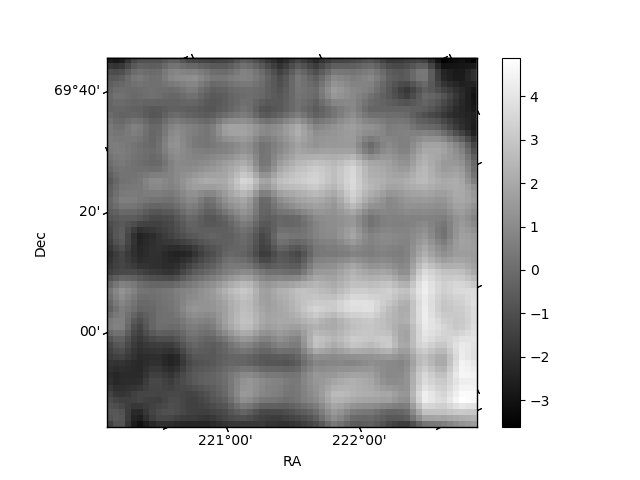
Histogram calculated using DETX and DETY for each event in the final _common_clean file
| Quadrant A | 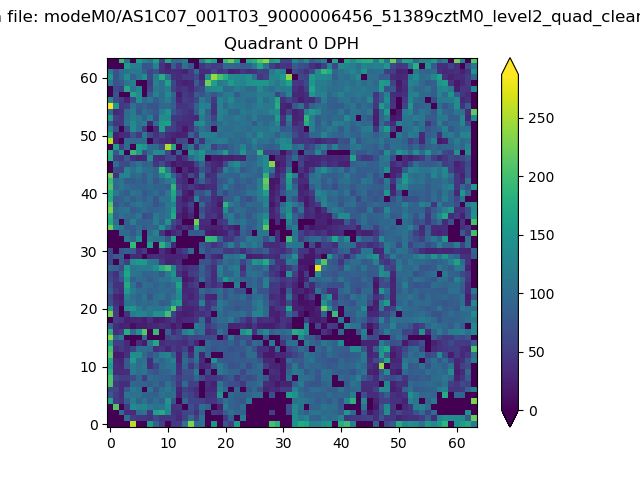 |
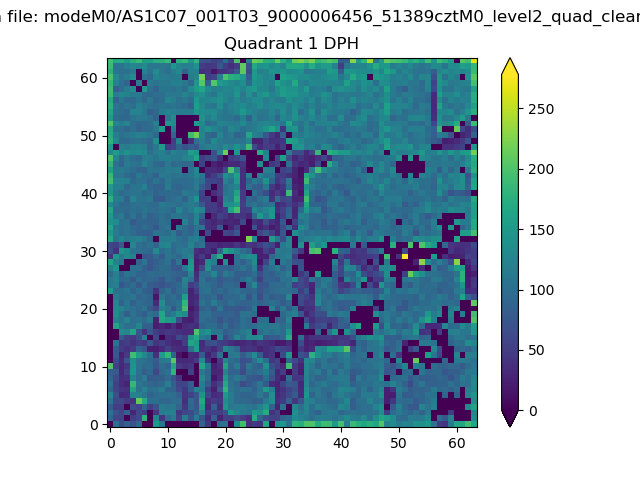 |
Quadrant B |
|---|---|---|---|
| Quadrant D | 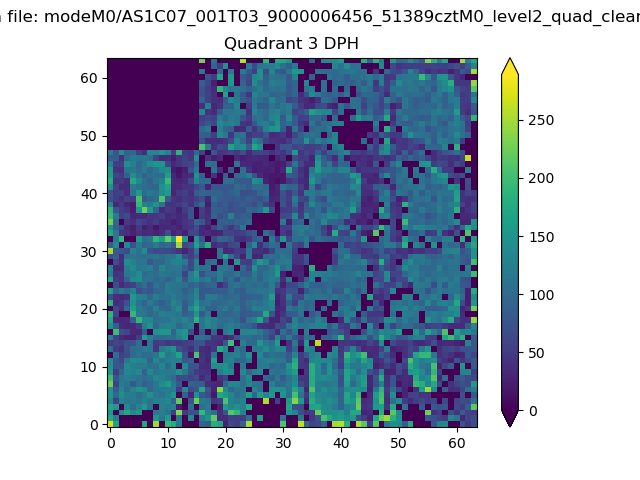 |
 |
Quadrant C |
| Plot type | Count rate plots | Images |
|---|---|---|
| Comparison with Poisson distribution Blue bars denote a histogram of data divided into 1 sec bins. Red curve is a Poisson curve with rate = median count rate of data. |
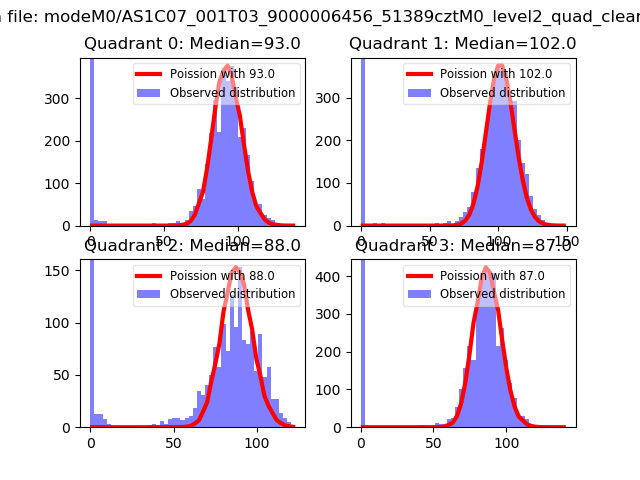 |
 |
| Quadrant-wise count rates Data is divided into 100 sec bins |
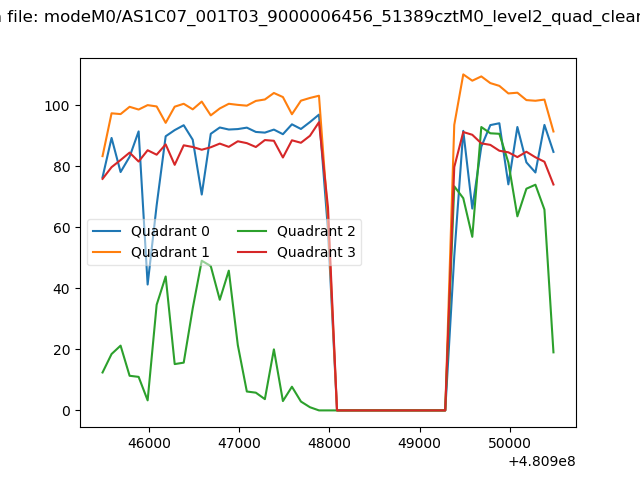 |
|
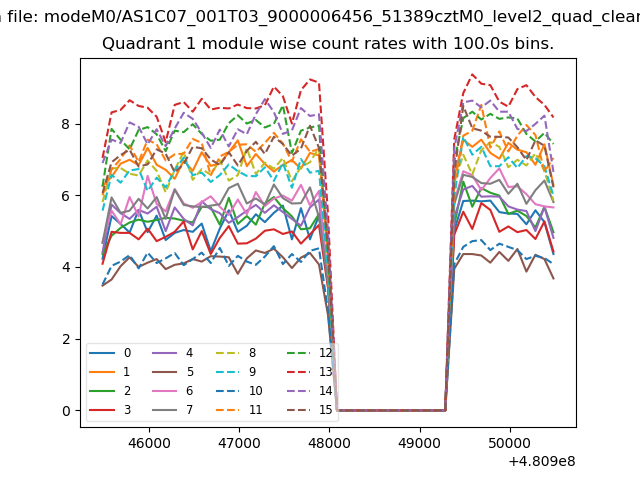
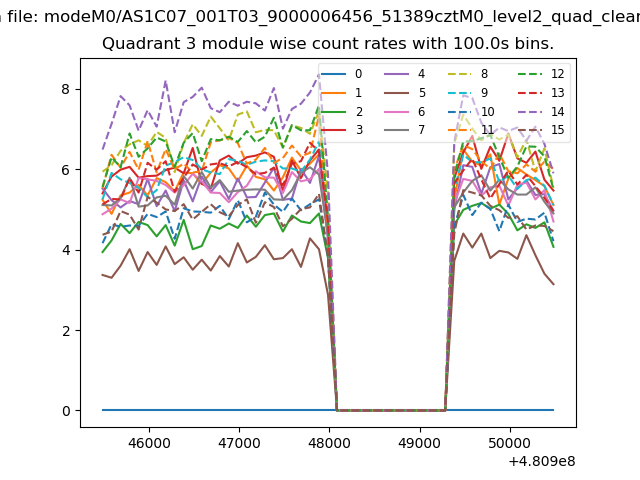
| Module-wise count rates for Quadrant A Data is divided into 100 sec bins |
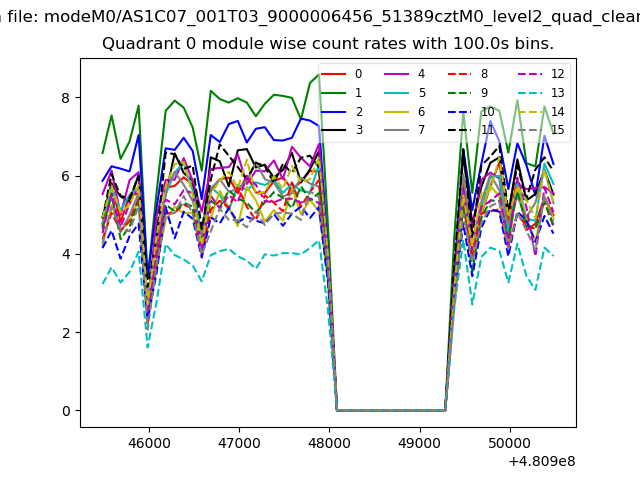 |
 |
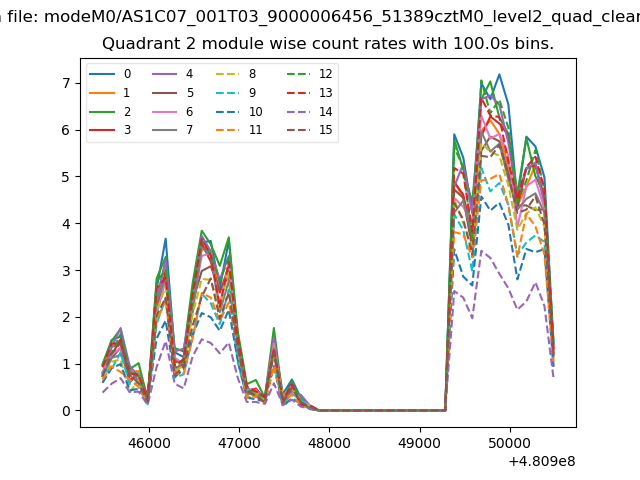
| Module-wise count rates for Quadrant B Data is divided into 100 sec bins |
 |
 |
| Module-wise count rates for Quadrant C Data is divided into 100 sec bins |
 |
 |
| Module-wise count rates for Quadrant D Data is divided into 100 sec bins |
 |
 |
| Parameter | Plot |
|---|---|
| CZT HV Monitor | 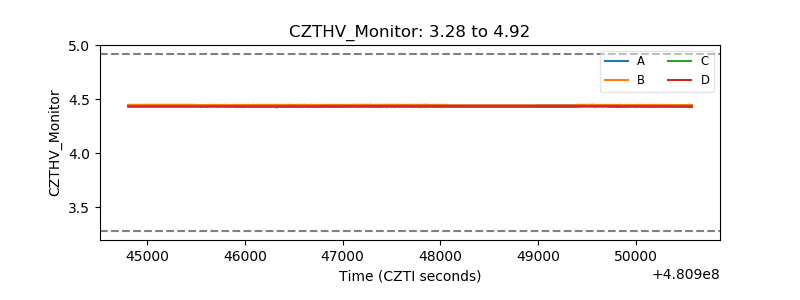 |
| D_VDD | 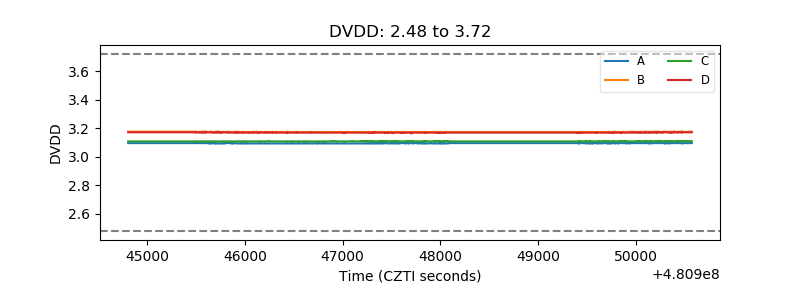 |
| Temperature 1 | 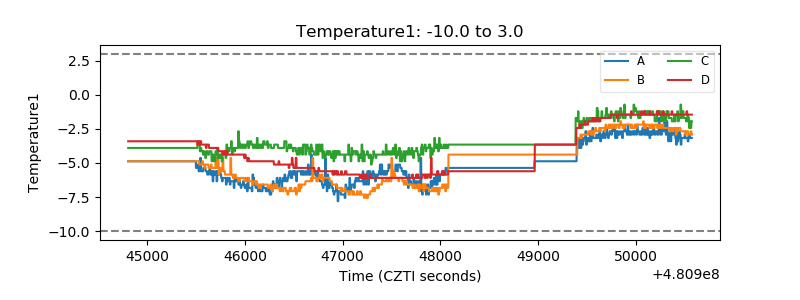 |
| Veto HV Monitor |  |
| Veto LLD | 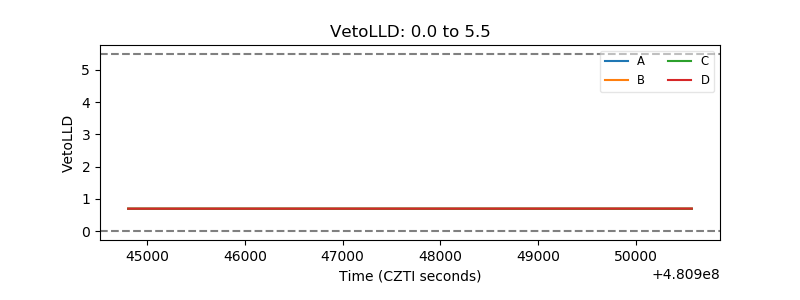 |
| Alpha Counter | 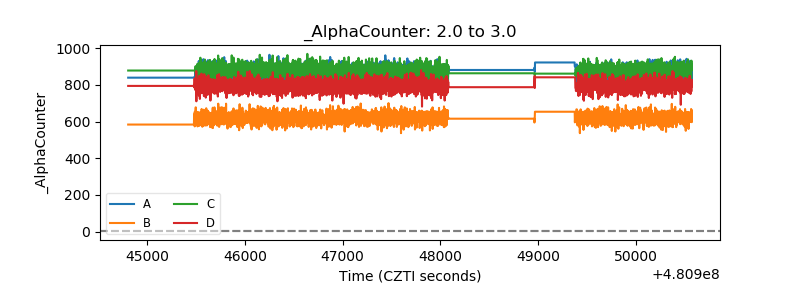 |
| _CPM_Rate | 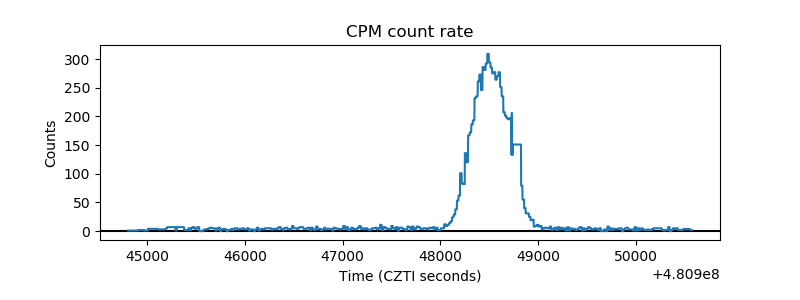 |
| CZT Counter | 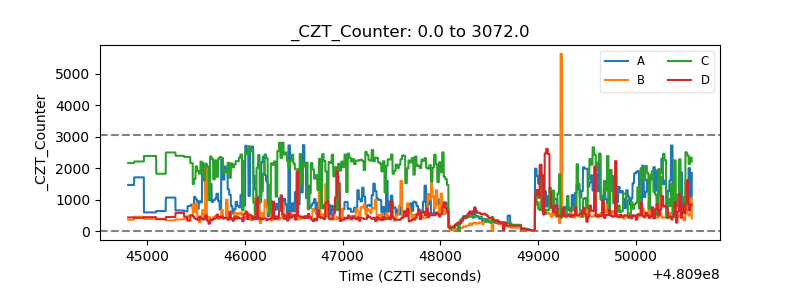 |
| +2.5 Volts monitor | 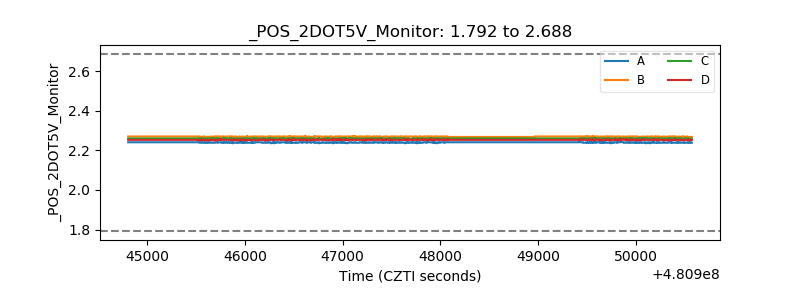 |
| +5 Volts monitor | 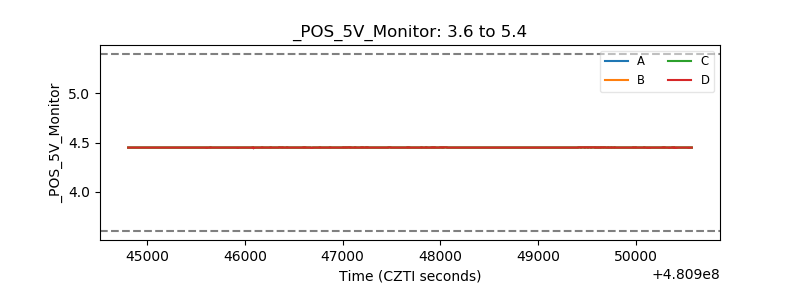 |
| _ROLL_ROT | 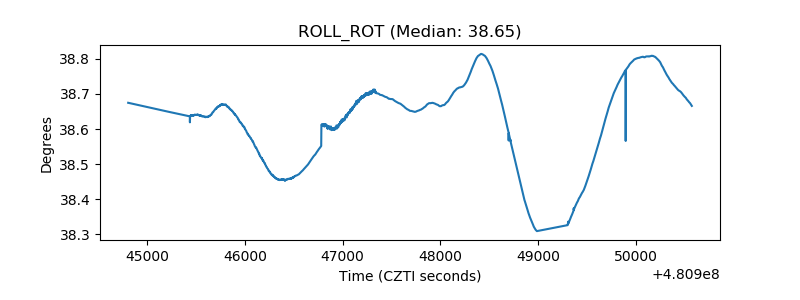 |
| _Roll_DEC | 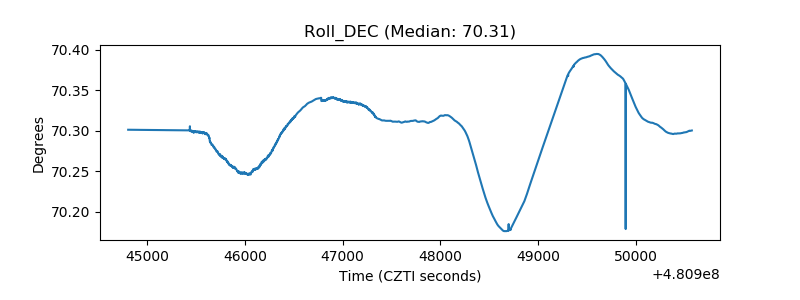 |
| _Roll_RA | 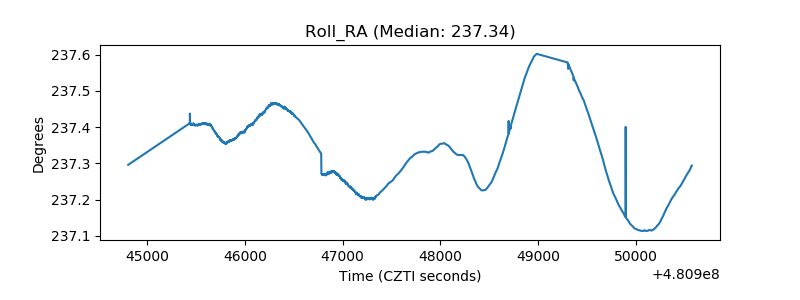 |
| Veto Counter | 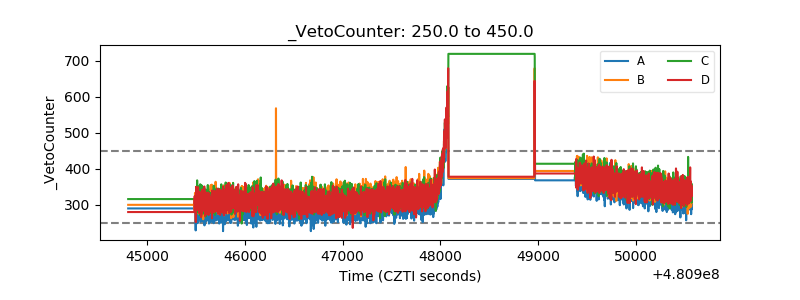 |