| Param | Original file | Final file |
|---|---|---|
| Filename | modeM0/AS1C07_001T03_9000006456_51391cztM0_level2.fits | modeM0/AS1C07_001T03_9000006456_51391cztM0_level2_quad_clean.evt |
| Size (bytes) | 422,354,880 | 46,180,800 |
| Size | 402.8 MB | 44.0 MB |
| Events in quadrant A | 4,131,933 | 327,447 |
| Events in quadrant B | 2,107,493 | 372,356 |
| Events in quadrant C | 7,088,848 | 117,891 |
| Events in quadrant D | 2,012,802 | 315,130 |
| Mode SS | |||
|---|---|---|---|
| Quadrant | BADHDUFLAG | Total packets | Discarded packets |
| A | 0 | 81 | 3 |
| B | 0 | 80 | 2 |
| C | 0 | 79 | 3 |
| D | 0 | 79 | 1 |
| Mode M0 | |||
|---|---|---|---|
| Quadrant | BADHDUFLAG | Total packets | Discarded packets |
| A | 0 | 15877 | 975 |
| B | 0 | 9339 | 315 |
| C | 0 | 24693 | 1096 |
| D | 0 | 9116 | 443 |
| Mode M9 | |||
|---|---|---|---|
| Quadrant | BADHDUFLAG | Total packets | Discarded packets |
| A | 0 | 12 | 1 |
| B | 0 | 12 | 1 |
| C | 0 | 11 | 0 |
| D | 0 | 11 | 0 |
| Quadrant | Total seconds | Saturated seconds | Saturation percentage |
|---|---|---|---|
| A | 3739 | 330 | 8.825889% |
| B | 3784 | 167 | 4.413319% |
| C | 3740 | 2652 | 70.909091% |
| D | 3761 | 86 | 2.286626% |
Noise dominated data is calculated using 1-second bins in cleaned event files. If a bin has >2000 counts, and if more than 50% of those come from <1% of pixels, then it is considered to be noise-dominated and hence unusable.
| Quadrant | # 1 sec bins | Bins with >0 counts | Bins with >2000 counts | High rate bins dominated by noise | Noise dominated (total time) | Noise dominated (detector-on time) | Marked lightcurve |
|---|---|---|---|---|---|---|---|
| A | 6080 | 3773 | 257 | 257 | 4.23% | 6.81% | 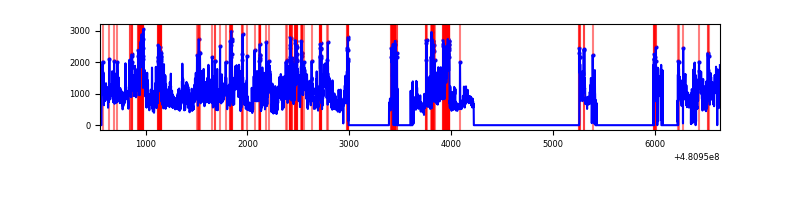 |
| B | 6083 | 3813 | 95 | 95 | 1.56% | 2.49% | 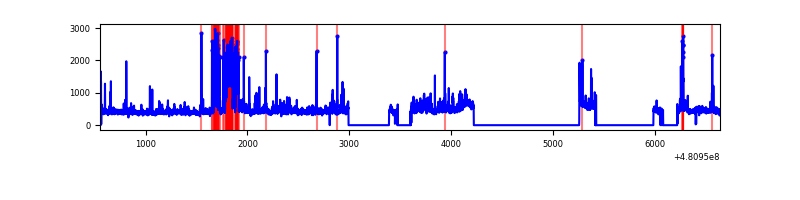 |
| C | 6080 | 3751 | 2379 | 2379 | 39.13% | 63.42% | 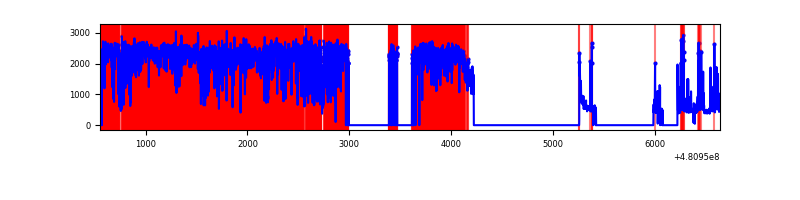 |
| D | 6079 | 3801 | 26 | 26 | 0.43% | 0.68% | 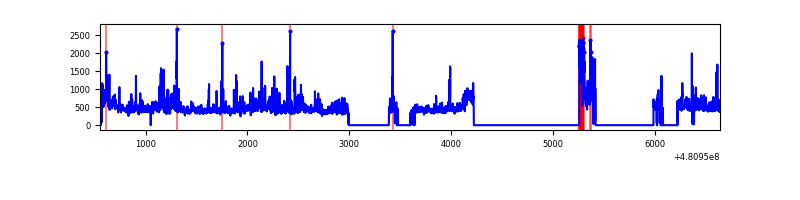 |
Top three noisy pixels from each quadrant. If the there are fewer than three noisy pixels in the level2.evt file, extra rows are filled as -1
| Pixel properties | Quadrant properties | ||||||
|---|---|---|---|---|---|---|---|
| Quadrant | DetID | PixID | Counts | Sigma | Mean | Median | Sigma |
| A | 12 | 3 | 1674519 | 17764.06 | 376 | 366 | 94.2 |
| A | 15 | 174 | 367775 | 3898.49 | 376 | 366 | 94.2 |
| A | 12 | 194 | 190510 | 2017.58 | 376 | 366 | 94.2 |
| B | 5 | 185 | 276581 | 3307.09 | 387 | 372 | 83.5 |
| B | 0 | 171 | 54925 | 653.17 | 387 | 372 | 83.5 |
| B | 5 | 172 | 42970 | 510.03 | 387 | 372 | 83.5 |
| C | 15 | 179 | 5583233 | 82002.57 | 245 | 243 | 68.1 |
| C | 4 | 12 | 131096 | 1921.96 | 245 | 243 | 68.1 |
| C | 15 | 248 | 89218 | 1306.86 | 245 | 243 | 68.1 |
| D | 11 | 176 | 135228 | 1272.53 | 379 | 366 | 106.0 |
| D | 15 | 187 | 54412 | 509.96 | 379 | 366 | 106.0 |
| D | 7 | 46 | 44906 | 420.27 | 379 | 366 | 106.0 |
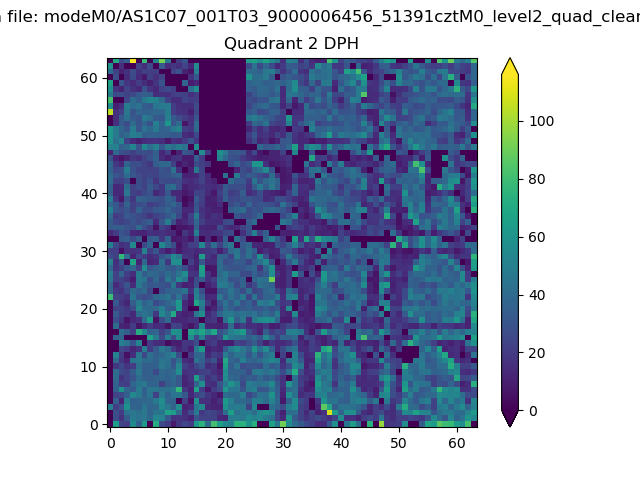
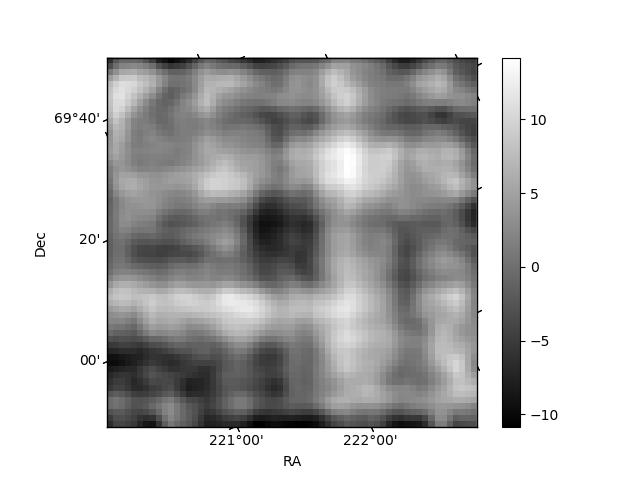
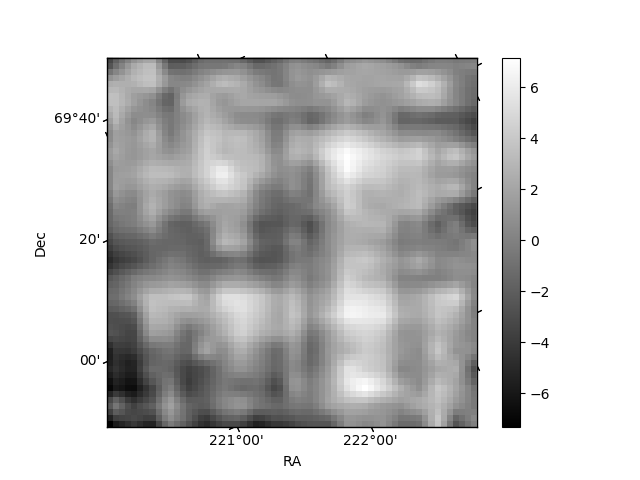
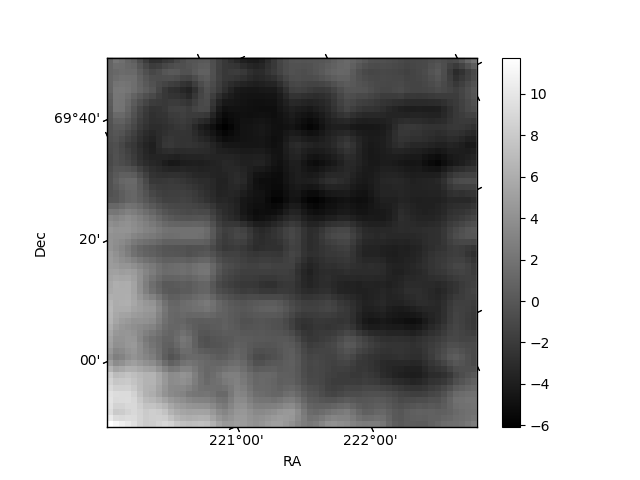
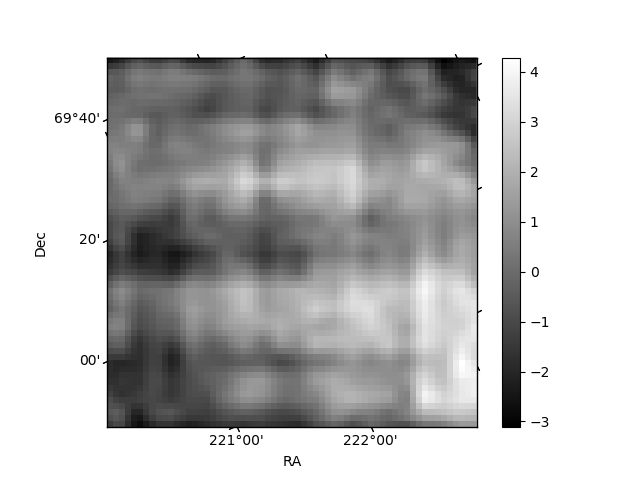
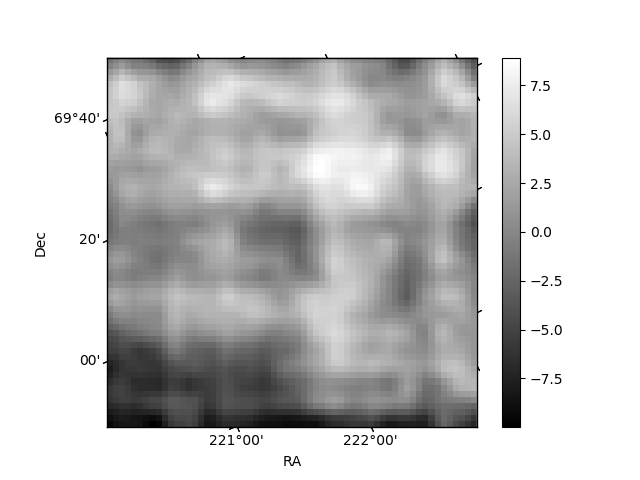
Histogram calculated using DETX and DETY for each event in the final _common_clean file
| Quadrant A | 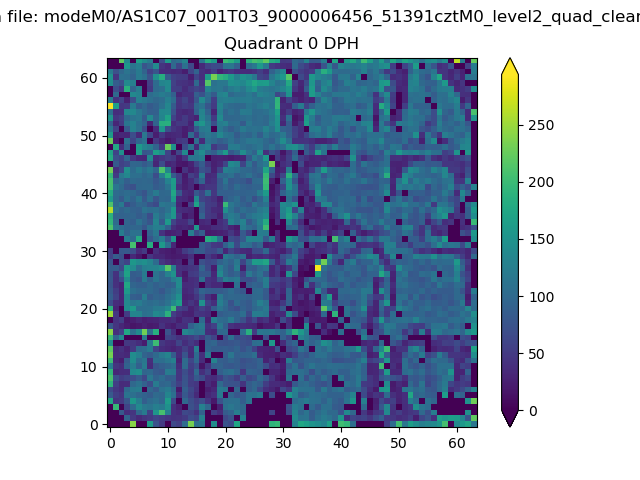 |
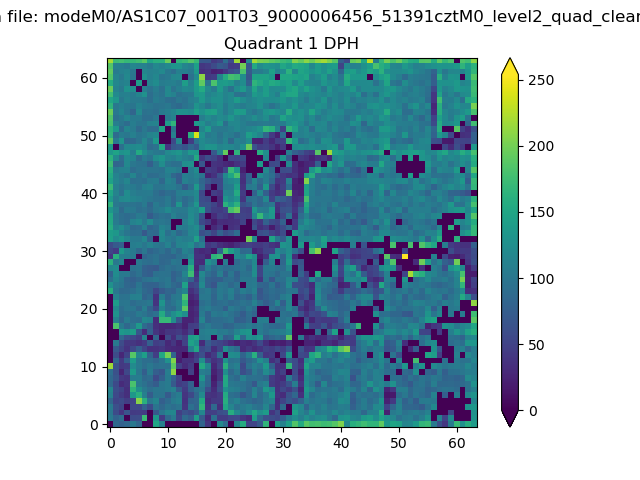 |
Quadrant B |
|---|---|---|---|
| Quadrant D | 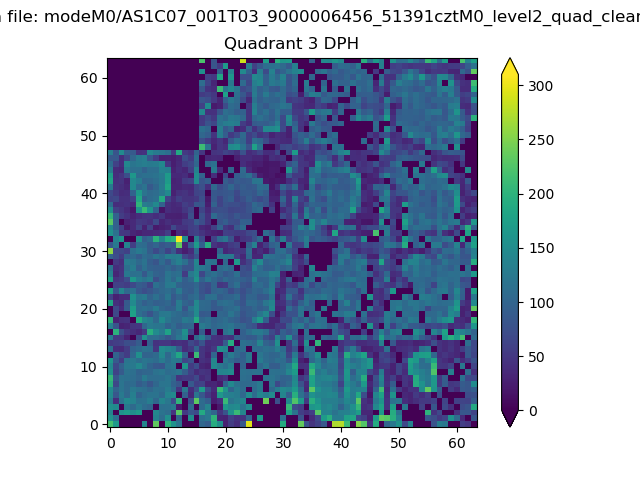 |
 |
Quadrant C |
| Plot type | Count rate plots | Images |
|---|---|---|
| Comparison with Poisson distribution Blue bars denote a histogram of data divided into 1 sec bins. Red curve is a Poisson curve with rate = median count rate of data. |
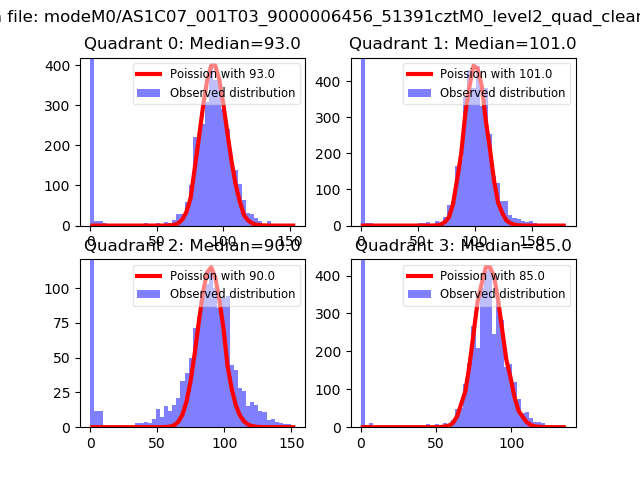 |
 |
| Quadrant-wise count rates Data is divided into 100 sec bins |
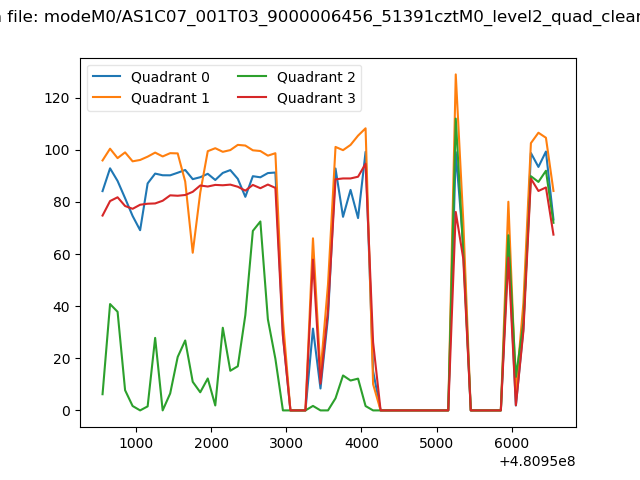 |
|
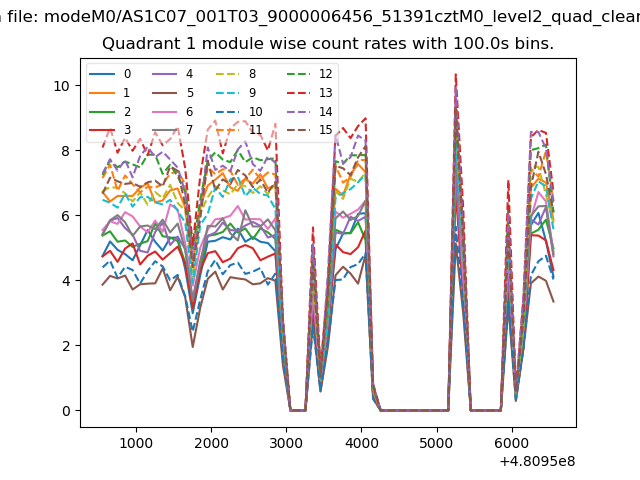
| Module-wise count rates for Quadrant A Data is divided into 100 sec bins |
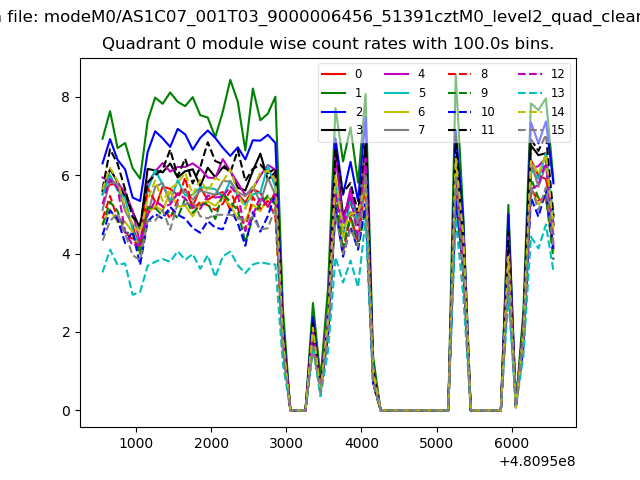 |
 |
| Module-wise count rates for Quadrant B Data is divided into 100 sec bins |
 |
 |
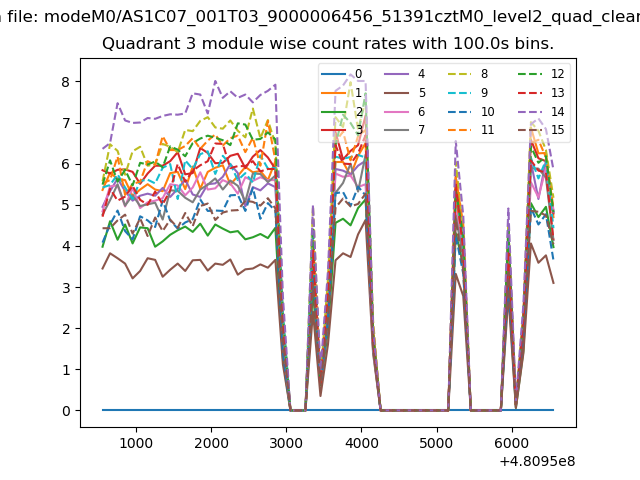
| Module-wise count rates for Quadrant C Data is divided into 100 sec bins |
 |
 |
| Module-wise count rates for Quadrant D Data is divided into 100 sec bins |
 |
 |
| Parameter | Plot |
|---|---|
| CZT HV Monitor | 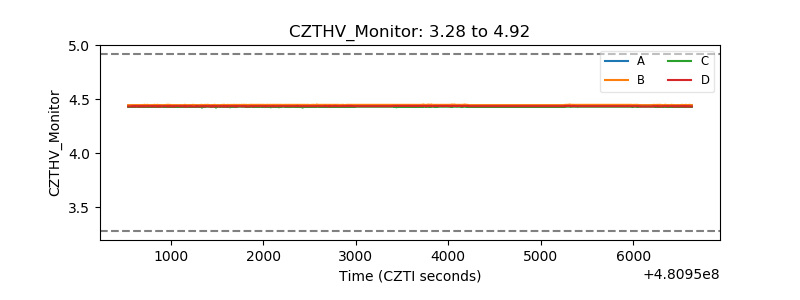 |
| D_VDD | 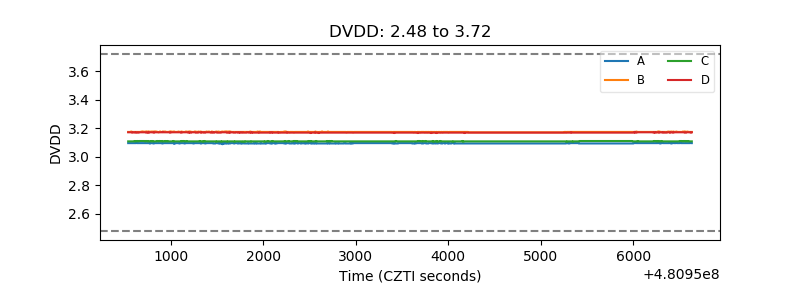 |
| Temperature 1 | 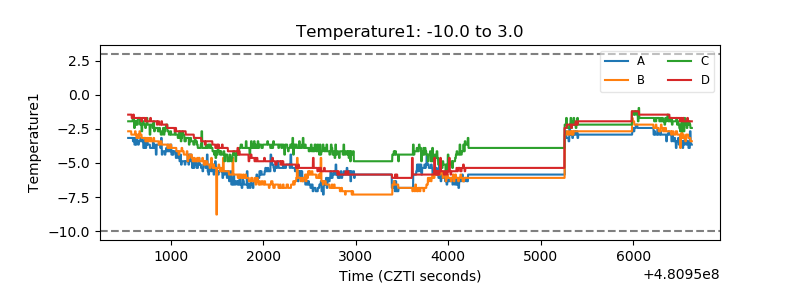 |
| Veto HV Monitor | 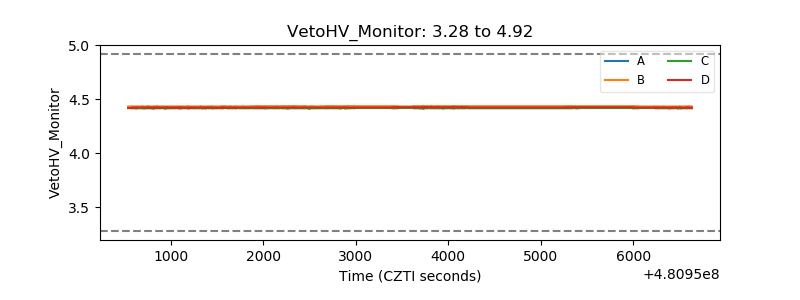 |
| Veto LLD | 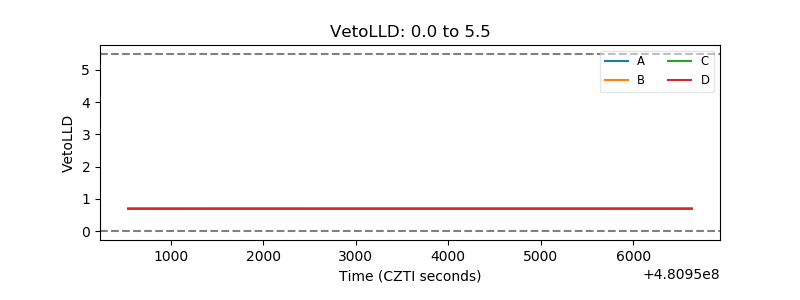 |
| Alpha Counter | 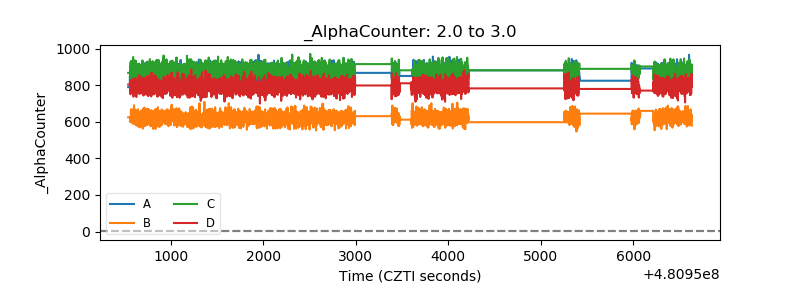 |
| _CPM_Rate | 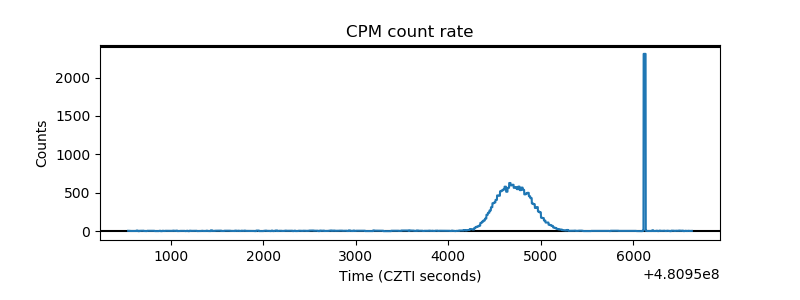 |
| CZT Counter | 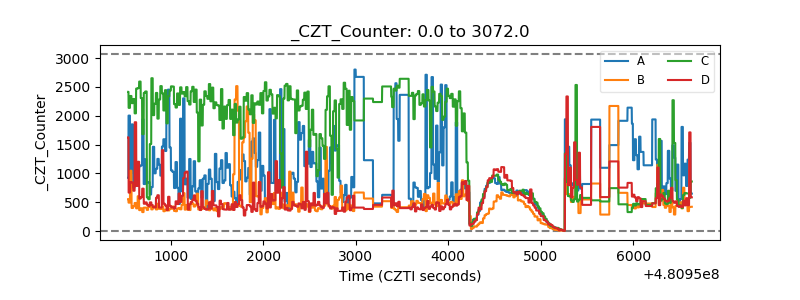 |
| +2.5 Volts monitor |  |
| +5 Volts monitor | 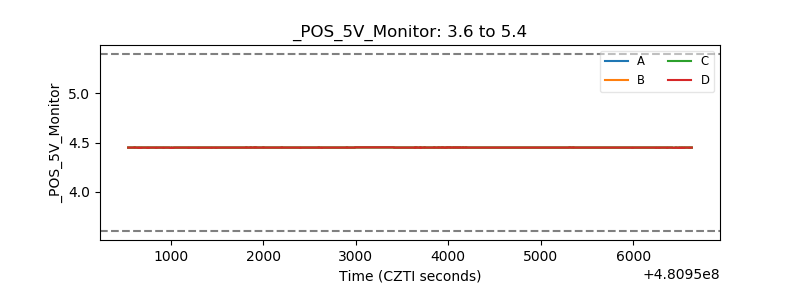 |
| _ROLL_ROT | 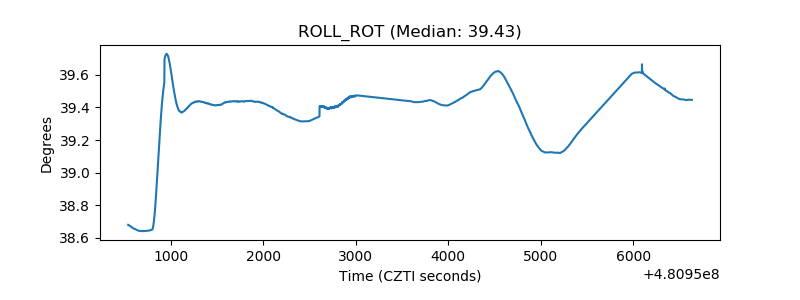 |
| _Roll_DEC | 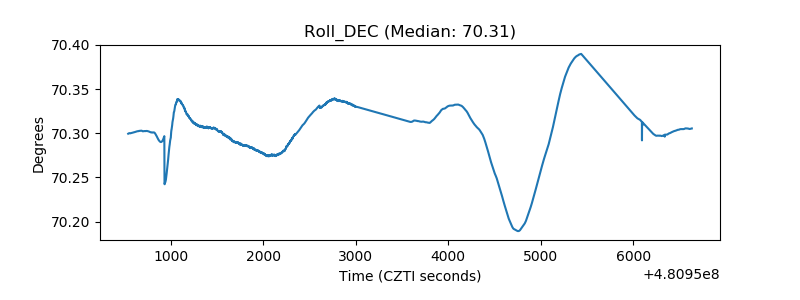 |
| _Roll_RA | 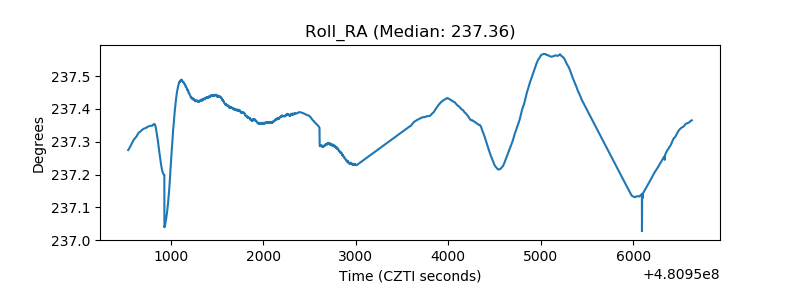 |
| Veto Counter | 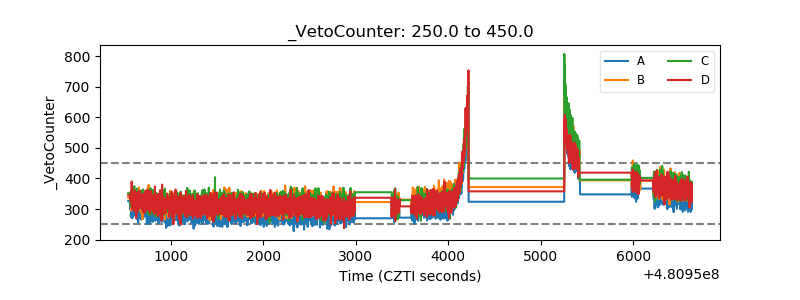 |