| Param | Original file | Final file |
|---|---|---|
| Filename | modeM0/AS1C07_001T03_9000006456_51392cztM0_level2.fits | modeM0/AS1C07_001T03_9000006456_51392cztM0_level2_quad_clean.evt |
| Size (bytes) | 157,962,240 | 11,868,480 |
| Size | 150.6 MB | 11.3 MB |
| Events in quadrant A | 1,890,403 | 56,961 |
| Events in quadrant B | 848,648 | 93,862 |
| Events in quadrant C | 2,190,400 | 39,620 |
| Events in quadrant D | 825,921 | 82,297 |
| Mode SS | |||
|---|---|---|---|
| Quadrant | BADHDUFLAG | Total packets | Discarded packets |
| A | 0 | 26 | 0 |
| B | 0 | 26 | 0 |
| C | 0 | 26 | 2 |
| D | 0 | 26 | 0 |
| Mode M0 | |||
|---|---|---|---|
| Quadrant | BADHDUFLAG | Total packets | Discarded packets |
| A | 0 | 6579 | 166 |
| B | 0 | 3333 | 64 |
| C | 0 | 7607 | 298 |
| D | 0 | 3309 | 79 |
| Mode M9 | |||
|---|---|---|---|
| Quadrant | BADHDUFLAG | Total packets | Discarded packets |
| A | 0 | 11 | 0 |
| B | 0 | 11 | 0 |
| C | 0 | 11 | 0 |
| D | 0 | 11 | 0 |
| Quadrant | Total seconds | Saturated seconds | Saturation percentage |
|---|---|---|---|
| A | 1140 | 556 | 48.771930% |
| B | 1151 | 164 | 14.248480% |
| C | 1141 | 820 | 71.866784% |
| D | 1148 | 71 | 6.184669% |
Noise dominated data is calculated using 1-second bins in cleaned event files. If a bin has >2000 counts, and if more than 50% of those come from <1% of pixels, then it is considered to be noise-dominated and hence unusable.
| Quadrant | # 1 sec bins | Bins with >0 counts | Bins with >2000 counts | High rate bins dominated by noise | Noise dominated (total time) | Noise dominated (detector-on time) | Marked lightcurve |
|---|---|---|---|---|---|---|---|
| A | 2278 | 1147 | 339 | 339 | 14.88% | 29.56% | 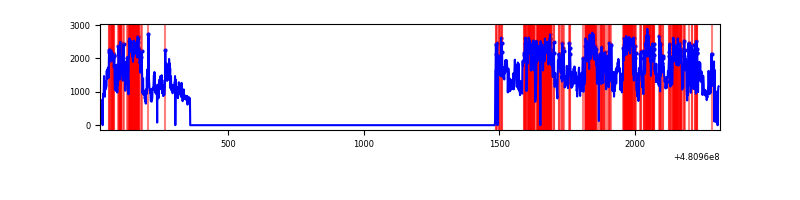 |
| B | 2285 | 1155 | 39 | 39 | 1.71% | 3.38% | 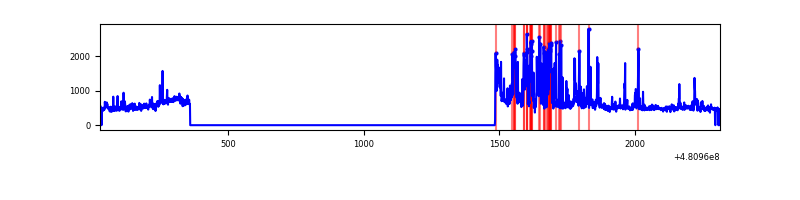 |
| C | 2269 | 1140 | 639 | 639 | 28.16% | 56.05% | 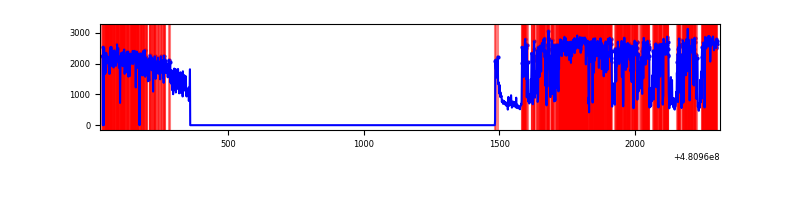 |
| D | 2283 | 1152 | 17 | 17 | 0.74% | 1.48% | 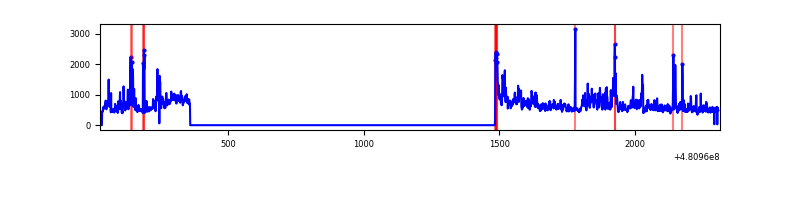 |
Top three noisy pixels from each quadrant. If the there are fewer than three noisy pixels in the level2.evt file, extra rows are filled as -1
| Pixel properties | Quadrant properties | ||||||
|---|---|---|---|---|---|---|---|
| Quadrant | DetID | PixID | Counts | Sigma | Mean | Median | Sigma |
| A | 12 | 3 | 560781 | 16885.32 | 130 | 125 | 33.2 |
| A | 15 | 174 | 268064 | 8069.54 | 130 | 125 | 33.2 |
| A | 4 | 175 | 217582 | 6549.17 | 130 | 125 | 33.2 |
| B | 5 | 185 | 197099 | 6087.48 | 144 | 139 | 32.4 |
| B | 8 | 128 | 17025 | 521.9 | 144 | 139 | 32.4 |
| B | 4 | 81 | 15357 | 470.35 | 144 | 139 | 32.4 |
| C | 4 | 12 | 1125940 | 39893.0 | 100 | 99 | 28.2 |
| C | 15 | 179 | 483908 | 17143.27 | 100 | 99 | 28.2 |
| C | 15 | 248 | 56561 | 2000.67 | 100 | 99 | 28.2 |
| D | 11 | 176 | 150423 | 3691.81 | 147 | 141 | 40.7 |
| D | 2 | 153 | 38457 | 941.27 | 147 | 141 | 40.7 |
| D | 6 | 30 | 18876 | 460.24 | 147 | 141 | 40.7 |
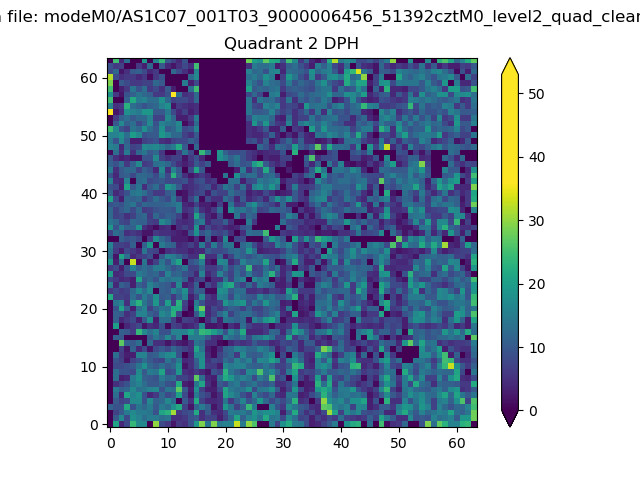
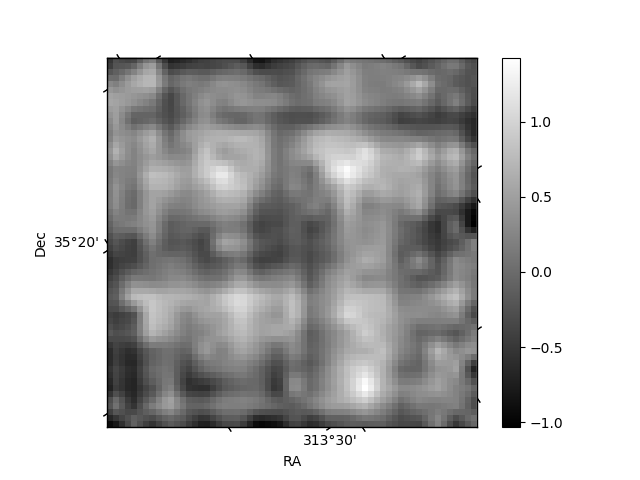
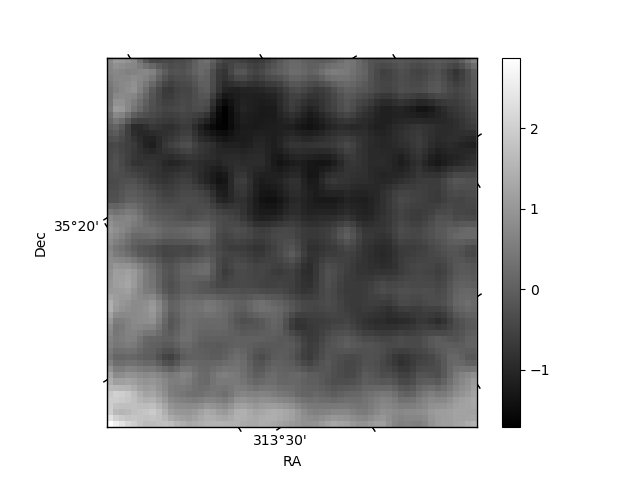
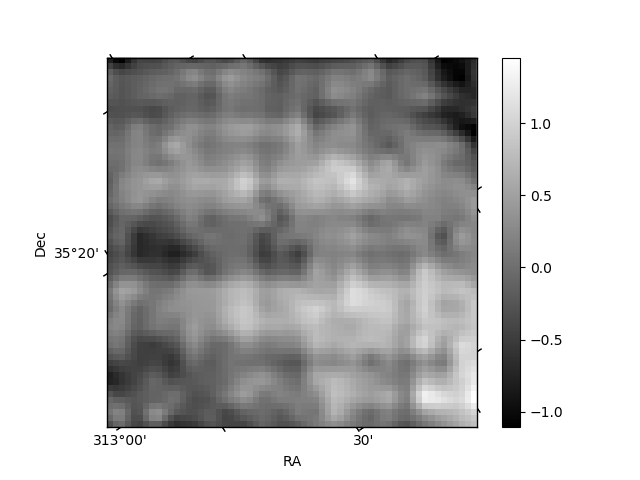
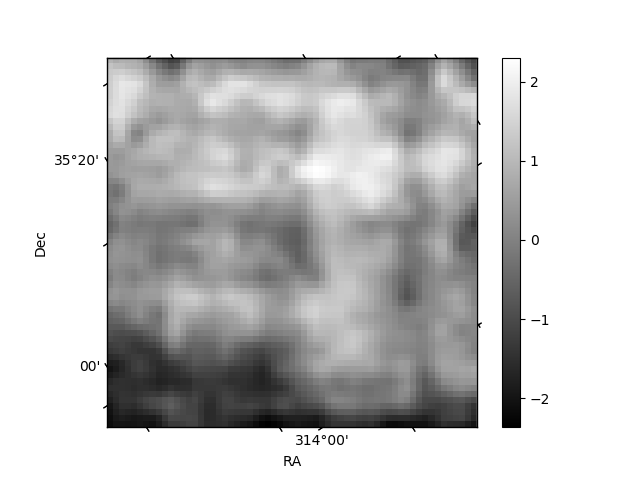
Histogram calculated using DETX and DETY for each event in the final _common_clean file
| Quadrant A | 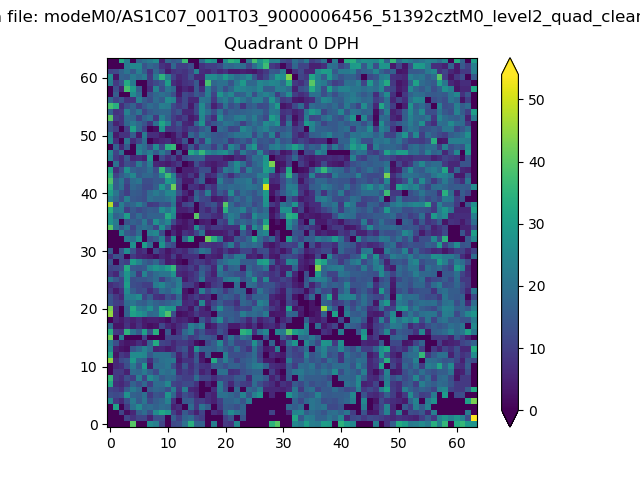 |
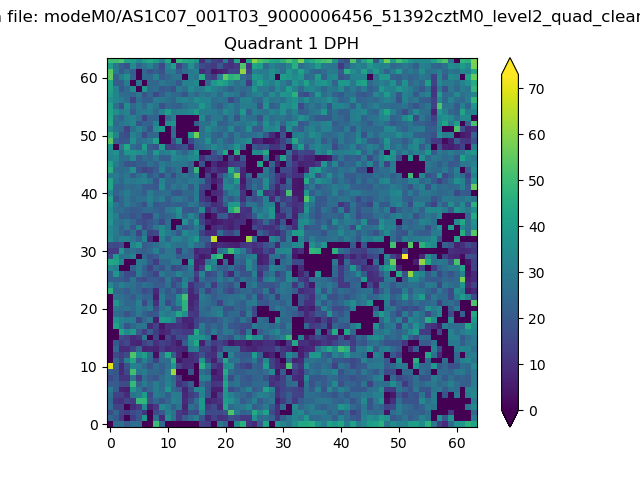 |
Quadrant B |
|---|---|---|---|
| Quadrant D | 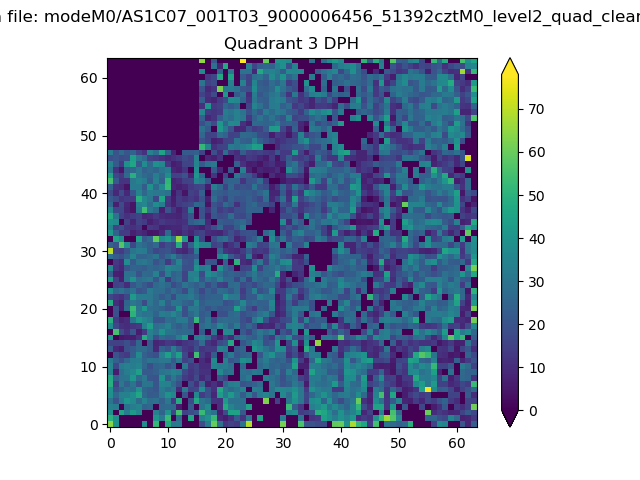 |
 |
Quadrant C |
| Plot type | Count rate plots | Images |
|---|---|---|
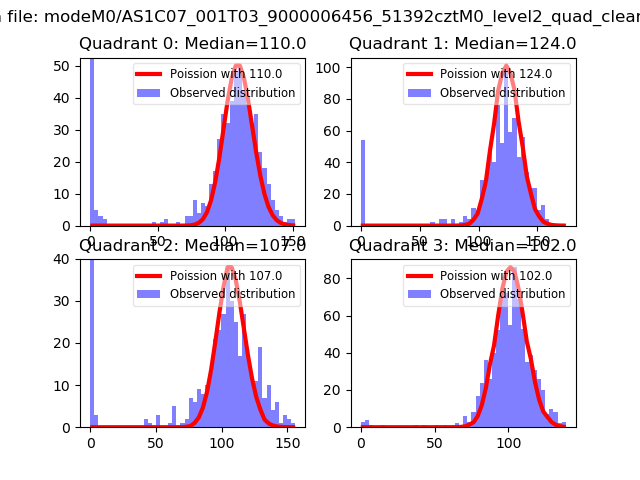
| Comparison with Poisson distribution Blue bars denote a histogram of data divided into 1 sec bins. Red curve is a Poisson curve with rate = median count rate of data. |
 |
 |
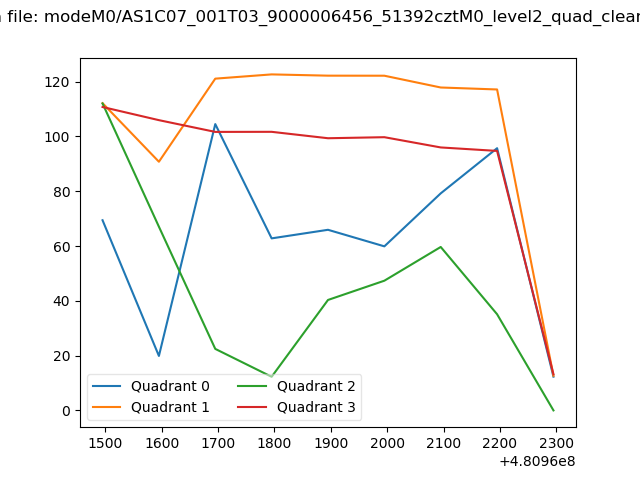
| Quadrant-wise count rates Data is divided into 100 sec bins |
 |
|
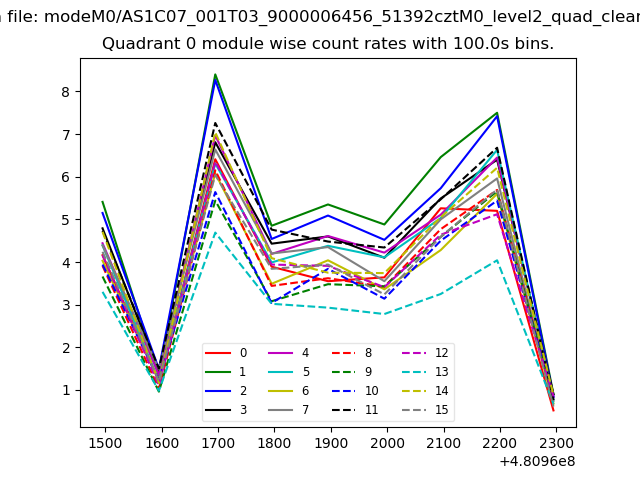
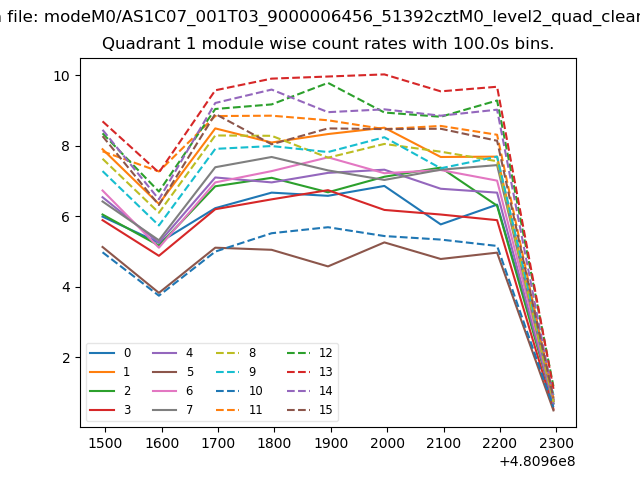
| Module-wise count rates for Quadrant A Data is divided into 100 sec bins |
 |
 |
| Module-wise count rates for Quadrant B Data is divided into 100 sec bins |
 |
 |
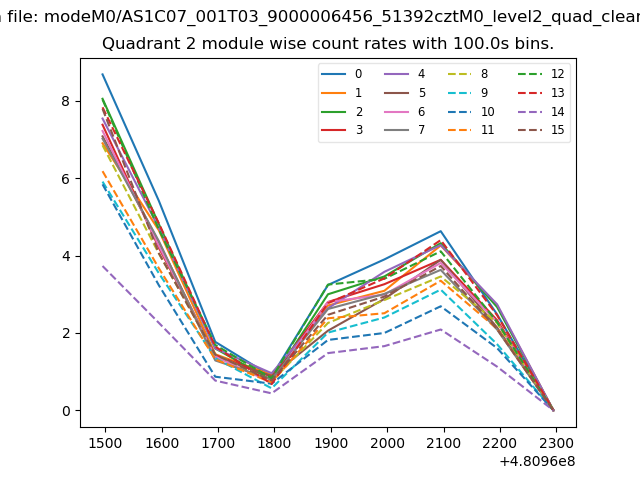
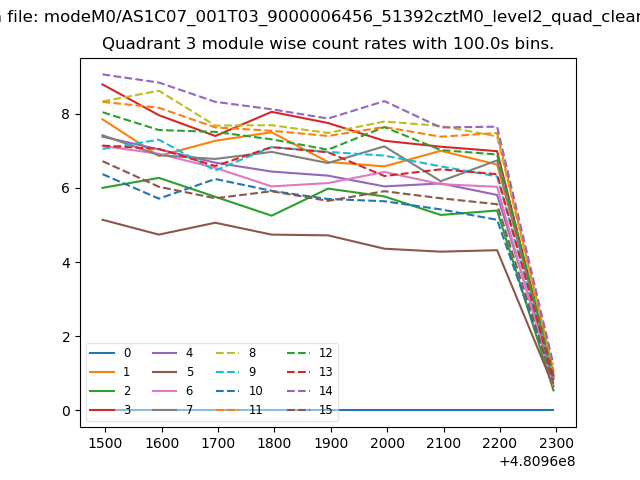
| Module-wise count rates for Quadrant C Data is divided into 100 sec bins |
 |
 |
| Module-wise count rates for Quadrant D Data is divided into 100 sec bins |
 |
 |
| Parameter | Plot |
|---|---|
| CZT HV Monitor | 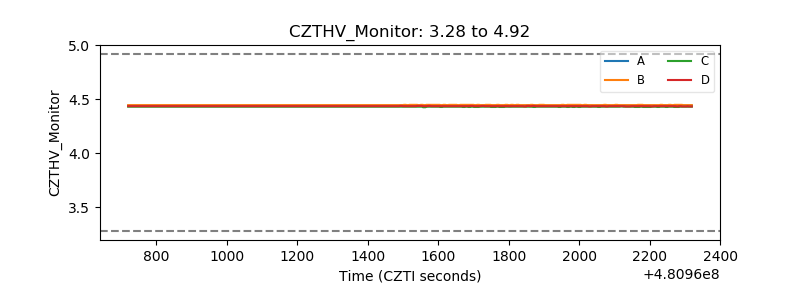 |
| D_VDD | 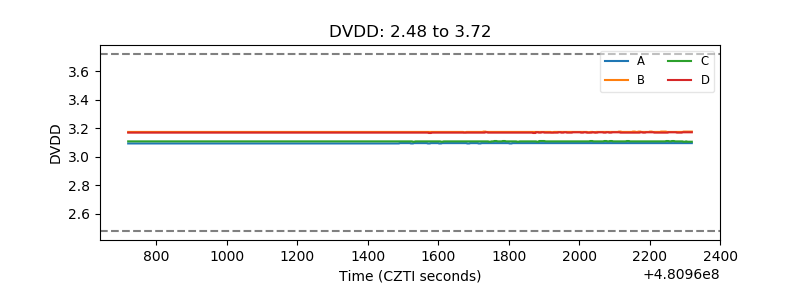 |
| Temperature 1 | 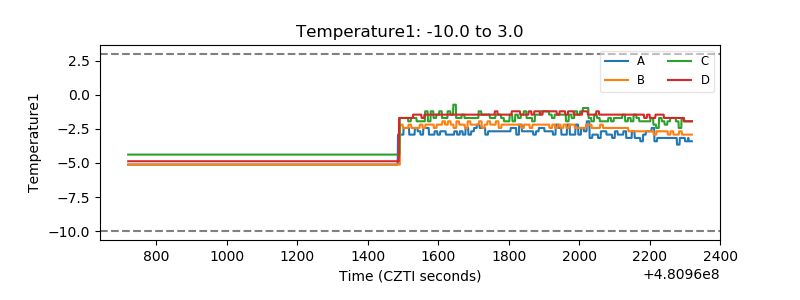 |
| Veto HV Monitor | 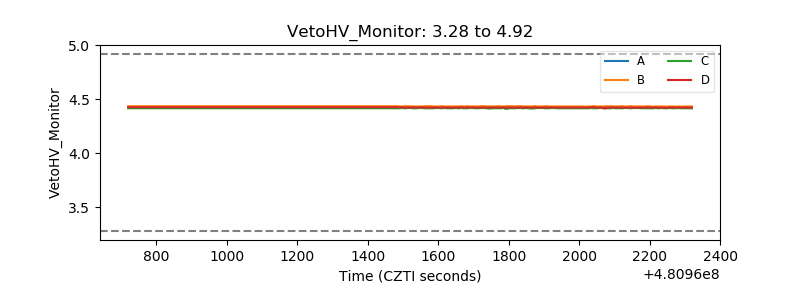 |
| Veto LLD | 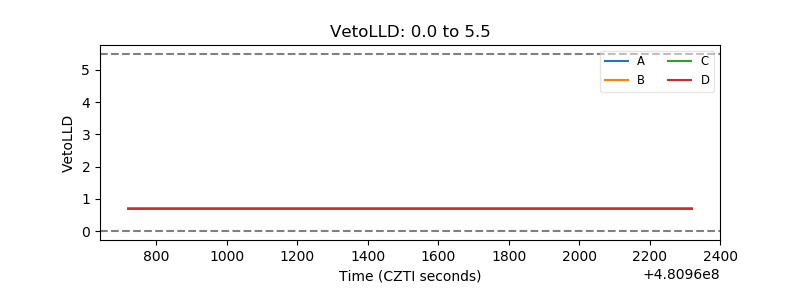 |
| Alpha Counter | 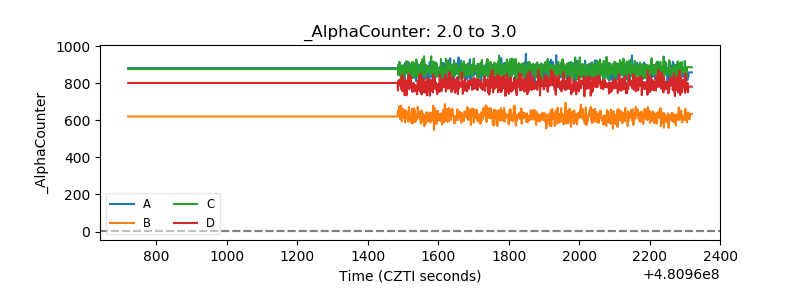 |
| _CPM_Rate | 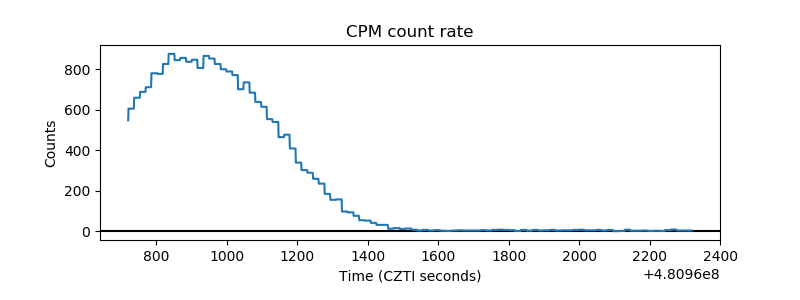 |
| CZT Counter | 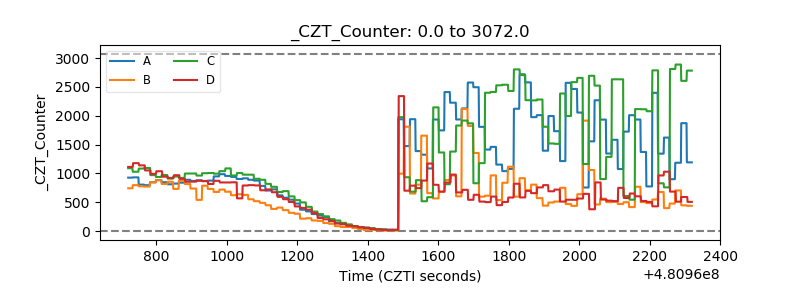 |
| +2.5 Volts monitor | 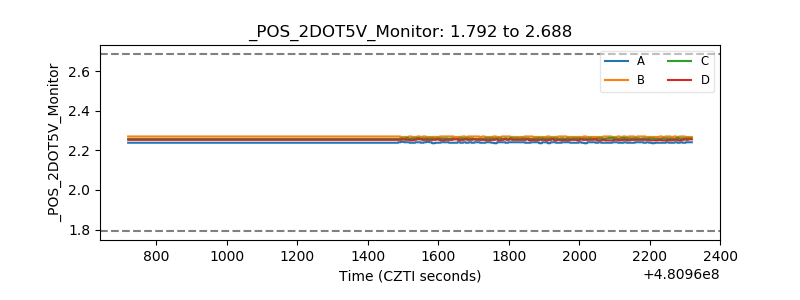 |
| +5 Volts monitor | 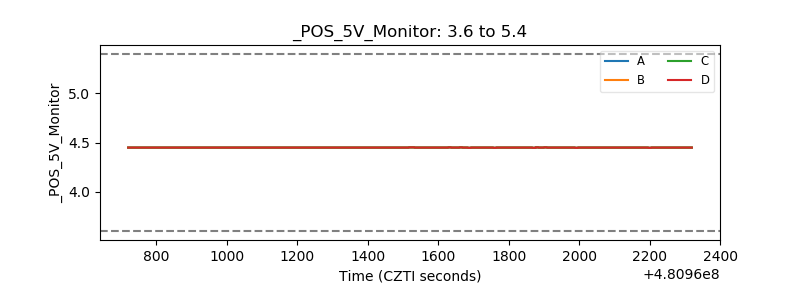 |
| _ROLL_ROT | 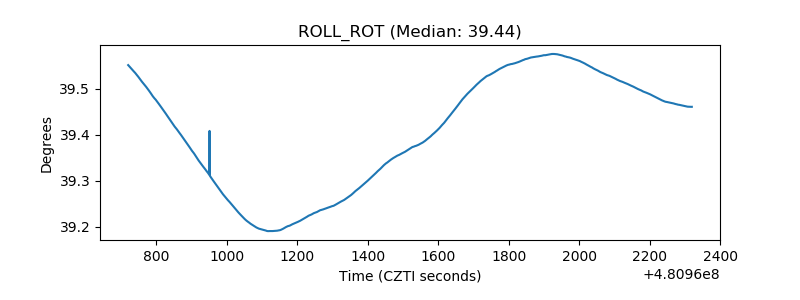 |
| _Roll_DEC | 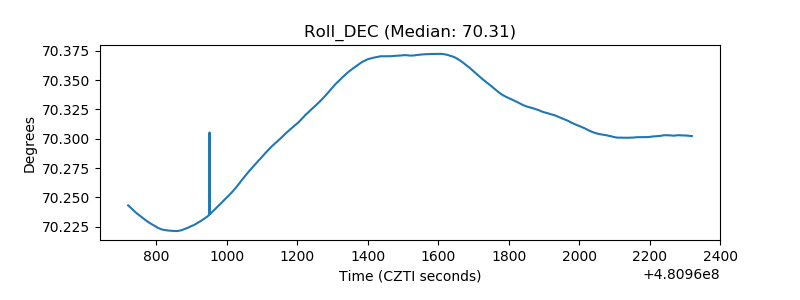 |
| _Roll_RA | 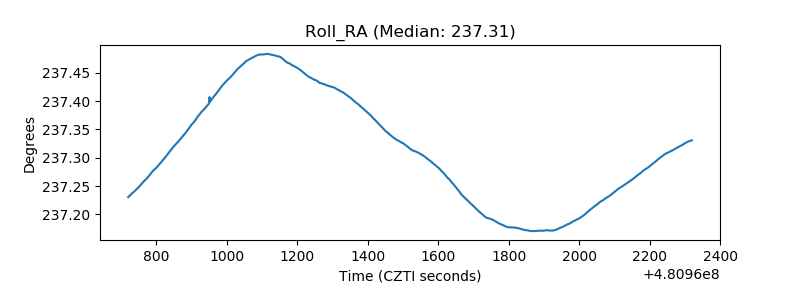 |
| Veto Counter | 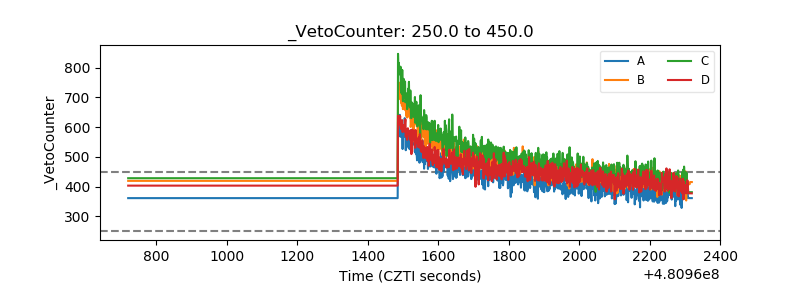 |