| Param | Original file | Final file |
|---|---|---|
| Filename | modeM0/AS1C07_001T03_9000006456_51393cztM0_level2.fits | modeM0/AS1C07_001T03_9000006456_51393cztM0_level2_quad_clean.evt |
| Size (bytes) | 114,647,040 | 21,594,240 |
| Size | 109.3 MB | 20.6 MB |
| Events in quadrant A | 1,574,230 | 140,067 |
| Events in quadrant B | 820,321 | 155,305 |
| Events in quadrant C | 884,064 | 133,151 |
| Events in quadrant D | 859,345 | 125,940 |
| Mode SS | |||
|---|---|---|---|
| Quadrant | BADHDUFLAG | Total packets | Discarded packets |
| A | 0 | 29 | 1 |
| B | 0 | 29 | 1 |
| C | 0 | 32 | 4 |
| D | 0 | 29 | 1 |
| Mode M0 | |||
|---|---|---|---|
| Quadrant | BADHDUFLAG | Total packets | Discarded packets |
| A | 0 | 5781 | 164 |
| B | 0 | 3385 | 108 |
| C | 0 | 3624 | 200 |
| D | 0 | 3476 | 74 |
| Mode M9 | |||
|---|---|---|---|
| Quadrant | BADHDUFLAG | Total packets | Discarded packets |
| A | 0 | 9 | 3 |
| B | 0 | 7 | 1 |
| C | 0 | 10 | 4 |
| D | 0 | 6 | 0 |
| Quadrant | Total seconds | Saturated seconds | Saturation percentage |
|---|---|---|---|
| A | 1329 | 63 | 4.740406% |
| B | 1326 | 35 | 2.639517% |
| C | 1328 | 70 | 5.271084% |
| D | 1328 | 37 | 2.786145% |
Noise dominated data is calculated using 1-second bins in cleaned event files. If a bin has >2000 counts, and if more than 50% of those come from <1% of pixels, then it is considered to be noise-dominated and hence unusable.
| Quadrant | # 1 sec bins | Bins with >0 counts | Bins with >2000 counts | High rate bins dominated by noise | Noise dominated (total time) | Noise dominated (detector-on time) | Marked lightcurve |
|---|---|---|---|---|---|---|---|
| A | 1333 | 1333 | 38 | 38 | 2.85% | 2.85% | 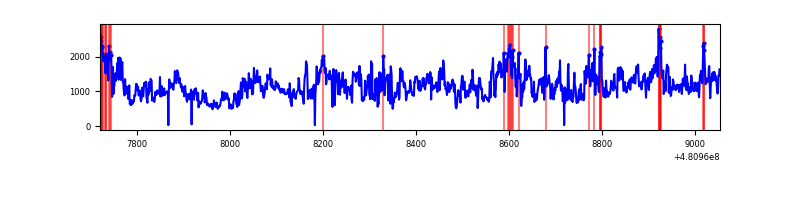 |
| B | 1333 | 1331 | 18 | 18 | 1.35% | 1.35% | 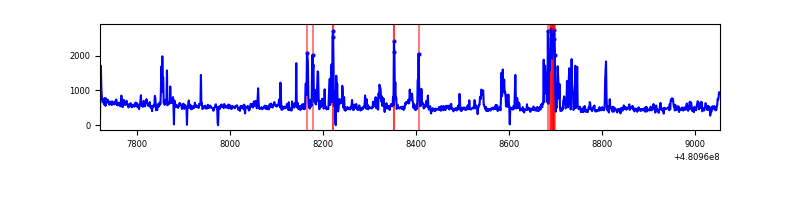 |
| C | 1332 | 1331 | 64 | 64 | 4.80% | 4.81% | 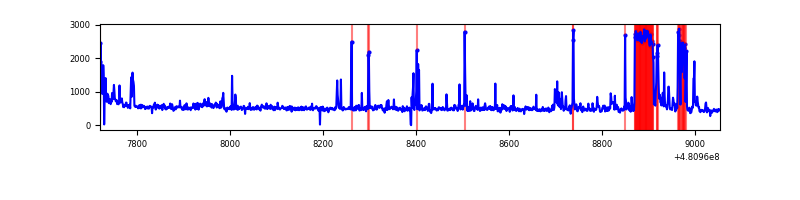 |
| D | 1332 | 1332 | 29 | 29 | 2.18% | 2.18% | 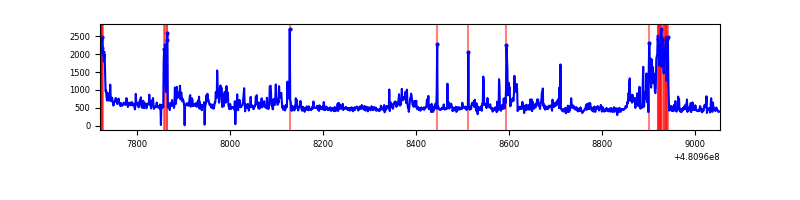 |
Top three noisy pixels from each quadrant. If the there are fewer than three noisy pixels in the level2.evt file, extra rows are filled as -1
| Pixel properties | Quadrant properties | ||||||
|---|---|---|---|---|---|---|---|
| Quadrant | DetID | PixID | Counts | Sigma | Mean | Median | Sigma |
| A | 12 | 3 | 745598 | 18778.26 | 156 | 151 | 39.7 |
| A | 12 | 194 | 87138 | 2191.24 | 156 | 151 | 39.7 |
| A | 3 | 14 | 51067 | 1282.59 | 156 | 151 | 39.7 |
| B | 0 | 216 | 123294 | 3450.61 | 158 | 153 | 35.7 |
| B | 4 | 81 | 47739 | 1333.44 | 158 | 153 | 35.7 |
| B | 5 | 172 | 5135 | 139.6 | 158 | 153 | 35.7 |
| C | 12 | 250 | 148634 | 3427.44 | 154 | 152 | 43.3 |
| C | 13 | 3 | 43447 | 999.39 | 154 | 152 | 43.3 |
| C | 15 | 179 | 18863 | 431.91 | 154 | 152 | 43.3 |
| D | 3 | 12 | 100753 | 2292.47 | 155 | 149 | 43.9 |
| D | 11 | 176 | 65596 | 1491.34 | 155 | 149 | 43.9 |
| D | 15 | 108 | 21205 | 479.8 | 155 | 149 | 43.9 |
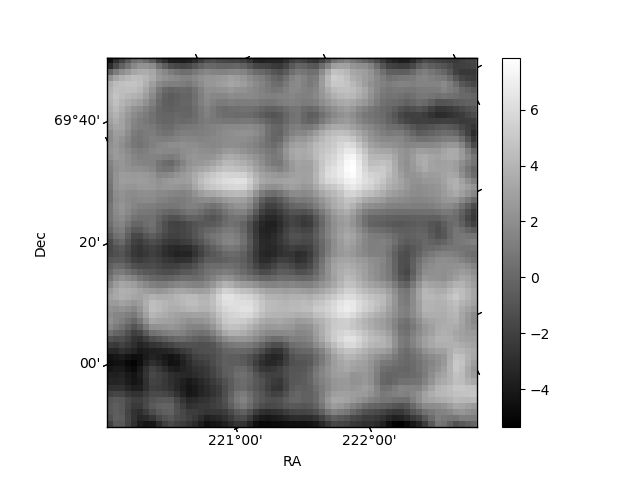
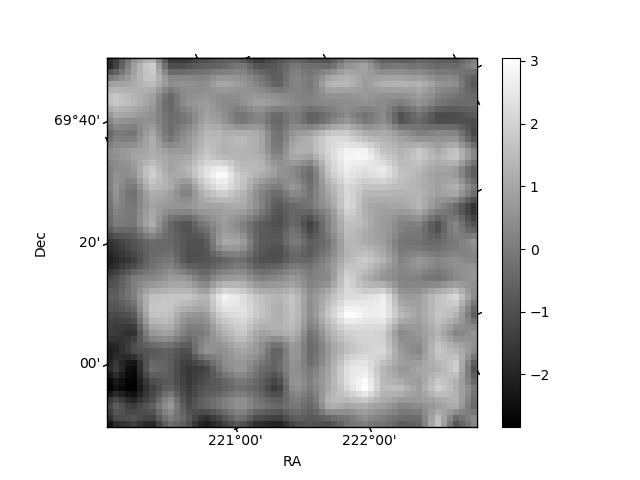
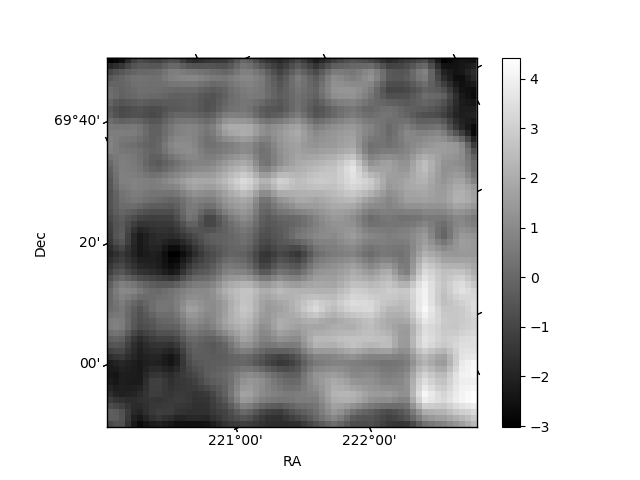
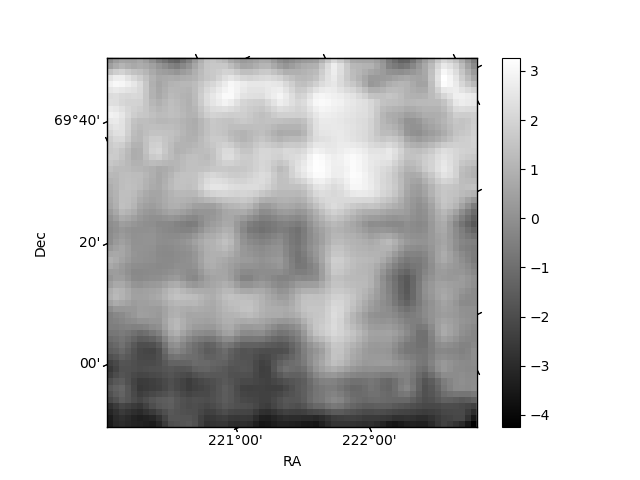
Histogram calculated using DETX and DETY for each event in the final _common_clean file
| Quadrant A | 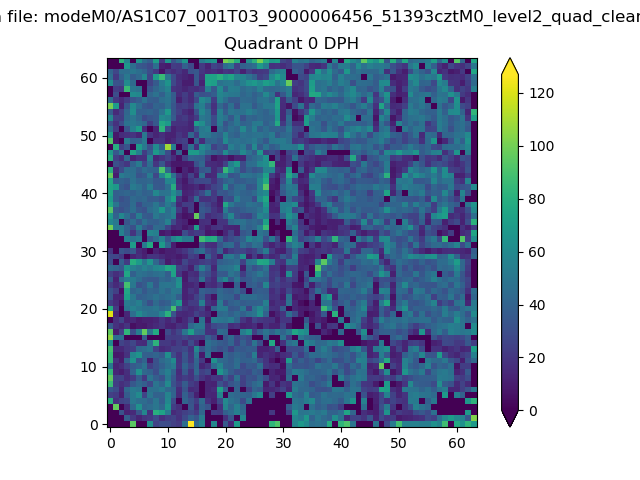 |
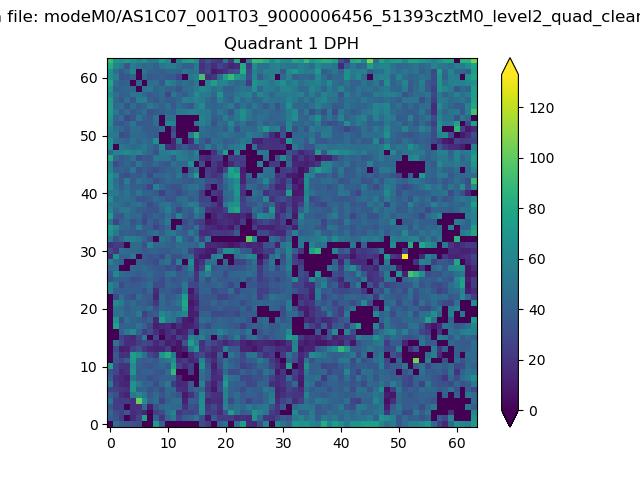 |
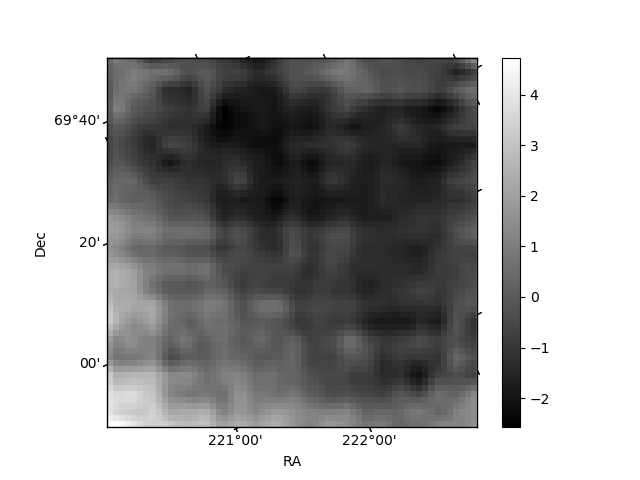
Quadrant B |
|---|---|---|---|
| Quadrant D | 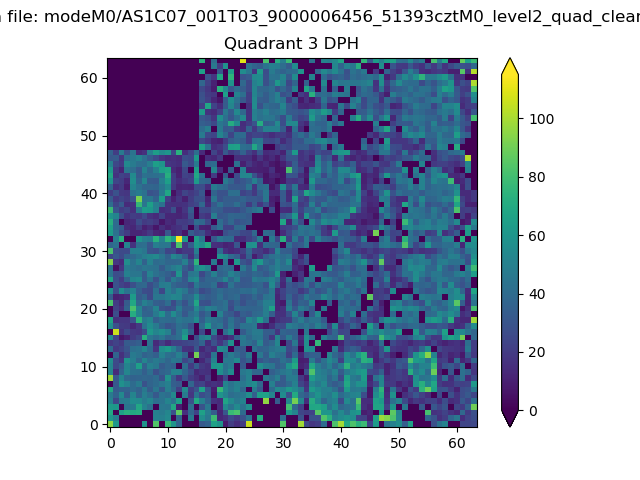 |
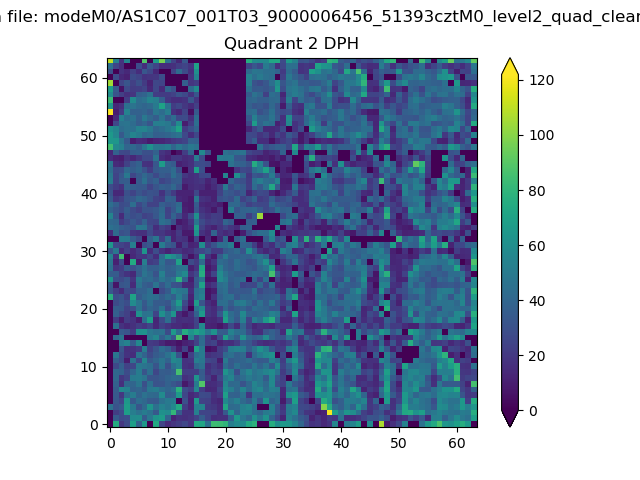 |
Quadrant C |
| Plot type | Count rate plots | Images |
|---|---|---|
| Comparison with Poisson distribution Blue bars denote a histogram of data divided into 1 sec bins. Red curve is a Poisson curve with rate = median count rate of data. |
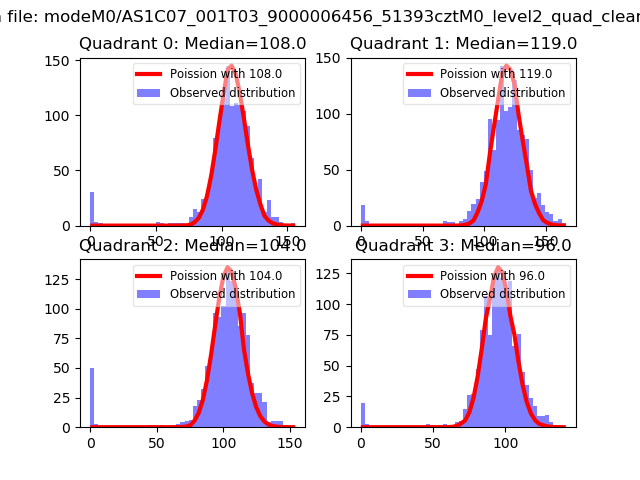 |
 |
| Quadrant-wise count rates Data is divided into 100 sec bins |
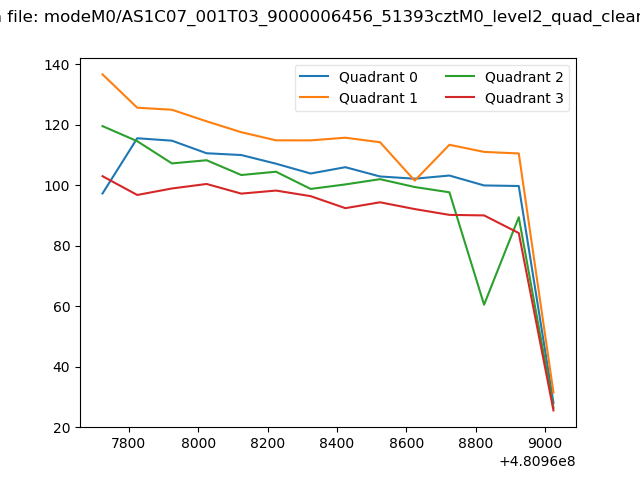 |
|
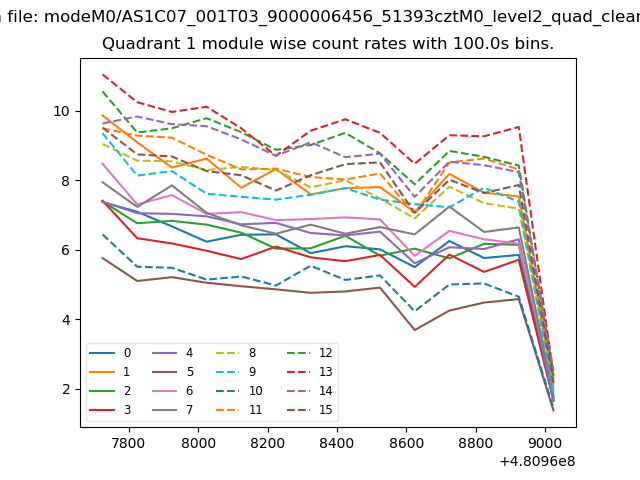
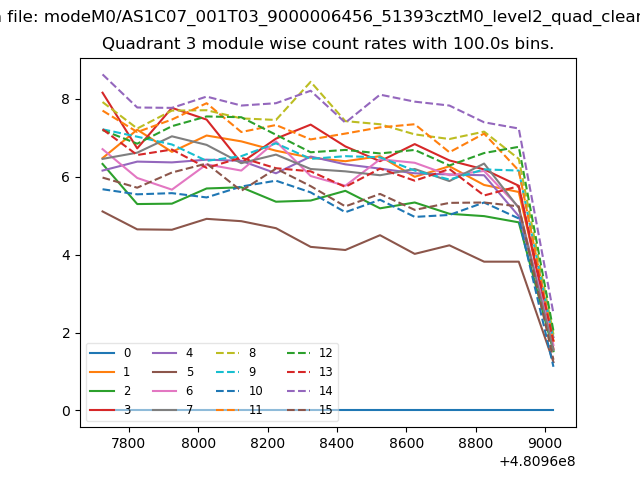
| Module-wise count rates for Quadrant A Data is divided into 100 sec bins |
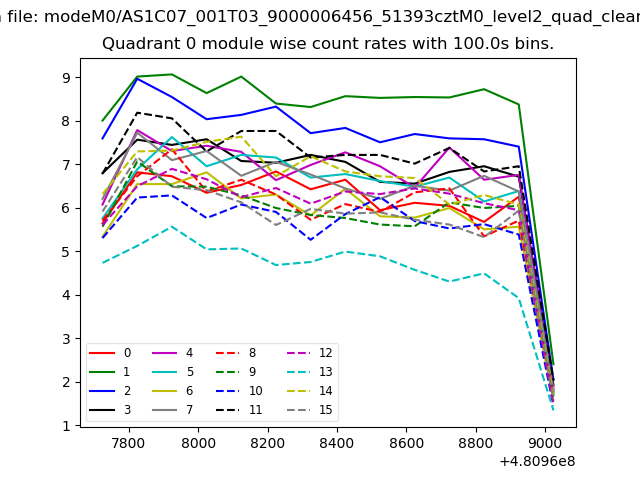 |
 |
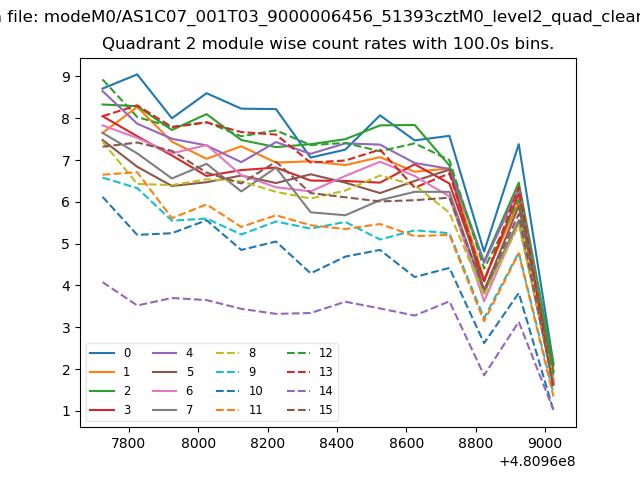
| Module-wise count rates for Quadrant B Data is divided into 100 sec bins |
 |
 |
| Module-wise count rates for Quadrant C Data is divided into 100 sec bins |
 |
 |
| Module-wise count rates for Quadrant D Data is divided into 100 sec bins |
 |
 |
| Parameter | Plot |
|---|---|
| CZT HV Monitor | 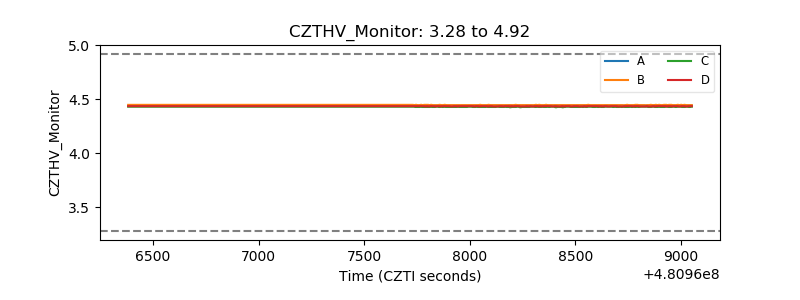 |
| D_VDD | 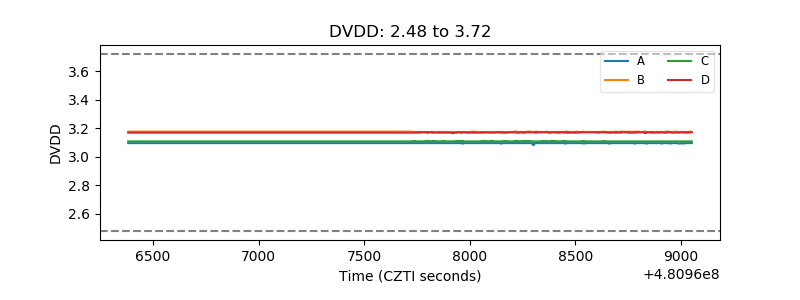 |
| Temperature 1 | 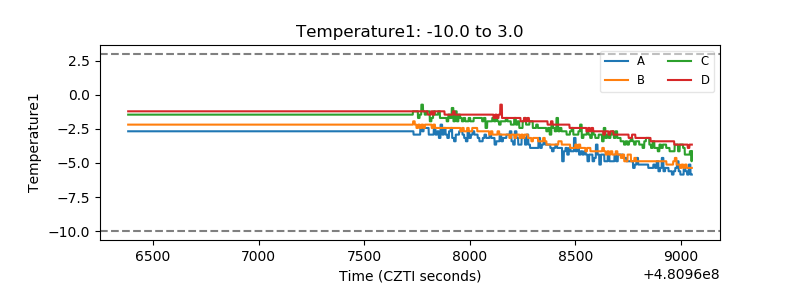 |
| Veto HV Monitor | 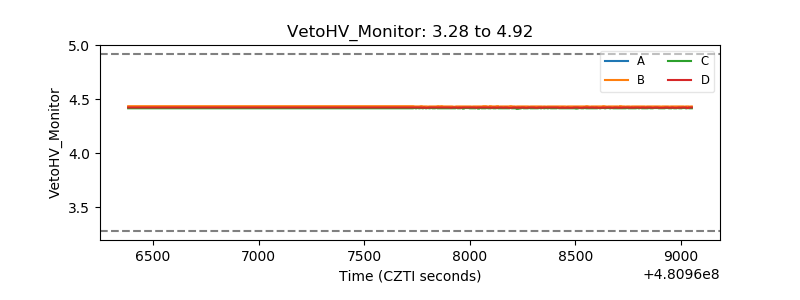 |
| Veto LLD | 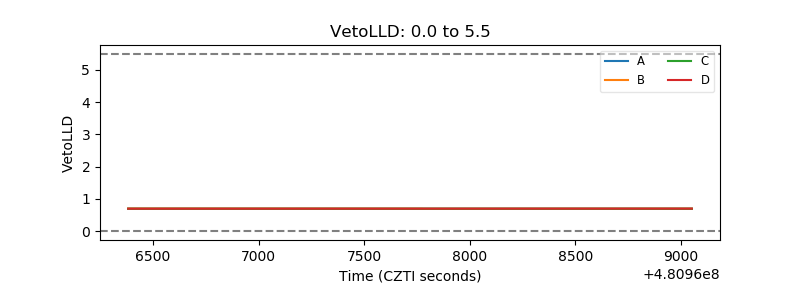 |
| Alpha Counter | 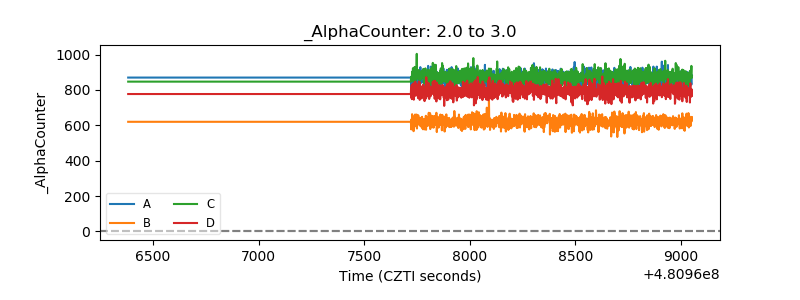 |
| _CPM_Rate | 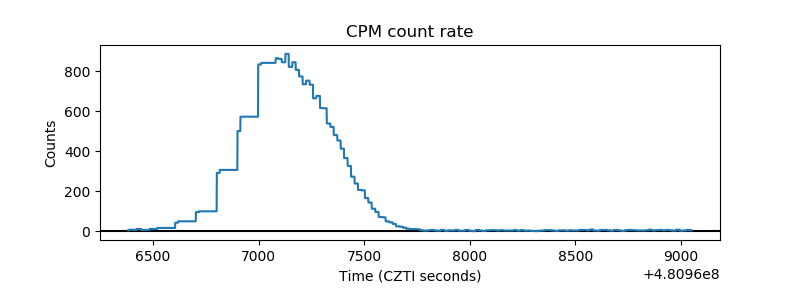 |
| CZT Counter | 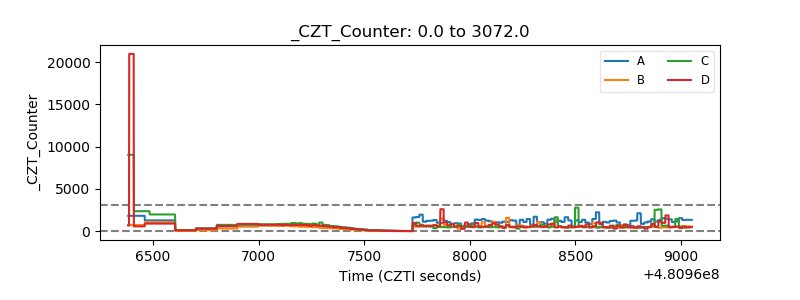 |
| +2.5 Volts monitor | 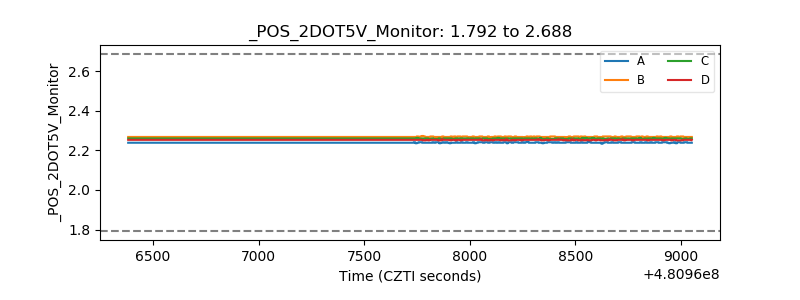 |
| +5 Volts monitor | 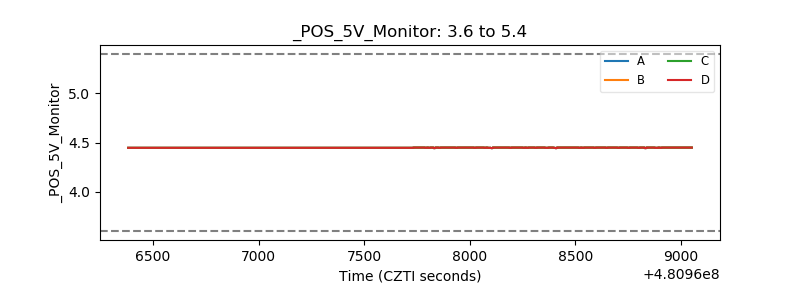 |
| _ROLL_ROT | 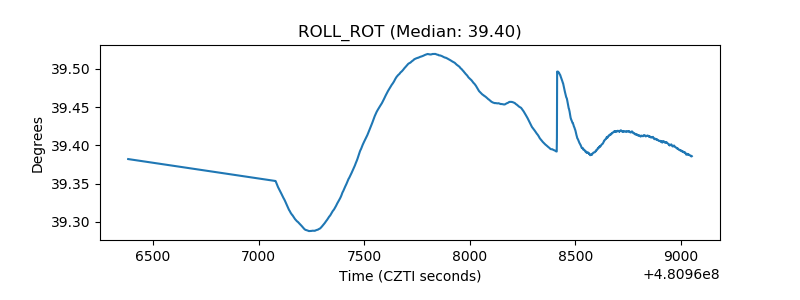 |
| _Roll_DEC | 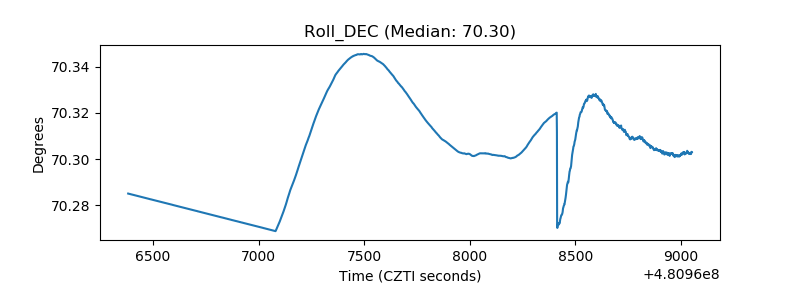 |
| _Roll_RA | 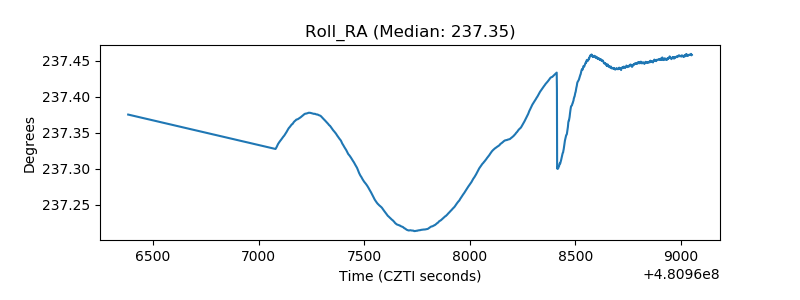 |
| Veto Counter | 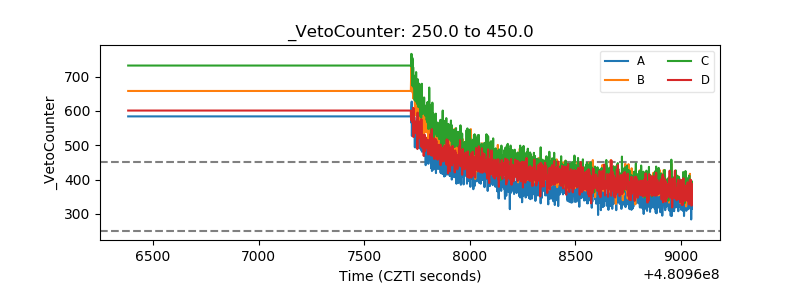 |